
A quiet year for problems in the polar bear capital of the world (Churchill, Manitoba) so far – despite this year tying for the second-lowest minimum since 1979 – and the ice is growing fast. In fact, Arctic ice growth in the second half of September was rapid and there is now more ice than there was at this date in 2007 and 2012 (when polar bears in those regions considered most at risk did not die off in droves).

Pessimistic polar bear specialists are wrong – polar bears are much more resilient to low sea ice levels in summer than they assume: their own data from low summer ice years proves it. If you’ll recall from my previous post, polar bears seem to have barely survived the extensive sea ice coverage during the Last Glacial Maximum – in other words, too much ice (even over the short term) is their biggest threat. Polar bear numbers, as confirmed by the latest estimates in the 2015 IUCN Red List assessment, are higher now than they have been since the 1960s, despite almost 10 years of summer sea ice minimums below 5.0 mk2.
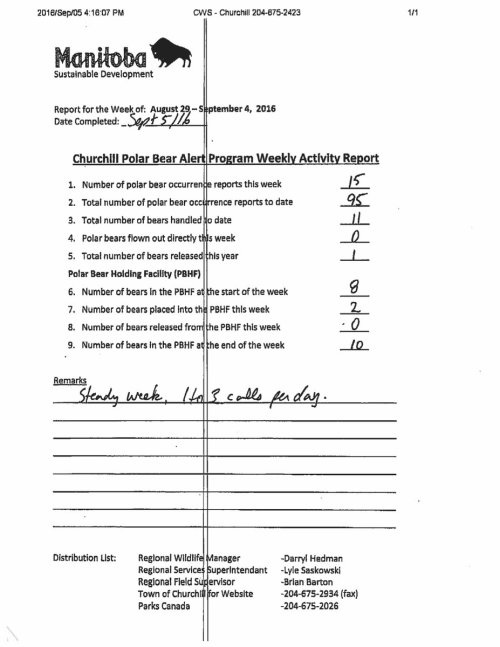
Churchill Polar Bear Alert reports and Arctic sea ice comparisons at this date, in detail below.
Churchill polar bears
Let’s take a look at the Churchill polar bear situation first, where bears are now in their 14th week onshore (with little to no food resources) – week 1 for 2016 was July 11-17. The last report from the Polar Bear Alert Program (October 3-9) is copied below:

See more reports at the end of this post, in the Footnotes. The “cooler weather” referred to above means below freezing night and day, see report from Environment Canada for 13 October:

Sea ice in Canada on 13 October 2016 (via Canadian Ice Service, CIS) shows the Archipelago ice is growing rapidly and Beaufort ice bearing down on the coasts of Alaska and the Northwest Territories:

Arctic sea ice growth compared
Using the NSIDC Masie sea ice chart archive, we can compare sea ice coverage at this date over time, which shows the differences in numbers as well as the areas of ice formation (click links for close-up image at source).
Here is the graph for the last 5 years for the Arctic Basin (where most of the ice resides at this time of year, an important refuge for bears that spend their entire lives at sea):

Here is the actual ice coverage for 12 October this year (below) and for selected previous years.
MASIE 12 Oct 2016 Day 286 5.5 mk2:

MASIE 12 Oct 2007 Day 285 5.2 mk2:

MASIE 12 Oct 2012 Day 286 4.6 mk2:

MASIE 12 Oct 2011 Day 285 5.7 mk2:

Footnotes
From my archive of 2016 Churchill Polar Bear Alert reports, counting back from week 12 (26 Sept – 2 Oct). Note that week 11 report is missing (Sept 19-25: it was never posted) and that Polar Bear Alert folks have been more vigilant than previously about dealing with bears close to town since a mauling in 2013:


You must be logged in to post a comment.