
You can’t figure out what’s going on with status updates from the IUCN Polar Bear Specialist Group (PBSG) without deconstructing the spin and the 2013 update is no exception. Here’s my travel guide, with a map, to the good news.
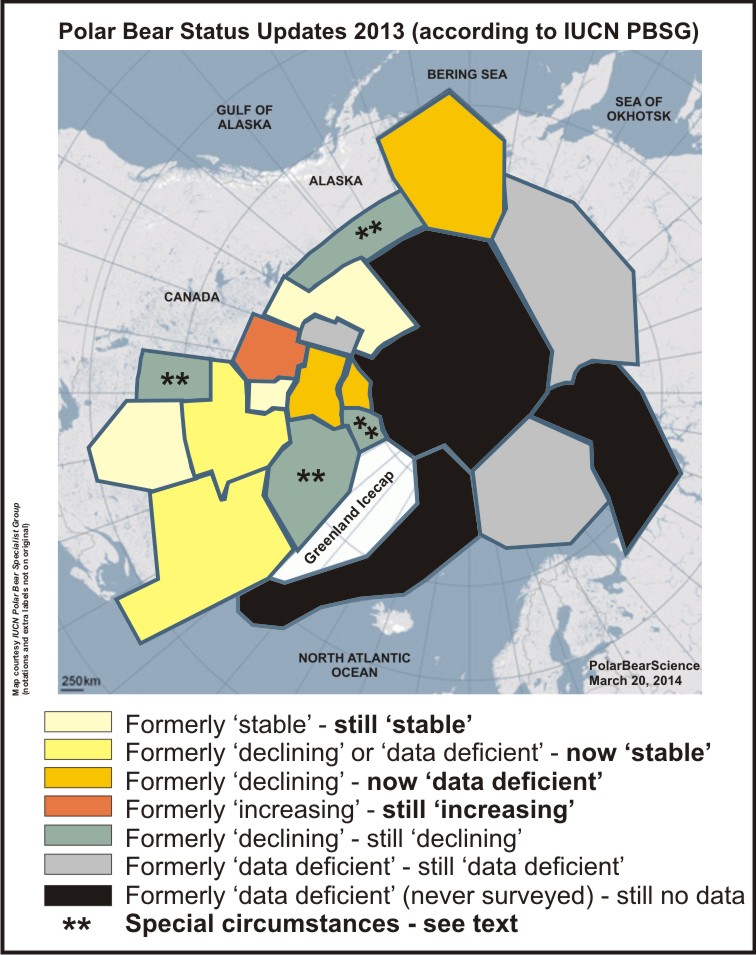
I’ve finally had a chance to go through all of the details provided with the 2013 PBSG status table (pdf here). It’s just about all good news, once you wade through the spin. Numbers aside, out of the 13 populations for which some kind of data exist, five populations are now classified by the PBSG as ‘stable’ (two more than 2009), one is still increasing, and three have been upgraded from ‘declining’ to ‘data deficient’ (I explain below why this is a promotion).
That leaves four that are still considered ‘declining’- two of those judgments are based primarily on concerns of overhunting, and one is based on a statistically insignificant decline that may not be valid and is being re-assessed (and really should have been upgraded to ‘data deficient’). That leaves only one population – Western Hudson Bay – where PBSG biologists tenaciously blame global warming for all changes to polar bear biology, and even then, the data supporting that conclusion is still not available.
“Special circumstances” noted on the map
**Western Hudson Bay (WHB) – despite a recent (2011) survey indicating the WHB population has not declined since 2004 as predicted 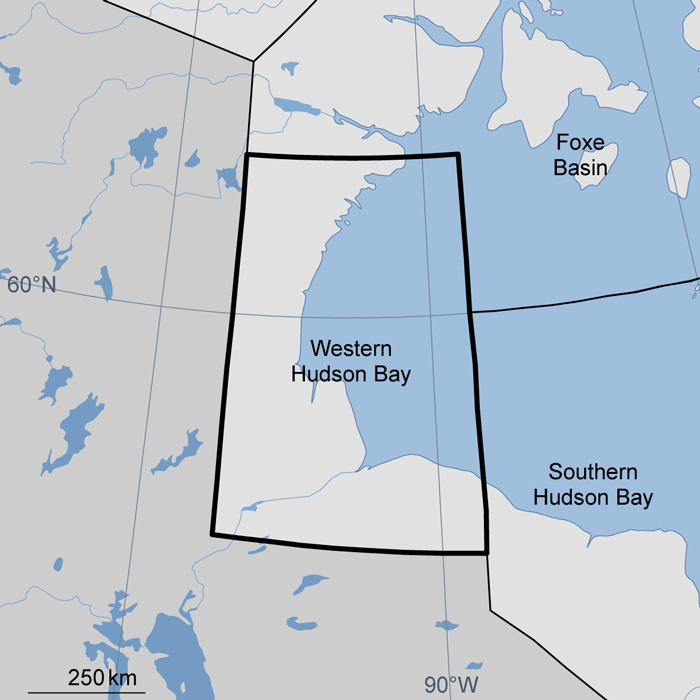 (it has been stable since 2004), the PBSG assessed WHB as ‘declining’ because, they said, there were “few observations of females with cubs” during the aerial survey and “earlier breakup, later freeze-up” of sea ice. This attempt to correlate ice coverage and population health disregards the fact that early breakup and late freeze-up in WHB have not occurred in the same year since 1999, according to polar bear biologist’s own published data (see graph below from Cherry et al. 2013, the most recent ice data available); sea ice maps since 2009 (see previous posts here, here and here) indicate no early breakup/late freeze-up for the last four years.

This is figure 2 from Cherry et al (2013). Note that the open circles on the top line represent freeze-up dates and the filled circles are the dates collared bears left the shore; the bottom line (filled and open triangles) shows breakup dates and days bears came ashore. Julian Day (JD) 340 is about December 6, while JD 316 is November 12. If you look carefully, you can see that breakup dates and freeze-up dates have not been really early/really late in the same year since 1999 — freeze-up was late in 2009 but breakup was late as well.
The PBSG also admitted they have based their WHB assessment on additional polar bear life history data that has not been published (not even in preliminary form):
“A new population estimate based on extensive continued Physical Capture-Recapture will be available in 2014 and, will provide an updated assessment of the long-term trend in population size and vital rates, that is not possible from a single aerial survey.”
** Baffin Bay (BB) – the assessment of ‘declining’ for BB is based on concerns of overharvest, predicted sea ice declines, and a documented decline in body condition (Rode et al. 2012: 12) that “may not be detected from on the ground 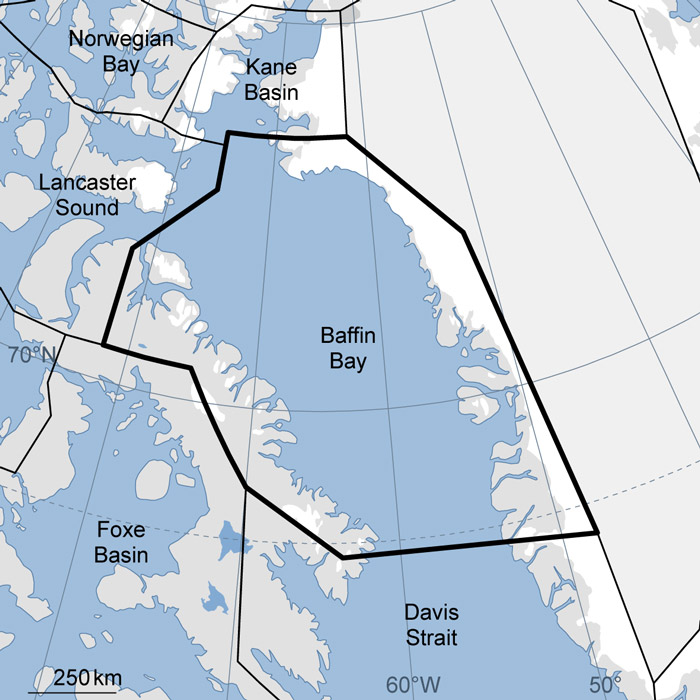 observations.” In other words, the amount of reduced body fat detected by biologists may be so slight as to be not noticeable by experienced observers. In addition, despite the PBSG ‘concern’ over sea ice declines, a recent study showed there was twice as much sea ice available in Baffin Bay over the summer (May 15-October 15) as in Davis Strait to the south, where bear numbers increased (Rode et al. 2012:12) – no wonder the decline in body fat they blame on reduced sea ice was not detectable without calipers! Finally, all of this is based on a single survey of polar bear numbers in 1997 – an aerial survey has just concluded but the report has not been released.
** Kane Basin (KB) – despite the fact that the last KB polar bear count  was done in 1997 (16 years ago), arguably making this population “data deficient,” the PBSG said it was ‘declining’ based on concerns of overhunting. It also stated concerns on the state of sea ice conditions (“reduced ice cover, earlier break-up, later freeze-up”) for which no data was provided. A new survey is apparently in progress.
** Southern Beaufort (SB) – the PBSG has still made much ado over the fact the last population count (2006) showed a decline,  even though it was not statistically significant and may be invalid regardless: it turns out the SB population may not be as discrete as previously thought. The PBSG admitted that bears move around so much between the Chukchi Sea and the Northern Beaufort, probably in response to variability in ice conditions, that a marked boundary shift for SB is being seriously considered on both western and eastern ends.
This suggests that the last population estimate that registered a decline may not have reflected bears dying due to reduced summer sea ice (as they assumed) but a movement of bears past the arbitrary boundaries established by the biologists — or, as they put it, “it is important to note that there is the potential for un-modeled spatial heterogeneity in mark-recapture sampling that could bias survival and abundance estimates.” A “re-assessment of survival and abundance” is underway and results are expected in late 2014.
Why not change the status from ‘declining’ to ‘data deficient’ until the results are in, as was done for several others noted below? PBSG said this:
“The SB subpopulation is currently considered to be declining due to a negative trend in sea ice conditions, particularly over the continental shelf, resulting from the continuing effects of climate warming.” [my bold]
Why the change from ‘declining’ to ‘data deficient’ is an upgrade
This has to be the strangest change of all, which I consider an upgrade by the PBSG because in all instances, it takes recently available good news into account and because there is no other category between ‘declining’ and ‘stable.’ Remarkably, three populations had this backhanded upgrade in status:
Chukchi Sea (CS) – despite the fact that virtually no 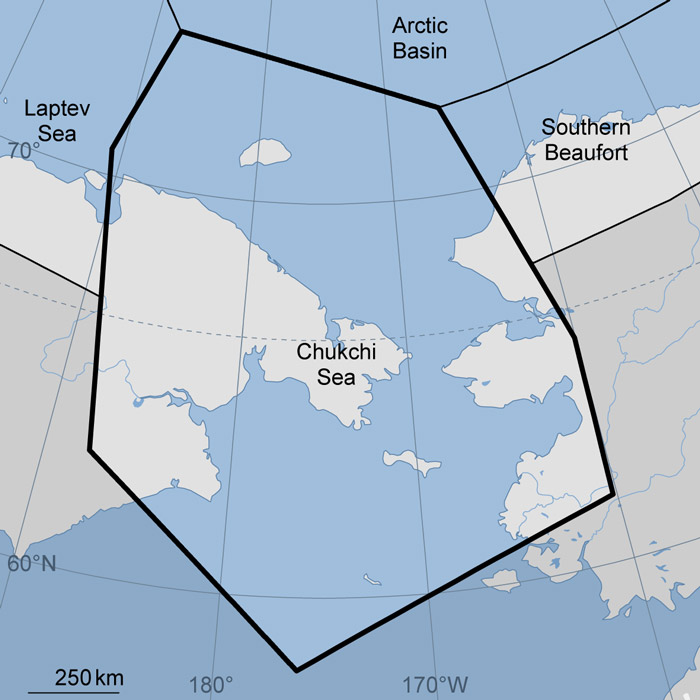 information was available on CS bears (including a population estimate), the PBSG previously classified the CS population as ‘declining,’ based primarily on assumed negative effects of summer sea ice declines and undocumented concerns of poaching. However, a recent study of Chukchi Sea bears showed them to be in excellent condition and reproducing well, which the PBSG acknowledged: “U.S. capture-recapture research [the kind that gives the most detailed information] conducted spring 2008-2011 indicates good body condition and reproduction, suggesting capacity for positive natural growth despite sea ice loss.”
Despite this good news, which contradicted their assumptions, the reasons PBSG gave for assigning the ‘data deficient’ status to CS were based on exactly the same reasons they gave in 2009/2010 for the status of ‘declining,’ although the exact wording is slightly different: they still predict that sea ice declines will have a negative impact (despite strong evidence to the contrary), they still say levels of illegal harvest are a concern (without any evidence to back it up) and they are still concerned that they don’t have a population estimate (which did not formerly stop them from saying the population was ‘declining’).
As a consequence, I conclude that this change from ‘declining’ to ‘data deficient’ is in fact an oblique upgrade in conservation status and is used partly because there is no other category other than ‘stable’ for subpopulations that can no longer be justified as being ‘declining.’
Lancaster Sound (LS) – despite out of date population information (1998), the last PBSG assessment classified LS as ‘declining,’ due primarily to concerns of the “highly selective harvest of male polar bears.” The upgrade to ‘data deficient’ pays lip-service to Inuit TEK [Traditional Ecological Knowledge] that suggests the population is stable or increasing and the fact that selective harvest of male bears has decreased since 2008. A more up-to-date population estimate seems to be the only reason for not considering this population ‘stable.’
Norwegian Bay (NW) – despite no new data available since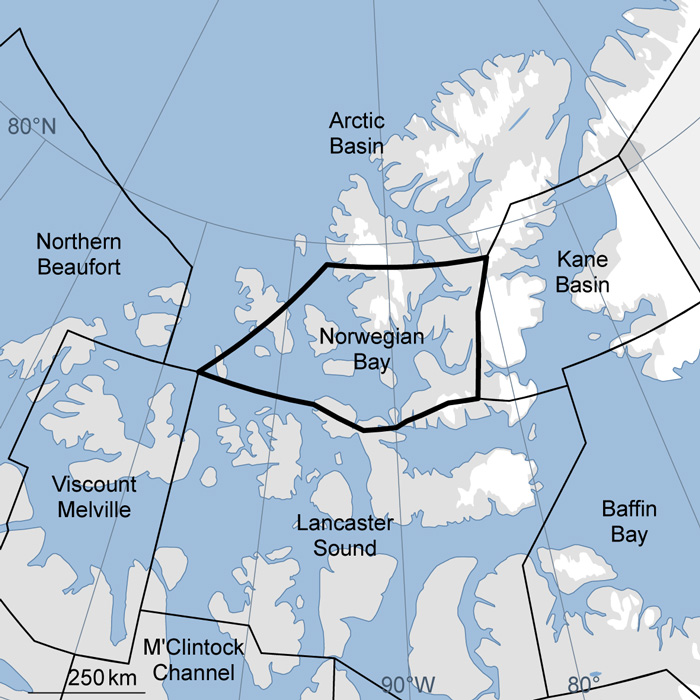 1998, the PBSG previously assessed this subpopulation trend as ‘declining’ (Obbard et al. 2010). Why they decided that NW was declining in the first place is not really clear (it’s a small population but harvest rates are low and there is lots of sea ice) but why the change? All that I can see is this comment: “TEK [Traditional Ecological Knowledge] suggests the population is stable or increasing.” As for the Chukchi Sea and Lancaster Sound assessments above, it suggests that the change from ‘declining’ to ‘data deficient’ is the PBSG’s way of upgrading the status without changing it to ‘stable.’
Conclusions
If you doubt this polar bear news is primarily good, ask yourself why there has not been a single mention of these changes in mainstream media outlets, more than a month after they were unveiled (February 14, 2014).
As we have seen over the last couple of years, what issues polar bear biologists choose to promote says a lot about their agenda. But what they don’t promote, such as the excellent news revealed in the Chukchi Sea polar bear report last year, and this status update, says even more.
[Previous posts on the 2013 status update here and here]
References
Obbard, M.E., Theimann, G.W., Peacock, E. and DeBryn, T.D. (eds.) 2010. Polar Bears: Proceedings of the 15th meeting of the Polar Bear Specialists Group IUCN/SSC, 29 June-3 July, 2009, Copenhagen, Denmark. Gland, Switzerland and Cambridge UK, IUCN.
Cherry, S.G., Derocher, A.E., Thiemann, G.W., Lunn, N.J. 2013. Migration phenology and seasonal fidelity of an Arctic marine predator in relation to sea ice dynamics. Journal of Animal Ecology 82:912-921.
Polar Bear News 2013-14. 2013. Polar bear newsletter of the US Fish & Wildlife Service, Anchorage, Alaska. Pdf here.
Rode, K.D., Peacock, E., Taylor, M., Stirling, I., Born, E.W., Laidre, K.L., and Wiig, Ø. 2012. A tale of two polar bear populations: ice habitat, harvest, and body condition. Population Ecology 54:3-18. http://link.springer.com/article/10.1007/s10144-011-0299-9


You must be logged in to post a comment.