Monthly Archives: June 2018

Hudson Bay sea ice update: more ice in the east than usual but less in the west

There’s almost more blue in the Canadian Ice Service “departure from normal” charts for this week than red, which means more sea ice than usual, especially in the eastern half of the bay and northern Labrador. Eventually, the melting ice will force polar bears ashore where they will fast for 4-5 months, living off the fat they’ve put on over the spring feeding season.

Hudson Bay weekly departure from normal 2018 June 25

Continue reading

Hansen’s 1988 climate change testimony was the answer to Stirling’s polar bear problem

Last week’s media coverage made me realize that James Hansen’s testimony to a US Senate committee in 1988 provided well-timed answer to a vexatious problem facing polar bear biologist Ian Stirling. Thirty years ago, Stirling was struggling to understand why polar bear productivity in Western Hudson Bay had dropped.  He was ripe for the suggestion from Hansen (and his follow-up paper) that human-caused global warming could be the explanation. An interview with Stirling and colleague Andrew Derocher published in 2016 helps connect the dots.DA-IS-measuring_Ian Stirling

Many bears were in poor condition in the fall of 1983 (Calvert et al. 1986:19, 24; Ramsay and Stirling 1988). In general, the 1980s saw weights of bears decline and cub mortality increase, with a marked increase in the loss of whole litters over what had been documented in the 1960s and 1970s (Derocher and Stirling 1992, 1995).

Until Hansen and climate change came along,  density-dependent effects (such as the number of bears out-pacing food supply) were seen as the most likely explanation. But sea ice decline blamed on human-caused global warming was suddenly a new possibility that Stirling soon embraced (Stirling and Derocher 1993). By the late 1990s, sea ice coverage on Hudson Bay had indeed declined but the correlation with polar bear productivity produced a weak trend that was not statistically significant (Stirling et al. 1999).

The 1999 Stirling paper did not provide scientific evidence to explain the 1980s decline in productivity as much as it presented a novel scapegoat to blame when a more plausible explanation could not be made.

Bottom line: Global warming could not have been the proximate cause of the productivity changes in WH polar bears documented during the 1980s but Stirling spent the next two and a half decades vigorously pushing climate change as the cause of all polar bear ills. Continue reading

Hudson Bay ice update: more thick first year ice habitat for polar bears in 2018 than 2004

Despite pronouncements from one polar bear specialist that “ice in Hudson Bay is in rapid retreat” a look back in time shows that there is more thick first year ice over the Bay this year for the week of the summer solstice than there was in 2004 – and much less open water than 1998.

Lunn et al 2016 EA cover image WH bear

Below, 2018, June 18 (the week of the summer solstice):

Hudson Bay weekly stage of development 2018 June 18

Compare the above to the same week coverage chart for 2004, below:
Hudson Bay weekly stage of development 2004_June 21

Ice coverage for some other recent years are shown below compared to 1998, the year the ice breakup pattern on Hudson Bay changed. Speed and melt sequences vary according to the amount of thick first year ice present, discussed previously here.

PS. If you’re wearing white today, flaunt it! Tell your friends and colleagues that you’re celebrating the success of polar bears despite such low summer sea ice since 2007 that 2/3 of them were predicted to disappear.
Continue reading

Wear white on the solstice to celebrate polar bear success in a warming world

Wednesday 21 June is the longest day of the year: wear something white tomorrow to acknowledge and celebrate the success of polar bears despite such low summer sea ice since 2007 that 2/3 of them were predicted to disappear.

white sunglasses

White hats

White tie, white shirt, white socks work too. Keep cool and signal to the world that you love outstanding survivors of climate change,  fat though they may be.

Cover image_Twenty Reasons_polarbearscience

Read here and here.

Global sea ice extent at 19 June 2018, well past the end of the intensive spring feeding period for polar bears:

masie_all_zoom_4km 2018 June 19

Svalbard polar bear data 2016 through 2018 shows no impact of low ice years

Last week, the Norwegian Polar Institute updated their online data collected for the Svalbard area to include 2017 and 2018 — fall sea ice data and spring polar bear data. Older data for comparison go back to 1993 for polar bears and 1979 for sea ice, showing little to no impact of the reduced ice present since 2016 in late spring through fall.

Svalbard polar bear_NP015991-isbjorn-JA

Here’s what the introduction says, in part [my bold]:

“…The polar bear habitat is changing rapidly, and the Polar Basin could be ice-free in summer within a few years. Gaining access to preferred denning areas and their favourite prey, ringed seals, depends on good sea ice conditions at the right time and place. The population probably increased considerably during the years after hunting was banned in 1973, and new knowledge indicates that the population hasn’t been reduced the last 10-15 years, in spite of a large reduction in available sea ice in the same period.”

See Aars et al. 2017 for details on the 2015 Svalbard polar bear population count, keeping in mind that the subpopulation region is called “Barents Sea” for a reason: only a few hundred individuals currently stick close to Svalbard year round while most Barents Sea bears inhabit the pack ice around Franz Josef Land to the east (Aars et al. 2009; Crockford 2017, 2018).
Continue reading

Environment Canada maps of polar bear population and status assessments 2018

Just out (6 June 2018) — new population assessment and status maps of the 19 polar bear subpopulations according to Environment Canada. Contrary to the map presented at the Range State meeting in February 2018 (pdf here), these maps show Western Hudson Bay and Southern Hudson Bay (along with the Southern Beaufort) as “likely declined.” A new category has been added for the Barents Sea: it’s considered “data deficient/uncertain,” but a population estimate of 2,001-3,000 has been provided.

No press release or other notice regarding the availability of these new maps was issued, as far as I know: I came across them by accident while looking for something else.

Global pb status and population map EC 2018

Global map above, more below, including a comparative map that shows 2010, 2014, and 2018 together. I will update the two recent posts of mine (here and here) that used the February Range State map with the information that more recently revised maps are now available.

Continue reading

Lingering late season sea ice brings polar bear visitor to northern Newfoundland

Polar bear season for St. Lunaire-Griquet Newfoundland ran from 6 March to 10 June this year — three long months when polar bears came to visit the community during the season when bears are usually occupied with feeding on young seals and mating.

Newfoundland polar bear 10 June 2018_Iceberg Festival Committee_Thresa Burden photo

Below is a map of the region: St. Lunaire-Griquet is at the tip of the Northern Peninsula of Newfoundland, just north of St. Anthony (where some of the action in my polar bear attack thriller, EATEN, takes place):

Saint Lunaire Griquet Newfoundland location_Google maps

As of yesterday (June 10), when the last sighting of a fat and healthy polar bear took place, there was still quite a mass of thick first year ice (>1.2 m thick) off the northern peninsula of Newfoundland, amongst a field of icebergs:

Hudson Bay North daily stage of development 2018 June 10 ice warning

The first sighting in the area this year was back in early March, which I blogged about here. Fortunately, the Davis Strait bears that occupy the East Coast pack ice are usually well feed at this time of year and seldom pose a serious threat to humans: the fact that visitors ashore are often easily pursuaded to leave (or do so on their own) suggests they are more curious than hungry.

Continue reading

Critical evidence on W Hudson Bay polar bears still not published after 25 years

Polar bear researchers have been doing capture/recapture studies in Western Hudson Bay for decades yet most of the data claimed to be critical for assessing effects of human-caused global warming on this species have not been published. I raised this point in one of my early blog posts (27 Sept 2012) but the situation has not changed in 6 years. Here’s an update.

Derocher in the field in WH_CBC story 2016

From CBC story 14 Sept 2016.

Years ago now, in an oft-cited paper, Stirling and Derocher (2012) claimed to summarize the evidence that climate warming was negatively impacting polar bear health and survival. Several life history parameters were considered crucial, particularly body condition.

Despite almost a dozen papers (and perhaps more) on various aspects of WH polar bear health and life history studies based on capture/recapture data published since 2004  (e.g. Castro de la Guardia 2017; Lunn et al. 2016; Pilfold et al. 2017), none have reported the body condition data that supposedly support the claim that sea ice loss is having a severe impact — and the same is true for litter size, proportion of independent yearlings, and cub survival.1

continue reading

Southern Hudson Bay polar bear region shows slight decline after decades of low sea ice

A newly-published paper by Martyn Obbard and colleagues in the journal Arctic Science claims a 17% decline in abundance of polar bears in the Southern Hudson Bay region after years of reduced sea ice and declining body condition (Obbard et al. 2018). The decline in numbers was not statistically significant but an additional statistical analysis (“Monte Carlo simulation”) not applied to any other estimate in recent years suggested the decline could be real, so a real decline is what was reported to the press.

James Bay polar bear_ministry of Ontario_Walton photo

Only one Canadian Press story has so far been circulated amongst outlets in the media (published hours after the paper appeared online, not at the same time), suggesting there was no press release issued for this study. Odd, that — especially if the decline is as real and significant as the authors suggest.

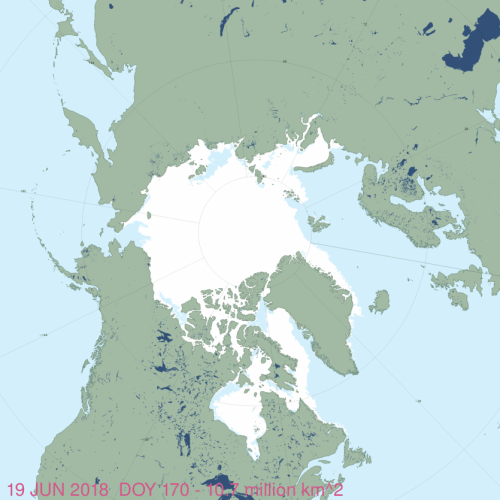
While no evidence was provided for a correlation of this decline in numbers to recent (2012-2016) sea ice decline, previous evidence from the region (Obbard et al. 2016) showed a decline in body condition was correlated only with much later than usual freeze-up, a situation that did not occur from 2012 to 2015 (freeze-up was late in the fall of 2016 but occurred months after the Obbard et al. (2018) survey was completed).

Moreover, the paper reports that a decline in survival of yearling cubs (from 12% of the population in 2011 to 5% in 2016) was not associated with especially poor sea ice conditions in spring. We are likely to see a follow-up paper next year reporting the body condition and sea ice data from this study (as for the previous survey: Obbard et al. 2015, 2016), but there is no suggestion in this paper that body condition declined further from 2011/2012 levels or that sea ice conditions deteriorated markedly enough after 2012 to precipitate a population decline.

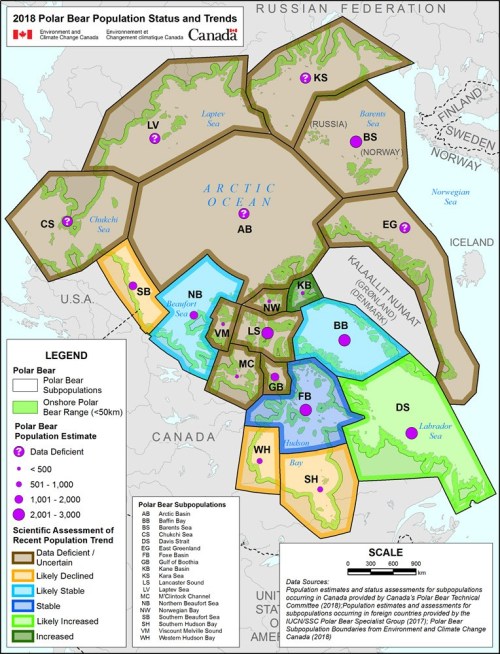
UPDATE 11 June 2018: See below, more recent versions of population and status assessment maps has been issued by Environment Canada that conclude Southern Hudson Bay is “likely declined.”

Continue reading

Harvey et al. paper becomes the poster child of the reproducibility crisis in science

Josh’s ‘stupidest paper ever’ cartoon is a reminder of the depths to which some people will descend to silence the voices of rational scientific debate just as the authors of the 2018 Harvey et al. BioScience paper qualifies it for the honour of poster child of the reproducibility crisis in science.

Poster Child of the reproducibilty crisis in science

By insisting — repeatedly and as recently as this month — that the information they released as supplementary data (find it here) was all that was used to construct the two figures in the paper (see Rajan and Tol 2018), the authors tacitly admit:

1) the data used to construct the figures were not derived from the methods they said they used

2) the work is not replicable

In other words, it is not science. That surely qualifies the Harvey et al. (2018) paper for the honour of poster child of the reproducibility crisis in science, discussed here and here (Baker 2016; Nosek et al. 2015). It’s an example the public will readily grasp, since the data said to have been used are easily accessible (and understood) by anyone who uses the Internet.

Below is the letter outlining the data release issue sent more than a week ago (18 May 2018) by Dr. Richard Tol, University of Sussex, to the president of the university highest academic authority in the Netherlands, where Jeff Harvey, lead author of the Harvey et al. 2018 BioScience paper, is employed as an academic [h/t R. Tol for the correction]. While Koninklijke Nederlandse Akademie van Wetenschappen [KNAW] in Amsterdam has a clearly stated data sharing policy, it is clearly not being upheld for the Harvey et al. paper — which nullifies the point of having a policy at all.

Continue reading