Monthly Archives: May 2017

Polar bear counts for W Hudson Bay: ‘core’ area numbers are not comparable

Polar bear population estimates for Western Hudson Bay have recently become contentious because one specialist has been making statements that confuse the issue. As we all wait for the release of the report on the WHB aerial survey of 2016, it’s worth going over the recent history of these counts and what they have revealed.

Churchill_Polar_Bear_2004-11-15 Wikipedia

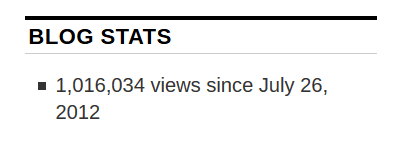
The official count for bears in WHB (used by the IUCN Polar Bear Specialist Group, the IUCN Red List, and Environment Canada) is 1030, based on an aerial survey of the entire region conducted in 2011 (Stapleton et al. 2014).

Since last year, Andrew Derocher (University of Alberta) has been telling any media pundit who will listen that WHB polar bears have declined from about 1200 bears in the 1980s to only 800 or so bears today (one example here) — a statement that is clearly not true.  In recent months, however, whether due to complaints from the public or from his colleagues, he’s qualified that statement by saying it’s the number of bears in the “core” area of WHB that has declined.

But is Derocher’s revised statement a clear scientific interpretation of the facts? Have a look at the details below and see if you come to the same decision I have: that it’s not possible to compare WHB ‘core’ area polar bear population estimates over time.

Continue reading

Much more sea ice in NW Hudson Bay this year than 2016 or 2015 at 27 May

In recent years, sea ice loss over Hudson Bay has begun with open water in the NW corner (which is just as likely due to prevailing offshore winds as ice melt) rather than along the east coast but this year that patch of ice is smaller than its been for the last two years. In addition, despite two patches of open water at either end of the Beaufort Sea, most of the coast of Alaska is still covered in thick ice — much more than existed last year, yet masses of polar bears did not die as far as I know (actually, WHB bears came ashore in excellent condition last year).

Sea ice Canada 2017 May 27

Compare to previous years:

Continue reading

Just when I wasn’t paying attention: 1 million views surpassed

I knew it was coming up and then forgot to check, but sometime about 2 weeks ago blog views here at PolarBearScience passed the one million mark — more than two months ahead of my 5th anniversary.

Stats at 26 May 2017 total_PolarBearScience

Over 1 million views, four polar bear books (including my first novel, the polar bear attack thriller EATEN), several white-paper type publications (here, here, and here), several magazine articles (one here), two videos (see below), and a scientific paper on polar bear conservation that was peer reviewed before it’s publication at PeerJ Preprints.

Not bad for a five year stint on a blog with a single species focus. Continue reading

Southern Beaufort sea ice melt in May: good news for polar bears or catastrophe?

Last week biologist Andrew Derocher recently implied via twitter that less sea ice in the eastern portion of the Southern Beaufort (SB) this year at mid-May is harmful to polar bears (calling it “a hole in the ice where polar bears used to live“), but both long-term and short-term data don’t support such a glass-half-empty interpretation.

Not only does spring breakup of sea ice in the SB normally begin with such open patches of water (see the video above from last year) — driven by the powerful currents of the Beaufort Gyre, not ice melt (explained in detail here) — it may actually be necessary for the survival of local seals, polar bears and whales in spring and early summer (Citta et al. 2015; Crawford et al. 2015; Harwood et al. 2015; Stirling et al. 1981).

As I’ve pointed out before, the biggest threat to SB bears is thick sea ice in spring and its associated late breakup, a 2-3 year-long phenomenon unique to this region known to have occurred about every 10 years since the early 1960s (well documented in the scientific literature) but which has not (as far as I know) happened since 2004-2006.

In other words, a considerable patch of open water and less concentrated ice in the eastern SB around Cape Bathurst is almost certainly a good thing for this particular subpopulation (see previous post here for an in-depth discussion) because historically, when a polynya of some extent has not formed by April or May it has been devastating for local marine mammals.

The fact that an extensive patch of open water existed at mid-May in this region last year and the year before (2015 and 2016) — with no public hue-and-cry about a great dying of SB bears from Derocher or anyone else — suggests that open water in the eastern SB this year is likely to be beneficial for SB polar bears, or at least benign. Continue reading

Polar bear mating season winds down with lots of sea ice habitat available

Habitat for polar bears is abundant worldwide as the prime feeding season passes its peak and mating season for sexually mature bears winds down.

JR1_1266.tif

Battle among polar bear males for the right to mate, from this 2011 DailyMail story here.

There is much more ice than usual around Svalbard in the Barents Sea and off Newfoundland and southern Labrador, home to ‘Davis Strait’ bears. There have been no media reports of polar bears onshore anywhere (since the third week of April in Newfoundland and late January in Svalbard).

Sea ice map below for 12 May 2017:

Svalbard ice extent 2017 May 12_NIS

Compare the extent and concentration of ice around Svalbard above (at 12 May 2017) to conditions that prevailed on the same date in 2015 (below), considered a “good ice” year for local polar bears (and the year of the last population size count which registered an increase over the 2004 count):

Svalbard ice extent 2015 May 12_NIS

There hasn’t been this much ice in the area at this point in the season for many years, especially to the north of Svalbard, and levels since late April have been above even the long-term average (disregard the huge downward blip, which is clearly a sensor malfunction of some kind):

Svalbard ice extent 2017 May 12 graph_NIS

In fact, ice is pretty solid throughout the Barents Sea and East Greenland at this time:

Barents Sea ice extent 2017 May 12_NIS

Across the Atlantic, the situation is similar, with unseasonably heavy sea ice off eastern North America and the Southern Beaufort Sea.

Continue reading

IUCN PBSG insists the 2015 Barents Sea polar bear count was not an increase

Similar to the spin on the 2013 Baffin Bay/Kane Basin polar bear population survey, the IUCN Polar Bear Specialist Group now insists the latest count of the Barents Sea subpopulation is not evidence of an increase in numbers since 2004, as the leader of the study announced in 2015.

Svalbard polar bear_Aars August 2015-NP058930_press release

This is Part 2 of the big surprises in the latest version of the polar bear status table published by the IUCN Polar Bear Specialist Group (PBSG) on 30 March 2017. See last post here regarding the PBSG population size estimates that no longer concur with the 2015 Red List assessment, including the global total — even though PBSG members wrote the report (Wiig et al. 2015, and its Supplement).

Here I want to focus on the results of subpopulation surveys that were made public after the 2015 Red List assessment was published, particularly the Barents Sea estimate.

While the 2013 Baffin Bay and Kane Basin estimates (SWG 2016) have been added to the new PBSG table, any suggestion that these might indicate population increases are strong discounted. Similarly, contrary to initial reports by the principal investigators of the survey, the PBSG insist that the Barents Sea population has not actually increased since 2004, which you may or many not find convincing.

Continue reading

IUCN Specialist Group now rejects polar bear numbers it used for 2015 IUCN Red List review

Is there a mutiny in the works between the IUCN Red List and the IUCN Polar Bear Specialist Group (PBSG) over polar bear population estimates or has there simply been a breach of ethics? What else explains the fact that some of the subpopulation estimates used by the PBSG to support the status of ‘vulnerable’ for the IUCN Red List in 2015 are unacceptable to them in 2017? And why are the PBSG refusing to embrace the Red List global estimate of 22,000-31,000?

2015 IUCN Red List estimates vs IUCN PBSG 2017

The latest version of the IUCN PBSG status table was posted online 30 March 2017 without fanfare or even a note on their home page. It seems the result came from much discussion at their official meeting last summer (June 2016) that they say continued into early March 2017.

2017 population status update early March headline

PBGS members voted to reject four subpopulation estimates used in the 2015 Red List polar bear status review  — even though the inclusion of those numbers was required in order for the Red List status of ‘vulnerable’ to be upheld. The group has also chosen not to update their global population page with the Red List estimate of 22,000-31,000.

And surprise, surprise — now that only one subpopulation out of nineteen worldwide has shown a recent decline, the PBSG have removed the “trend” columns from their summary table for subpopulations.

Welcome to conservation ‘science’ practiced by IUCN polar bear specialists.
Continue reading