Monthly Archives: January 2013

New study says Western Hudson Bay polar bears could spend 2 to 4 months longer on shore than they do now

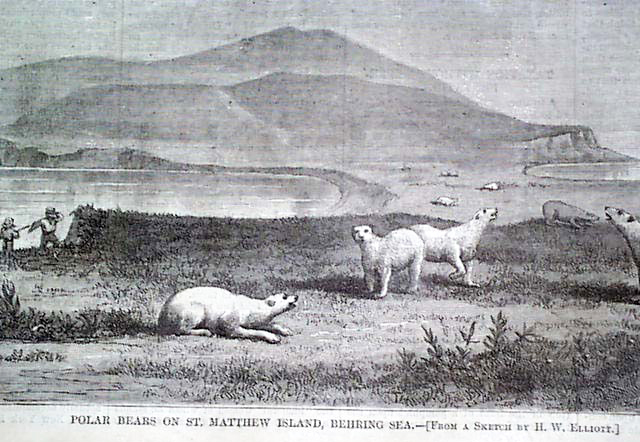
This a follow-up to my post from last week [“Extirpated polar bears of St. Matthew Island spent five months on land during the summer”]. UPDATED July 24, 2013 [see below]

A new study just published (Robbins et al. 2012, abstract below) suggests that non-pregnant polar bears that lived in Western Hudson Bay during the 1980s and 1990s had enough fat to spend at least 6-8 months on land, making the five months that St. Matthew Island bears spent fasting on shore a less than impressive feat.

Using data on polar bears that fasted around Western Hudson Bay (WHB) in the 1980s and 1990s, Charles Robbins and his colleagues created a model that predicted how long polar bears should be able to fast, given a measured amount of fat.

They concluded from their model results (pg. 1501) that polar bears sampled in Western Hudson Bay in the 80s and 90s had enough fat reserves to survive a fast that varied by sex, as follows:

Pregnant females: 7.7-12.3 months (mean 10.0) [vs. ~8 actual, including den time]
Lactating females with yearling cubs: 2.3-6.1 months (mean 4.2) [vs. ~4 actual]
Males: 5.4-10.6 months (mean 8.0) [vs. ~4 actual]

Note that a pregnant female could not really spend 12 months on shore fasting because she wouldn’t have any time to put on fat for the next year. The point is, however, that an eight month fast was leaving most pregnant WHB females with a good amount of fat left – they weren’t using up all they had (see photo in Featured Quote #7 here).

Lactating females had the lowest reserves of all but many had enough fat reserves to have lasted them through a 5-6 month fast (as the bears on St. Matthew were doing – females with yearling cubs as well as males were present).

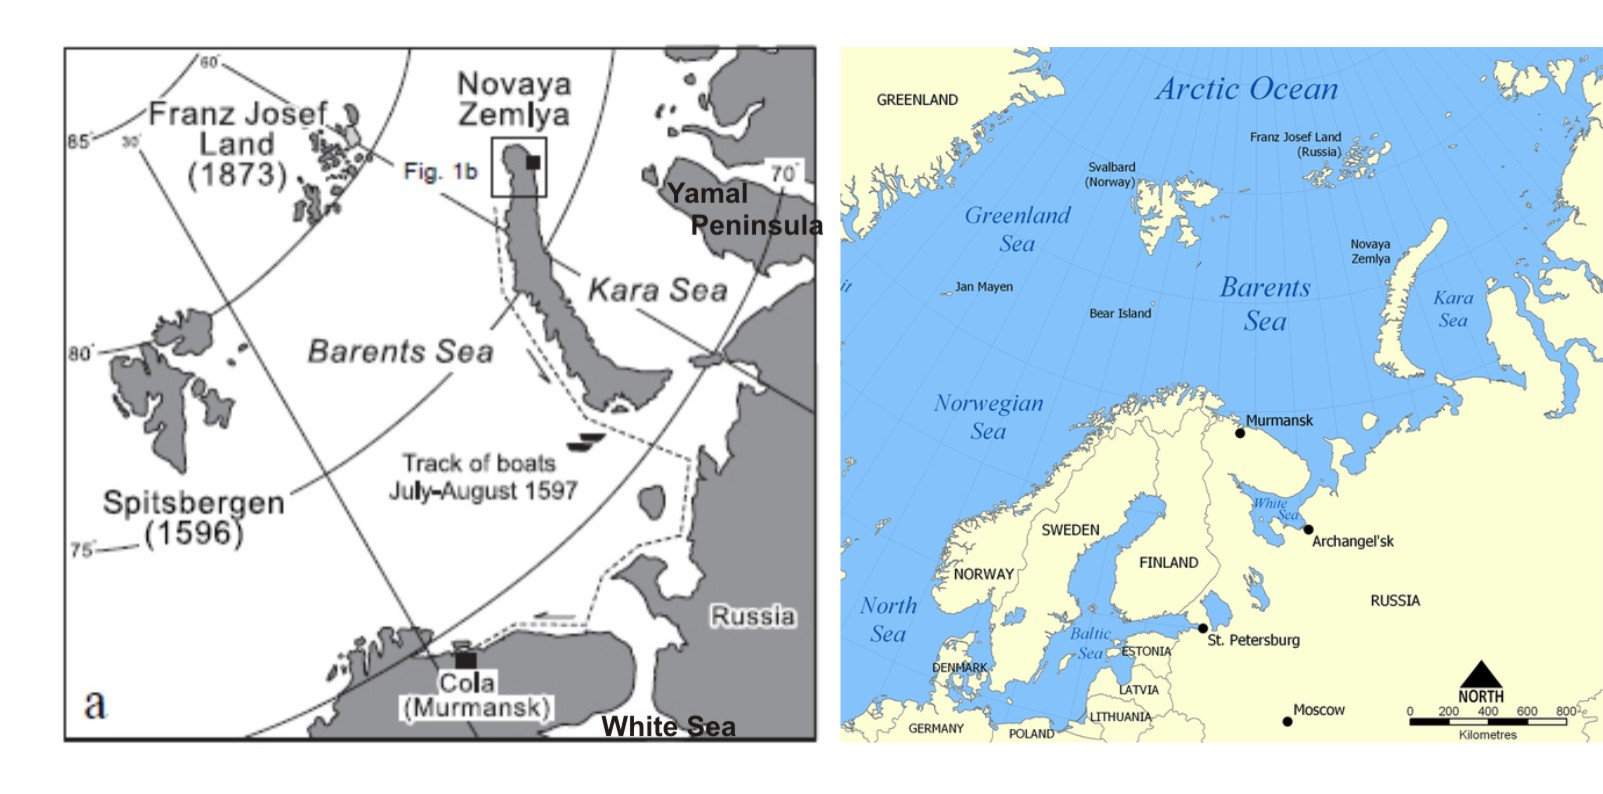
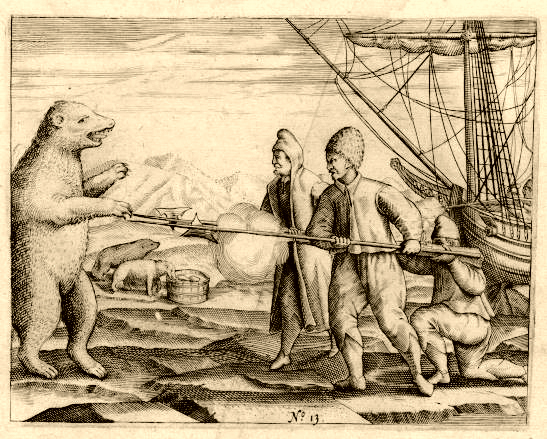
This brings to mind one of the stories from my previous post on William Barents’ crew on Novaya Zemyla – that on Feb. 12, 1597, they killed a bear that gave them “at least one hundred pounds of fat.” That’s a lot of fat left on a bear that couldn’t have been eating very much over the previous 3-4 months (the depth of winter at that latitude).

In other words, both this study and the experience of Barents’ men more than 400 years ago suggests that most polar bears have an incredible ability to store fat and that this allows them to fast far longer than is usually assumed possible. Most is not all, however, and of course it is those individuals whose fat storage ability falls short that we hear about.

The authors of this new study, predictably (see abstract below), emphasized that some pregnant and lactating females were at the lower limit of survival (i.e. in the ranges given above, those pregnant females with only enough fat to endure a 7.7 month fast or a lactating female with the reserves to last only 2.3 months, when currently they would routinely spend 8 months and 4 months fasting, respectively, see previous post here).

However, this is hardly surprising. It is to be expected that some females, in any year and in any population, will be less-than-the-best hunters or turn out to have a fat-storage physiology that is not quite adequate. This is called individual variation – an entirely natural feature of any species. And the fact that some animals die because they do not have quite what it takes to survive natural fluctuations in habitat conditions (see previous posts here and here is why population fluctuations in wild animals are quite natural.

For polar bears, longer-than-average summer/fall fasts during longer-than-average ice-free periods mean that individual bears who are less-than-the-best hunters or who don’t have adequate fat storage physiology will die, fail to get pregnant or fail to raise their cubs. The animals that do survive and reproduce successfully, however, will be able to handle subsequent longer-than-average-summers with relative ease.

Longer-than-average ice-free periods also mean that for a short time, the population size will decline. But within a few years or so, the surviving animals – those who can reproduce as successfully as ever – will build the population numbers back up. Just as the bears of Western Hudson Bay appear to have done (see previous post here and Featured Quote #27 here).

This new study by Robbins and colleagues suggests that if the model results have real-world validity, most of the polar bears in Western Hudson Bay (including pregnant and lactating females) could survive an ice-free season that is 6 months long and that they could handle a 5 month fast with relative ease. However, a 5 month ice-free period is something we haven’t seen yet in Western Hudson Bay, despite the hue-and-cry we hear from some biologists (see previous posts here and here).

UPDATE July 24, 2013

I’ve added this because it seems to me that a few people may not have fully understood the above summary, so I’ve added a bit more detail from the study and my interpretation of it.

In this study (based on models, remember), the mean predicted survival time for all bears was 4.2 months.

As a result, the model results generated by these authors suggested that many (but not all) bears had enough fat reserves to last them through the current 4 month fast but some had enough to endure a 5-6 month fast.

For males in particular, their model results suggested that all males not only had enough fat reserves to survive a 4 month fast (as they currently do) but could have survived a fast of more than 5 months.

While the emphasis on this paper is the ‘catastrophe’ that not all bears would survive a 6 month fast, I should point out that this is their “worst case” scenario – an event that has not even come close to being realized.

While it is true that a few times over the last 40 years, Western Hudson Bay bears have had to endure a fast of 4 months plus three weeks, this length of fasting period has never occurred for more than one year at a time (Stirling et al. 2004; Cherry et al. 2013, see post here. In other words, polar bears have not even begun to approach a sustained 5 month long fasting period.

The authors of this study emphasize only that some pregnant and lactating females would not survive if the length of time onshore during the ice-free period in summer extended to 5 months (from the usual 4 months) and, should that time extend to 6 months, some males would not survive. They stated:

“…some pregnant or lactating females with lower levels of body fat content were already approaching or beyond the constraint of being able to produce cubs and survive the required 8 months of fasting if producing new offspring or 4 months if accompanied by older offspring

“…we estimate that as many as 16% of the adult males would die if fasting lasted for 5.4 months”. [my bold]

They suggest this is in general agreement with a prediction by Molnar et al. (2010) that 28% of adult male bears would die if global warming leads to a 6-month fast.

All of this fails to acknowledge that their results actually predict that most animals (72% of males) would survive the worst conditions they imagined (a 6 month fast), while if a 5-month-plus-2-week fast came to pass, most males (84%) would likely have enough fat reserves to survive. They imply  this would be a catastrophe – I call it remarkable survivability.

They do not provide similar quantification for their prediction of mortality among pregnant or lactating females (only adult male numbers were given). They nevertheless say that “pregnant or lactating females and particularly their dependent offspring have the most tenuous future as global warming occurs.”

What they mean is, some percentage (more or less than 84%) of pregnant or lactating females and their dependent young might not survive a 5 month fast and some percentage (more or less than 72%) might not survive a 6 month fast. Again, I wouldn’t call this a catastrophe – I say this is an example of remarkable resilience.

References
Cherry, S.G., Derocher, A.E., Thiemann, G.W., Lunn, N.J. 2013. Migration phenology and seasonal fidelity of an Arctic marine predator in relation to sea ice dynamics. Journal of Animal Ecology 82:912-921. [added July 24 2013]

Robbins, C.T., Lopez-Alfaro, C., Rode, K.D., Tøien, Ø., and Nelson, O.L. 2012. Hibernation and seasonal fasting in bears: the energetic costs and consequences for polar bears. Journal of Mammalogy 93(6):1493-1503. http://www.asmjournals.org/doi/abs/10.1644/11-MAMM-A-406.1

Stirling, I., Lunn, N.J., Iacozza, J., Elliott, C., and Obbard, M. 2004. Polar bear distribution and abundance on the southwestern Hudson Bay coast during open water season, in relation to population trends and annual ice patterns. Arctic 57:15-26. http://arctic.synergiesprairies.ca/arctic/index.php/arctic/article/view/479/509 . [added July 24 2013]

Abstract
Global warming has the potential to reduce arctic sea ice and thereby increase the length of summer–fall fasting when polar bears (Ursus maritimus) lose access to most marine mammals. To evaluate the consequences of such changes, we compared the cost of fasting by polar bears with hibernation by brown bears (U. arctos), American black bears (U. americanus), and polar bears and made projections about tissue reserves polar bears will need to survive and reproduce as fasts become longer. Hibernating polar bears expend energy at the same rate per unit mass as do brown bears and black bears. However, daily mass losses, energy expenditures, and the losses of lean mass are much higher in fasting, active polar bears than in hibernating bears. The average pregnant polar bear living around Hudson Bay during the 1980s and 1990s could fast for 10.0 ± 2.3 months (X̄ ± SD), and the average lactating female with cubs born during the preceding winter could fast for 4.2 ± 1.9 months. Thus, some pregnant or lactating females with lower levels of body fat content were already approaching or beyond the constraint of being able to produce cubs and survive the required 8 months of fasting if producing new offspring or 4 months if accompanied by older offspring. Pregnant or lactating females and their dependent offspring have the most tenuous future as global warming occurs. Thus, we predict a significant reduction in productivity with even modest increases in global warming for polar bears living in the very southern part of their range and are concerned about more northern populations depending on their ability to accumulate increasing amounts of fat.
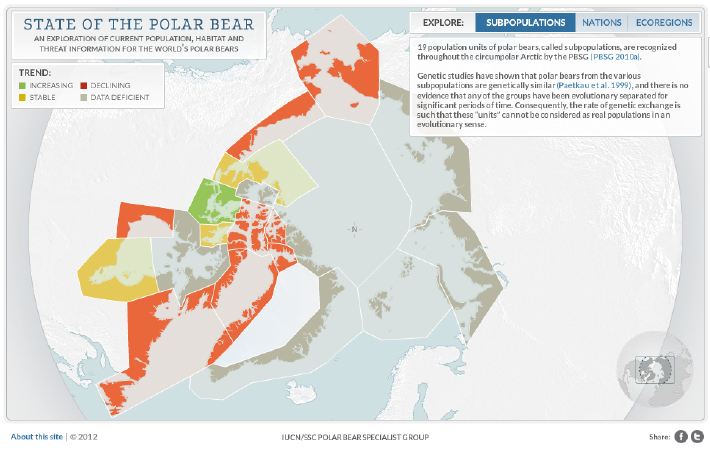
Canada under international pressure to list polar bears as threatened, so far holds out

[Updated Jan. 27, 2013 at 7:55 am PST Footnote added]

I was inspired to write this post after perusing the Q & A portion of the “What scientists say” section at Polar Bears International. One of the questions is this one:

Are Canadian scientists opposed to listing the polar bear as threatened, as some news organizations have reported?

While I don’t know when it was posted, this question appeared quite timely when I came across it, given the recent news (Nov. 30 2012) that “Canada is being forced to explain its policies to an international environmental watchdog” (Maclean’s magazine; see also the Calgary Herald story) because of a petition filed by the ever-litigious Center for Biological Diversity.

This petition, presented to the Commission on Environmental Co-operation by the CBD, followed on the heels of the news that Canada’s “Species at Risk Act” (SARA) will continue to list the polar bear as a species of “special concern” but not threatened or endangered (CBC story here).

The original petition was filed in November 2011 and re-issued in October 2012. It seems Canada now has until January 23, 2013 to respond to the Commission, after which an investigation could be launched.

We should hear their answer any day now – but guess what? Outspoken PBSG polar bear biologist Andrew Derocher looks to have at least inspired this petition, if he was not party to it.

Continue reading

PBSG invited WWF and PBI advocates to its last polar bear experts meeting

In 2009, for the first time, the polar bear biologists that make up the IUCN’s Polar Bear Specialist Group (PBSG) invited four professional advocates – not one or two, but four – to their exclusive, once-every-four-years meeting of top polar bear biologists (called “delegates”) from the world’s Arctic nations (Canada, Russia, USA, Greenland/Denmark and Norway) – two from World Wildlife Fund (WWF) and two from Polar Bears International (PBI).

[Recall that 2009 was also the year that PBSG Chairman Andrew Derocher stripped veteran Canadian polar bear biologist and long-time PBSG member Mitch Taylor of his delegate attendee status because he did not have the appropriate attitude to global warming (see previous post here). Update – just to be clear, Mitch had retired from his government polar bear research job (a valid reason for not being included as a delegate) but with more than 30 years experience and his vast publication record on polar bears – as well as his long association with the PBSG as a delegate – he certainly should have qualified as an “invited specialist” at the 2009 meeting]

I expect Canadian journalist and author Donna LaFramboise would call this inclusion of WWF and PBI advocates in an otherwise exclusive meeting of polar bear biologists a behind-the-scenes lobbying opportunity,” similar to the inclusion of WWF personnel in the IPCC review process (see original article here and email interview here and “WWF infiltrates UK gov’t” here).

WWF and PBI are organizations devoted to changing public policy to suit their idea of how the world should be – whether others agree or not. They are passionate lobbyists with money behind them and they use their influence to pressure politicians – and now, supposedly impartial scientific organizations – to make decisions that fit their agenda.

Continue reading

Extirpated polar bears of St. Matthew Island spent five months on land during the summer

Did you know there used to be resident polar bears on two small islands in the Bering Sea? Given how much we don’t know about the polar bears of the Bering Sea, the bears that used to den and spend their summers on the St. Matthew Islands are a bright spot. These islands lay at the southern-most limit of the modern “Chukchi Sea” subpopulation (see Fig. 1) and were uninhabited by people when they were discovered in the 1760s – but they were a haven for polar bears.

We have details of the polar bears that gave birth and summered there because a US government biologist (Henry Wood Elliott) and a US navy Lieutenant (Washburn Maynard) surveyed the islands in 1874. Elliott wrote both an official report and a popular magazine article (for Harper’s Weekly Journal of Civilization) in 1875 describing the polar bears they saw; Maynard wrote a separate report in 1876. By 1899, there were none left, victims of the relentless slaughter of polar bears everywhere in the Arctic in that era (see previous discussion here).

Figure 1. St. Matthew Island is in the Bering Sea off the west coast of Alaska: north of the Pribilofs and south of St. Lawrence Island, at about 60°N latitude. Compare this to the southern end of James Bay, Canada – which has a stable population of polar bears – at about 53 0N and Churchill, Manitoba – the “polar bear capital of the world” – at 58 046’N. Maps from Wikipedia.

Figure 1. St. Matthew Island is in the Bering Sea off the west coast of Alaska at about 60°N latitude. Compare this to the southern end of James Bay, Canada (which has a stable population of polar bears) at about 53 0N and Churchill, Manitoba (the so-called “polar bear capital of the world) at 58 046’N. Maps from Wikipedia.

Figure 2. A drawing of polar bears on St. Matthew Island that accompanied the May 1, 1875 Harper’s Weekly Journal of Civilization article written by Henry Elliot. See here.

Figure 2. A drawing of polar bears on St. Matthew Island that accompanied the May 1, 1875 Harper’s Weekly Journal of Civilization article written by Henry Elliot. See here.

[UPDATE: Jan. 27, 2013: a follow-up to this post is here.]

Continue reading

Update: Polar bear population now 22,600-32,000 – when tallied by nation

UPDATE FEBRUARY 19, 2014The misleading “State of the Polar Bear” graphic is now GONE (as of January 31, 2014). A new 2013 status table is offered by the PBSG here. It has detailed text explanations and harvest information, with references, hyperlinked to each subpopulation entry (“Press the subpopulation hyperlink and more information will appear“) and may have replaced the “State of the Polar Bear” graphic that the PBSG commissioned for upwards of US$50,000, although the PBSG website says it is being “updated” [A pdf copy of the 2013 colour table is here, and my commentary on it is here.] I have left the original post as is, below.

[See followup posts here and here (April 1)]

Two days ago, I got a short note from PBSG chairman and website manager Dag Vongraven of the Norwegian Polar Institute, Tromso. He was responding to an email I sent him earlier this week asking about the apparent increase in global polar bear numbers when tallied by nation as depicted in the “State of the Polar Bear” dynamic “tool” featured on the Polar Bear Specialist Group (PBSG) website, which I discussed in a previous post here. The tally by nation in that PBSG document suggests that the world population estimate for polar bears is 22,600-32,000 – far higher than the 20,000-25,000 “official” estimate.

Apparently, this tool was developed by a US-based web company under Vongraven’s supervision. But, he says, he has “not yet had time to review all details in it as well as I should.So, without a careful final review, the document was posted on the front page of the PBSG website, where it has been featured for several months.

The “tool” consists of three maps – that’s it. They are titled Subpopulations, Nations, and Ecoregions. I previously discussed the population totals by Nation, but when I went back and looked at the Subpopulation numbers, I realized they are very odd as well.

The total population estimate listed on the Subpopulation map add up to just 13,036 – not even close to the 20,000-25,000 “official” estimate. The map (see screen cap below) gives no number (estimate = 0) for the following subpopulations, all of which have an official estimate (see previous post here, estimates from the 2009 PBSG report in square brackets): Foxe Basin [2,197], Viscount Melville [161], Laptev Sea [800-12,00] and Barents Sea [2,650]. On the map below, all of the regions coloured grey have no estimate provided (estimate = 0). In addition, there is no estimate provided for the Chukchi Sea subpopulation, coloured orange in this map, as per the official estimate [you can’t see the numbers given in this screen cap because they only show up when you hover your mouse over the region].

So when you add up the individual estimates provided on each of the two maps on this web tool, you get two different numbers that have no resemblance to the “official” estimate of 20,000-25,000.

"Subpopulation" status, from the Polar Bear Specialist Group special tool, "The State of the Polar Bear." downloaded January 17, 2013

“Subpopulation” status map, from the Polar Bear Specialist Group dynamic web tool, “The State of the Polar Bear.” [downloaded January 17, 2013]. Population estimates for each region show up on the original web-based tool when you hover your mouse over the map. All of the regions coloured grey, as well as one of the orange-coloured regions (Chukchi Sea, centre top), do not have a number provided.

 Vongraven says he is recovering from surgery and so it may be awhile until someone takes a look to see what’s up with this tool. He did not seem overly concerned about it. But he assured me that the official polar bear estimate of 20,000-25,000 has not changed, although it may after the next population review at the PBSG meeting later this year.

The point is this: if you were a high school student or a teacher looking for a simple and authoritative summary on the status of the polar bear, this tool would look very attractive. The IUCN/SSC Polar Bear Specialist Group want us to consider them the ‘premiere’ experts on polar bear numbers worldwide but these maps do not accurately summarize the current state of knowledge about global polar bear population numbers. The maps are misleading and confusing. We may never know who’s bright idea this was but I in my opinion, it’s a dud.

[the “State of the Polar Bear” tool was still up on the PBSG website, in its original state, the last time I looked]

Polar bears in winter: insights from modern research and Inuit hunters

In a previous post (“Polar bears in winter: insights from Behouden Huys, 1596-1597”) I discussed the chronicle of Gerrit De Veer, who documented polar bear activity during the winter that William Barents’ crew spent on northern Novaya Zemlya more than 400 years ago. De Veer noted that the crew did not see or hear polar bears during the time that the sun was below the horizon, a period that did not correlate with the period of most intense storms and cold (De Veer 1609). However, the bears were active (and often causing trouble!) before and after that time.

De Veer’s account suggests the possibility that polar bears spend the darkest part of the winter curled up in a sheltered spot regardless of whether this is the coldest or stormiest period or not.

However, the experience of Barents and his men occurred over a single season and may not be representative of polar bear winter activity in general. As promised, in this post I’ll discuss the evidence collected by polar bear biologists and Inuit hunters relevant to the question of what polar bears do during the cold and dark of an Arctic winter.

 Figure 1. Effective advertising and amusing though it may be, one thing about this image is actually true – during the winter, while the sun does not rise above the horizon, the moon is visible on its usual cycle. Moonlight and northern lights (aurora borealis) are the only sources of natural light except for a few hours of dusk at mid-day. See other images here, here and here.


Figure 1. Effective advertising and amusing though it may be, this image also depicts a true Arctic phenomenon – during the winter above the Arctic Circle, when the sun does not rise above the horizon, the moon is visible on its usual cycle. Moonlight and northern lights (aurora borealis) – plus a few hours of dusk at mid-day – provide relief from total darkness. See other images of an Arctic moon and northern lights here, here and here.

Continue reading

Hudson Bay sea ice and trapped killer whales

Last night, I was alerted by a reader (h/t MM) to an NBC news report with this headline: “Killer whales’ plight in ice an example of climate change impact, researcher says.” Here’s part of what it says:

The plight of a pod of killer whales that got trapped by ice in a mostly frozen Canadian bay this week was a “good example of what climate change can do” in the Arctic, a researcher said Friday.

The 11 killer whales apparently escaped the ice in Hudson Bay late Wednesday or early Thursday morning, when shifting currents helped break open a path to the sea, according to Petah Inukpuk, mayor of Inukjuak, a remote Inuit village in Quebec where locals had crafted a plan to help the animals, also known as orcas. Other reports said there were 12 orcas in the pod.

The killer whales were hundreds of miles from where they should be at this time of year, such as in the Hudson Strait or the North Atlantic, said Lyne Morissette, a mariner researcher with the Quebec-based St. Lawrence Global Observatory.

The bay, which normally freezes over in late November or early December only froze over earlier this week. 

“It’s definitely a direct effect, a good example of what climate change can do,” she told NBC News on Friday of the orcas’ plight. “All the dynamics of how the ice is going to move and where the ice is going to be — it’s not only about ice melting in the Arctic, you know — it’s the whole dynamics and currents that could change because of climate changes. [my bold]

I take issue, first, with this statement from Morissette (SLGO):
The bay, which normally freezes over in late November or early December only froze over earlier this week.”

Not true, according to the Canadian Ice Service. Continue reading

The 32,000 population estimate for polar bears is not an error due to counting overlapping territories twice

UPDATE FEBRUARY 19, 2014The misleading “State of the Polar Bear” graphic is now GONE (as of January 31, 2014). A new 2013 status table is offered by the PBSG here. It has detailed text explanations and harvest information, with references, hyperlinked to each subpopulation entry (“Press the subpopulation hyperlink and more information will appear“) and may have replaced the “State of the Polar Bear” graphic that the PBSG commissioned for upwards of US$50,000, although the PBSG website says it is being “updated” [A pdf copy of the 2013 colour table is here, and my commentary on it is here.] I have left the original post as is, below.

[UPDATE April 1, 2013: see updates here and here ]

This is a brief follow-up to my last post.

I got an email from a reader suggesting that the high numbers for the world’s polar bear population, as given by the Polar Bear Specialist Group (PBSG) on their website in their State of the Polar Bear (SoPB) summary feature – as tallied by nation (22,600-32,000) – may simply be an error resulting from counting overlapping territories twice (i.e. where a subpopulation with one population estimate is shared by two nations, the total amount has been attributed to each nation, rather than giving each of them half of the total).

That is not the case and I’ll tell you why.

If you haven’t yet seen the last post, pop back and have a look – it’s short.

Then note the following:
1) Re: the numbers given for Russia (given as 2,700-4,800 in SoPB-by-nation). Russia has three subpopulations of polar bears: Chukchi (shared with the USA), Kara Sea and Laptev Sea. See previous post here on these estimates by the PBSG.

Chukchi officially has a population of zero because it has never been surveyed. The same is true for the Kara Sea: its population is officially zero and always has been. The Laptev Sea is given a tentative estimate of 800-1,200 in most subpopulation estimates but on the “State of the Polar Bear” summary, it is given as zero. Thus, at the very most, the total for Russia could be 800-1,200.

Conclusion: the estimate of 2,700-4,800 for the Chukchi Sea is not a result of an overlap in count. It’s a new number and there is no information given about where it comes from (it’s remotely possible that the SoPB-by-nation number comes from a recent survey of the Chukchi Sea, see previous post here, but that number has not been made public and the study results have not yet been published).

2) Re: numbers for the USA (given as 1,200-1,800 in SoPB-by-nation). The US has two subpopulations: Southern Beaufort (which it shares with Canada) and the Chukchi Sea (which it shares with Russia). The number usually given for the Southern Beaufort is 1,200-1,800 – so the US share is something like 600-900. While the US shares the Chukchi population with Russia, the Chukchi has never been surveyed – its population is officially zero (half of zero is still zero).

Conclusion: if there has been any “doubling up” going on, it is here. The official (documented) number for the US should be about 600-900.

3) Re: numbers for Greenland (given as 3,500-4,400 in SoPB-by-nation). East Greenland has never been surveyed and the official estimate for that subpopulation is zero. West Greenland comprises three polar bear subpopulations that it shares with Canada: Baffin Bay (total count 1,544-2,604), Davis Strait (total count 1,811-2,534) and Kane Basin (total count 94-234). That comes to 3,449-5,372. Conclusion: if there had been a “doubling” of shared population numbers, the number for Greenland should have been listed in the SoPB-by-nation map as 3,449-5,372 (not 3,500-4,400).

The estimate for the world’s polar bear population, as given by the Polar Bear Specialist Group (PBSG) on their website in their State of the Polar Bear summary feature – as tallied by nation (22,600-32,000) – is not simply an error resulting from counting overlapping territories twice.

Polar bear population now 22,600-32,000 – when tallied by nation

UPDATE FEBRUARY 19, 2014The misleading “State of the Polar Bear” graphic is now GONE (as of January 31, 2014). A new 2013 status table is offered by the PBSG here. It has detailed text explanations and harvest information, with references, hyperlinked to each subpopulation entry (“Press the subpopulation hyperlink and more information will appear“) and may have replaced the “State of the Polar Bear” graphic that the PBSG commissioned for upwards of US$50,000, although the PBSG website says it is being “updated” [A pdf copy of the 2013 colour table is here, and my commentary on it is here.] I have left the original post as is, below.

This afternoon I came across some startling information. [updated here, here from Feb. 10, 2013, and here from April 1, 2013]

According to a dynamic summary report on the home page of the IUCN/SSC Polar Bear Specialist Group website  called State of the Polar Bear, there are now 22,600-32,000 polar bears worldwide, when tallied by nation.

Here are the numbers, by nation, listed in the State of the Polar Bear summary report (see map below):
Canada                              13,300-17,500
USA                                   1,200-1,800
Russia                               2,700-4,800
Norway                             1,900-3,600
Greenland
(Denmark)                        3,5000-4,400
Total                            22,600-32,000

The “Nations” page of the Polar Bear Specialist Group’s “State of the Polar Bear,” a dynamic summary that can be launched from the home page of the IUCN PBSG  http://pbsg.npolar.no/en/dynamic/app/ [published Oct. 15, 2012] Click to enlarge.

The “Nations” page of the Polar Bear Specialist Group’s “State of the Polar Bear,” a dynamic summary that can be launched from the home page of the IUCN PBSG website, http://pbsg.npolar.no/en/ [published Oct. 15, 2012] Click to enlarge.

This is a big change from the 20,000-25,000 that has been touted as the global polar bear population since 2005 (see Aars et al. 2006; Obbard et al. 2010) and my post on polar bear population estimates.
[updated Jan. 9 2013 at 8:20 PST, see end of post]

UPDATE Jan. 7. 2014 – The PBSG has announced that a new population assessment is due later this month, see this January 1 post. The graphic described in this post has moved to the page called “Population information” and the official estimate of 20,000-25,000 is no longer present. There was no press release associated with this announcement.
Continue reading

Polar bears in winter: insights from Behouden Huys, 1596-1597

As a follow-up to my previous post on polar bears giving birth (December is polar bear nativity month) I thought I’d continue the generalized theme of “polar bears in winter.”

polar bear aurora_borealis_3-t2 free

While we don’t really know for sure what non-pregnant polar bears do during the depth of the Arctic winter, we have bits of evidence – some from modern hunters and polar bear researchers but also from Arctic explorers. One explorer in particular comes to mind: William Barents [Willem Barentsz] of Holland, who attempted to reach China via the Arctic Northeast Passage in the late 16th century. On their third voyage (1596-1597), Barents and his crew were forced to spend the winter on the northern tip of Novaya Zemlya (latitude 760N, see Fig. 1) when their ship became trapped in the sea ice. Crew member Gerrit De Veer (1609) kept a journal account of the long, horrifying winter they spent on shore, in a shelter they built with materials salvaged from the ship. They called their winter home Behouden Huys (“the saved house”).

Figure 1. Location of Novaya Zemlya, in the Barents Sea. On the map at left (a), the black square marks the location of Behouden Huys, the over-winter home of William Barents and his crew (1596-97) on Novaya Zemlya (the “track of boats” noted marks the return journey of Barents in the summer of 1597). This is modified from Zeeberg et al. 2002:331. The map on the right is from Wikipedia, for perspective. click to enlarge.

Figure 1. Location of Novaya Zemlya, in the Barents Sea. On the map at left (a), the black square marks the location of Behouden Huys, the over-winter home of William Barents and his crew (1596-97) on Novaya Zemlya (the “track of boats” noted marks the return journey of Barents in the summer of 1597). This is modified from Zeeberg et al. (2002:331). The map on the right is from Wikipedia, for perspective. click to enlarge.

An English translation of De Veer’s journal is now available online and it offers a fascinating glimpse of what it meant to live through that long dark winter under almost-constant fear of attack by polar bears. The Dutchmen were plagued by polar bears almost the entire time they were on Novaya Zemlya (see Fig. 2). De Veer’s notes on these encounters provide a unique perspective on polar bear activities over the Arctic winter – ironically, it is not the havoc the bears caused that provides the most important clue but rather, the timing of when they left Barents and his crew alone.

Figure 2. An engraving from De Veer’s journal conveys the struggle the crew faced in warding off polar bears during their winter stay at Novaya Zemlya. The bears not only stalked and attacked the crew - they got into the food stores on the ship (From Wikipedia).

Figure 2. An engraving from De Veer’s journal conveys the struggle the crew faced in warding off polar bears during their winter stay at Novaya Zemlya. The bears not only stalked and attacked the crew, they got into the food stores on the ship.
(From Wikipedia).

Continue reading