
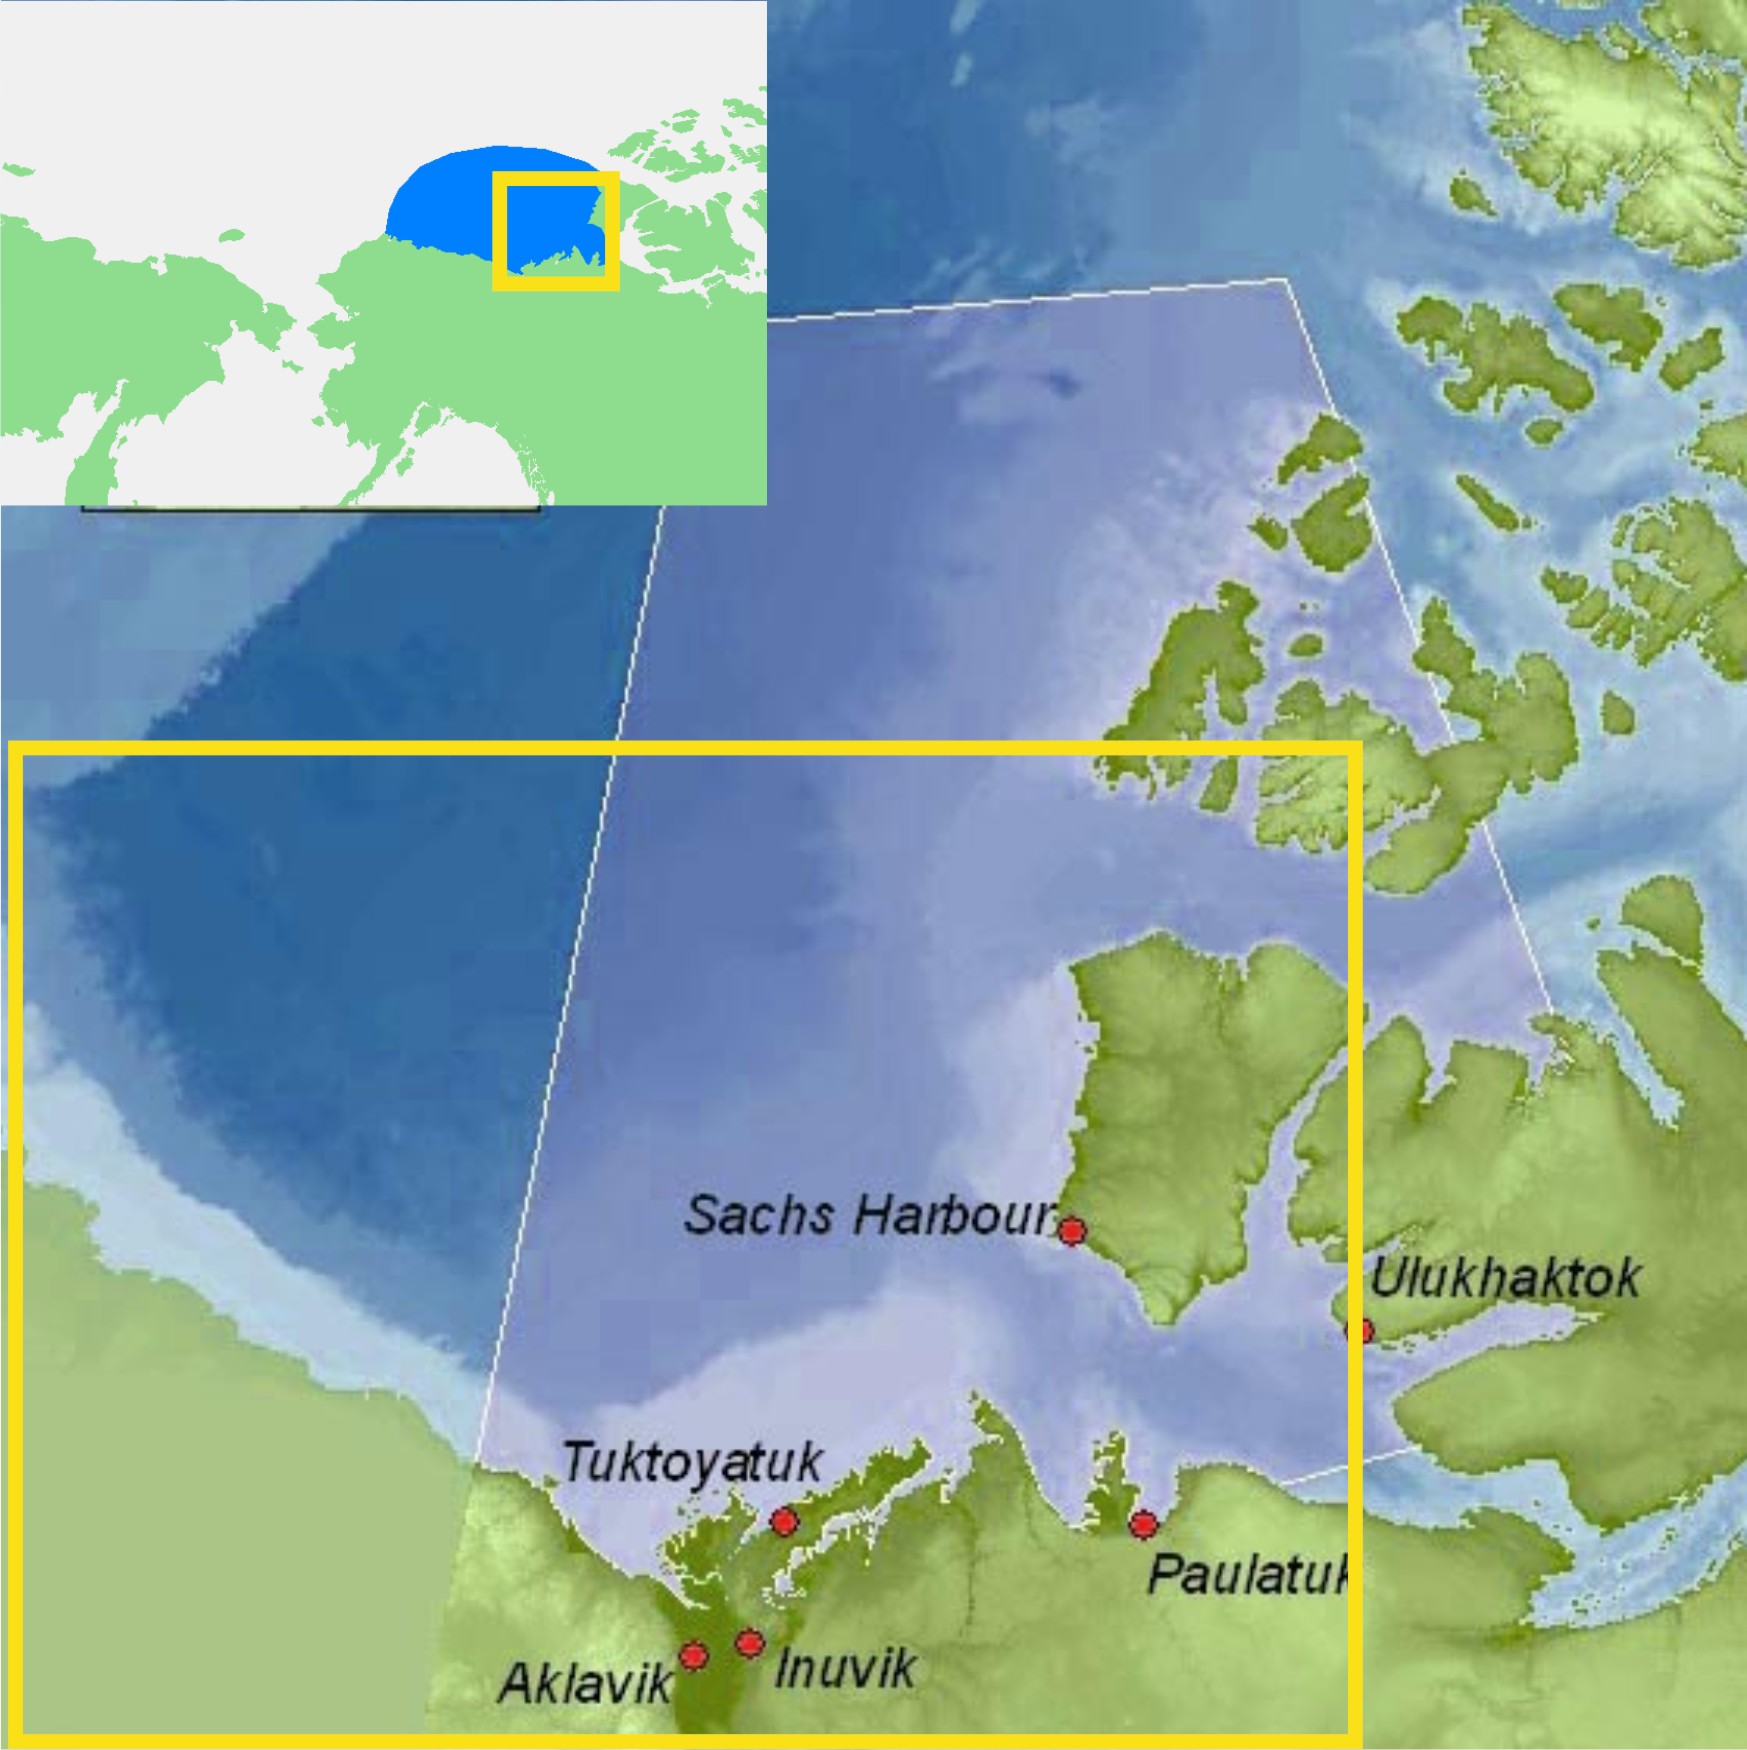
The sea ice chart provided by the Canadian Ice Service (Fig. 1 below) shows a lot of ice still present in Hudson Bay today, the last day of June, 2013.

Figure 1. Sea ice extent in Canada, June 30, 2013. From the Canadian Ice Service.
This means we have long passed the point when breakup of the sea ice in Western Hudson Bay (30% ice concentration) could be considered ‘early.’ See Table 1 below for previous breakup dates (1991-2009) and previous post here for more details.
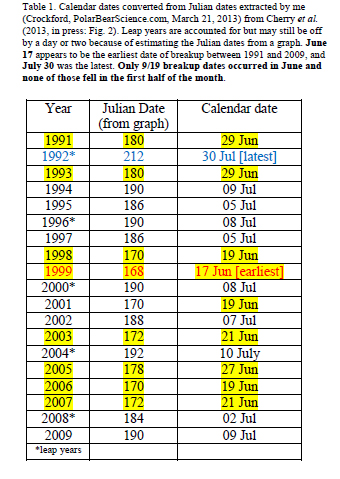
Table 1. Breakup dates calculated for Western Hudson Bay, 1991-2009, using the new method described by Cherry et al. (2013, in press). More details in previous post here.
Since most polar bears don’t leave the ice until almost a month after the official breakup date is declared, it means that even if breakup for Western Hudson Bay occurs within the next few days, most polar bears would not start their summer fast until the beginning of August.
Regardless of when polar bear biologists decide that breakup has occurred, one thing is now clear — this will not be an early breakup year for Western Hudson Bay. That’s good news for polar bears.
And what about the rest of the Arctic? You’ll see from Fig. 2 below that as of yesterday (June 29), there was still ice present in each of the 19 polar bear subpopulation regions — more good news for polar bears.
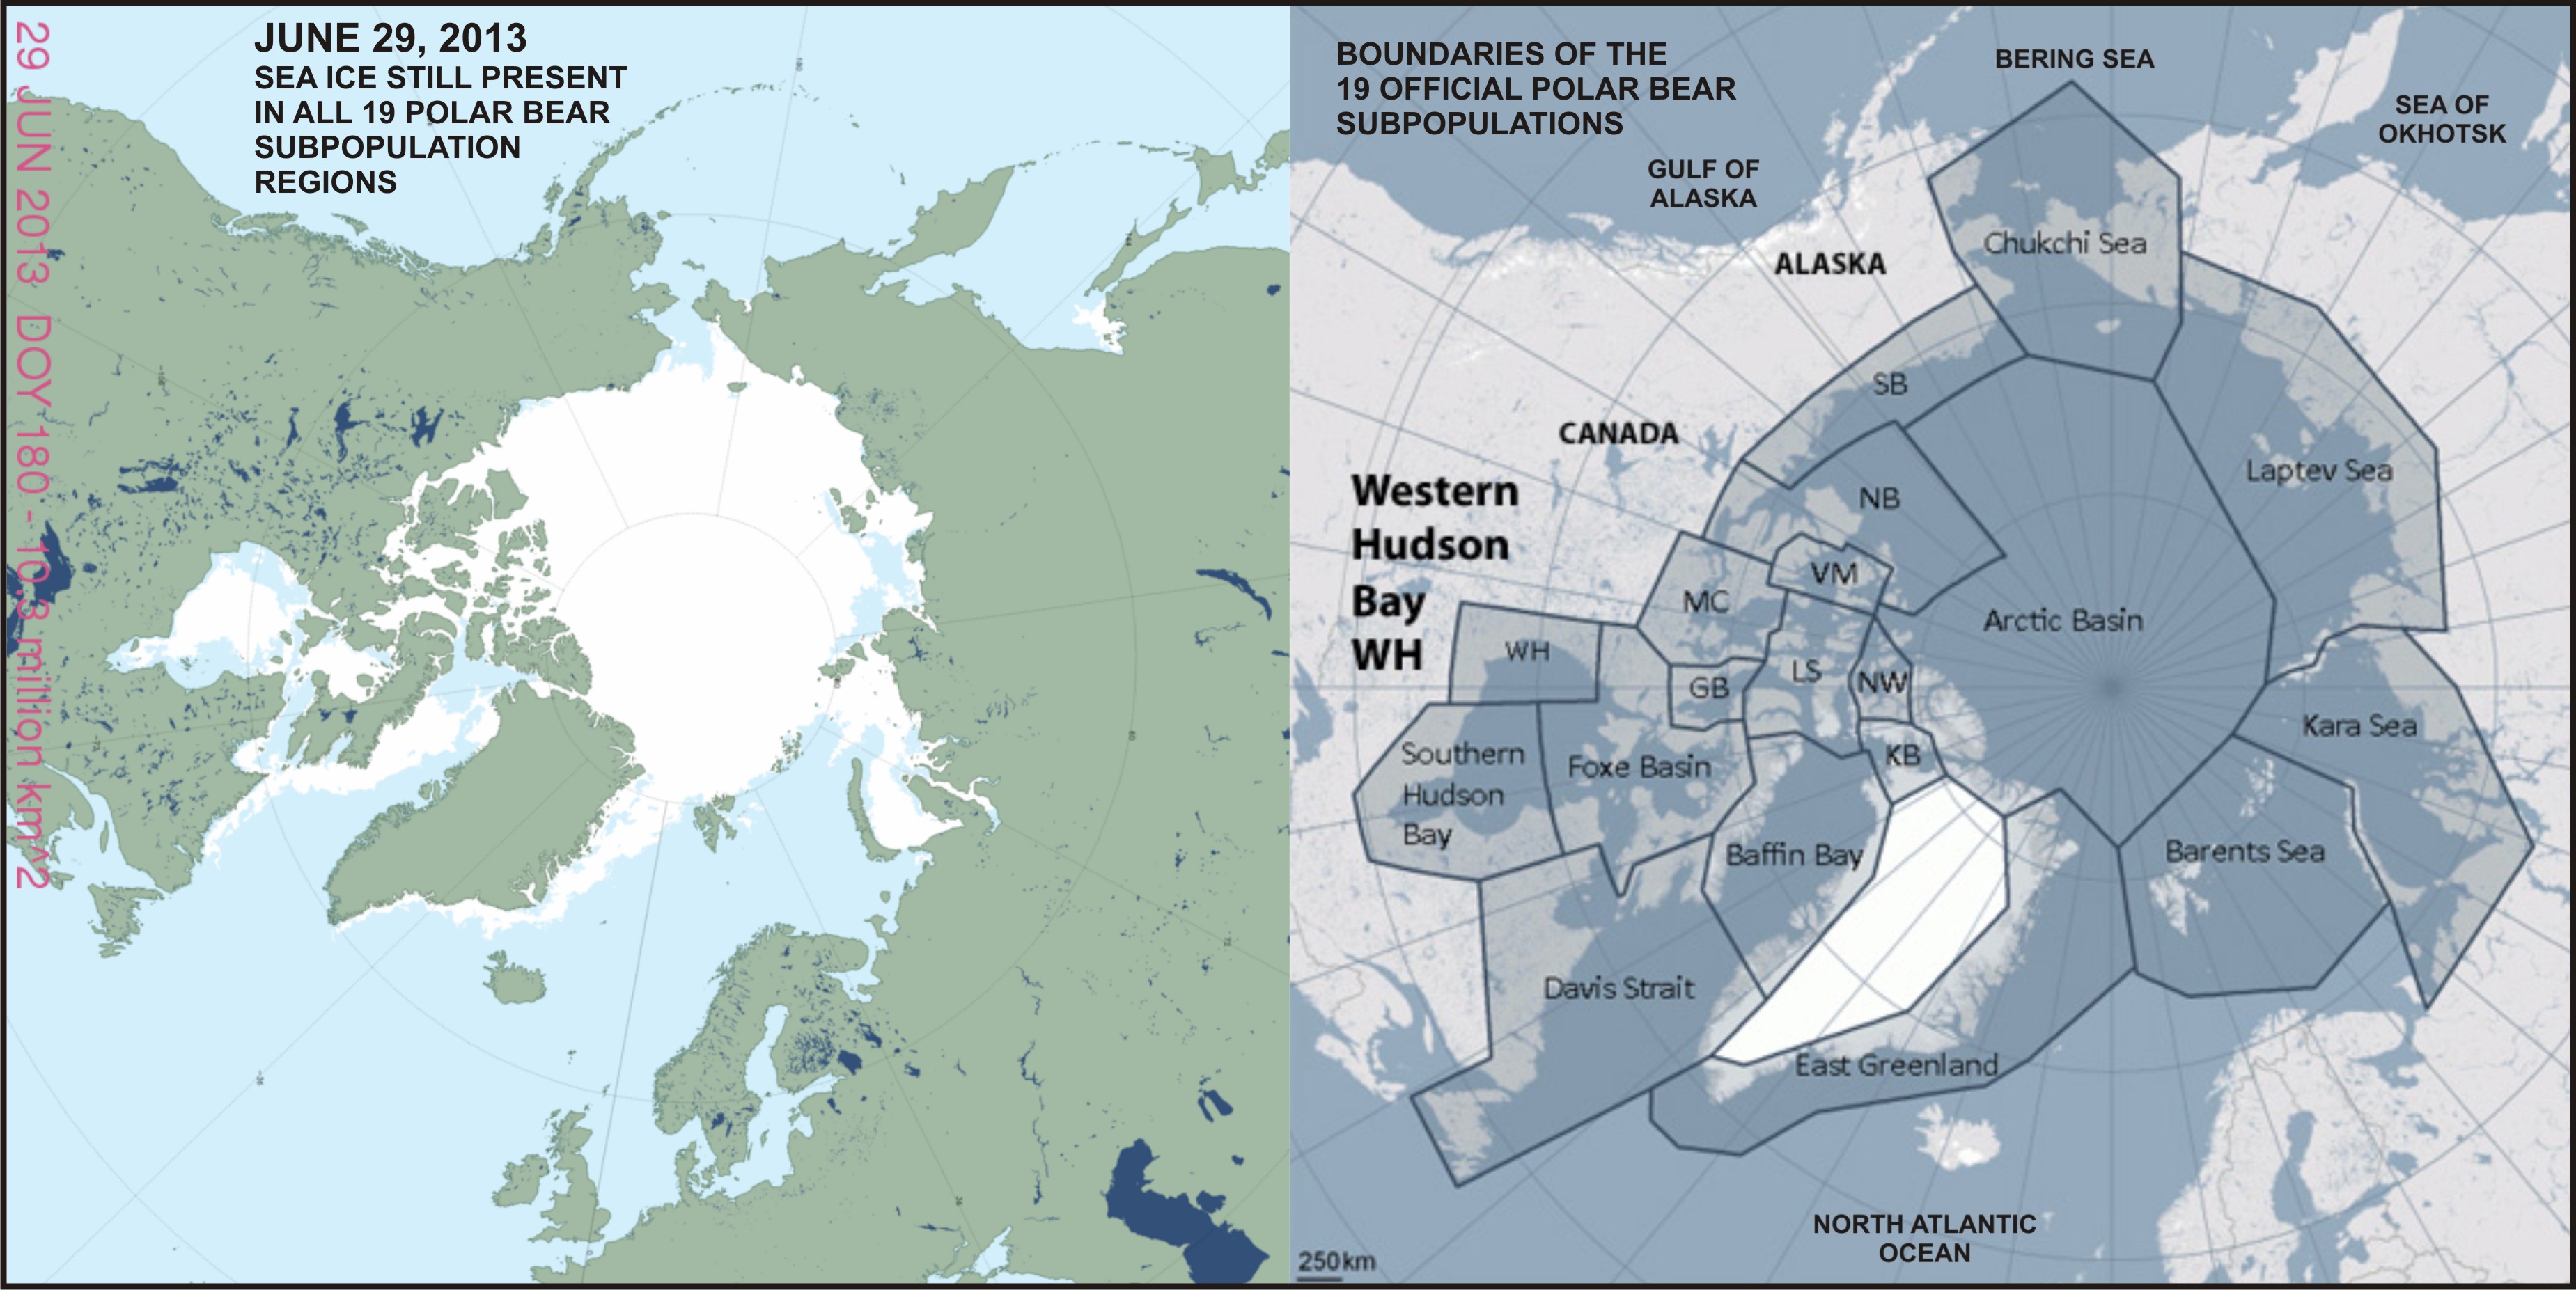
Figure 2. Sea ice extent worldwide vs. polar bear subpopulations at June 29, 2013. On this date, there was still sea ice present in every one of the 19 subpopulation regions. Map on the left from US National Snow and Ice Data Center (NSIDC “MASIE”) here; map on the right from the Polar Bear Specialist Group, with labels added. Click to enlarge
References
Cherry, S.G., Derocher, A.E., Thiemann, G.W., Lunn, N.J. 2013. Migration phenology and seasonal fidelity of an Arctic marine predator in relation to sea ice dynamics. Journal of Animal Ecology 82(4):912-921.
http://onlinelibrary.wiley.com/doi/10.1111/1365-2656.12050/abstract
![A polar bear near Thule, NW Greenland. Note the decidedly chubby back end on this bear, who looks well prepared for winter. Photo by Robin Davies. [details at my Quote Archive, Featured Quote #6]](https://polarbearscience.com/wp-content/uploads/2012/07/polarbearatthulerobindavies-500x349-sm.jpg)


You must be logged in to post a comment.