Monthly Archives: May 2018

Does thick first year ice on Hudson Bay mean a late date ashore for WH polar bears in 2018?

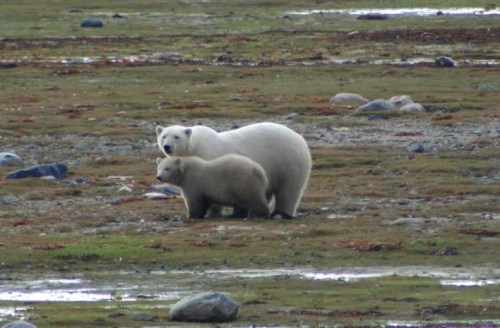
Following up on my previous post, it appears sea ice conditions on Hudson Bay this year might be headed for a late breakup due to the dominance of thick first year ice. That would mean a relatively longer on-ice season for polar bears in Western and Southern Hudson Bay.

James Bay female and cub_Ontaro Govt

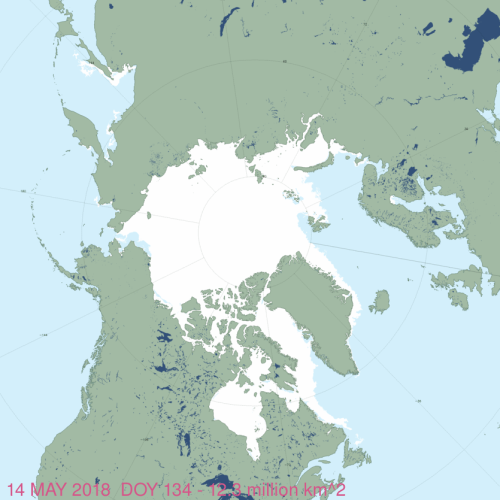
As of the 1st week in May 2018, most of Hudson Bay, Foxe Basin and Hudson Strait were covered with thick 1st year ice (dark green, >1.2 m thick):

Hudson Bay weekly stage of development 2018 May 7

Compare that to the 1st week of May 2016, which had much less thick first year ice than 2018 and more medium first year ice (70-120cm, bright green):

Hudson Bay ice stage of development weekly at 9 May 2016

To update the situation, at the end of May this year (week of 28 May), thick first year ice covered even more of the bay with a large patch of open water in the NW corner:

Hudson Bay weekly stage of development 2018 May 28

Thick first year ice does not melt as quickly as medium or thin first year ice (lime green) under most conditions, so the amount of thick first year ice present in May strongly affects the rate of breakup of the ice over the summer (temperature and wind also contribute). Here are some charts of ice melt sequences from the past (2016 and a couple others) that give a hint at what might be in store for Hudson Bay polar bears this year.

Continue reading

Activist laments ESA listing of polar bears in 2008 failed to achieve her political goals

The activist lawyer primarily responsible for polar bears being listed as ‘threatened’ on the US Endangered Species List (ESA) in 2008 is frustrated that those efforts have not generated her preferred political action. Kassie Siegel also claims in another 10 years it will be too late to save polar bears from extinction — despite clear evidence to the contrary.

Walking bear_129029633_web size

In an emotional rant over at The Hill with a predictably hysterical headline, Siegel perhaps reveals more than she should about her motivation (“Keeping fossil fuels in the ground is the only way to save polar bears ravaged by climate change,” 26 May 2018).

Continue reading

Status of Canadian polar bears updated map from Environment Canada

During a meeting of polar bear range states (Canada, Russia, Greenland, Norway, and the USA) in late January 2018 to discuss conservation issues, Canada — home to ~2/3 of the world’s polar bears — included in its presentation an updated population status and trend map approved by the Polar Bear Technical Committee in its presentation. This 2017 map replaces one from 2014 but is not yet available on the Environment Canada website.

Lunn et al 2016 EA cover image WH bear

UPDATE 11 June 2018: More recent versions of population and status assessment maps, published by Environment Canada 6 June 2018, conclude Southern Hudson Bay and Western Hudson Bay subpopulations have “likely declined.” See 11 June post here for more details and copies of the maps.

Contine reading

IUCN polar bear specialists reject IPCC- supported forecasts of sea ice based on CO2

In case you missed it — or missed the significance of it — polar bear specialist Mitch Taylor correctly pointed out in his recent essay (a response to the New York Times article that appeared Tuesday (10 April) about the Harvey et al. (2018) BioScience paper) that the IUCN Polar Bear Specialist Group have given up using computer models of future sea ice extent based on rising CO2 levels supported by the IPCC.

Polar_Bear_male_Regehr photo_March 21 2010_labeled

Their latest assessment (Regehr et al. 2016) does not link polar bear survival models to climate modeled forecasts of Arctic sea ice decline but rather to an assumption that declines already documented will continue in linear fashion over this century.

This means that CO2 emissions blamed on human fossil fuel use is no longer directly tied to the predicted future decline of polar bear numbers: IUCN polar bear specialists simply assume that sea ice will continue to decline in a linear fashion with no cause attributed to that decline except the broad assumption that anthropogenic climate change is to blame for Arctic sea ice declines since 1979.

No wonder former USGS polar bear biologist Steve Amstrup never refers to this IUCN PBSG study: he and the organization that now employs him, Polar Bears International, are still firmly wedded to the concept that CO2 is the sea ice control knob.

Continue reading

Tracking polar bears in the Beaufort Sea resumes after a one year hiatus

Fourteen bears tagged by the US Geological Survey (USGS) on or near the central Southern Beaufort Sea coast in April 2018 (near Kaktovik) will be tracked online over the coming months.

The break in published USGS tagging data from March 2017 to April 2018 was the first since the project began in December 2009 but no explanation for the hiatus has been provided. It is therefore unclear whether no tagging occurred in spring 2017 or data was simply not published online. The last bears followed were tagged in March 2016.

Tranquilized_pb570_S Beaufort March 2014_USGS

In contrast to previous years, this spring all fourteen of the bears have glue-on ear transmitters, which means they are either adult males or juvenile bears rather than females (which are fitted with satellite collars):

“In collaboration with the U.S. Fish and Wildlife Service we are also experimenting with glue-on and ear tag satellite transmitters, which can be deployed on adult male bears and younger, still-growing bears.”

Continue reading

Polar bear habitat update mid-May: little change since 1989 despite CO2 increase

Sea ice habitat for polar bears has not become progressively worse each year during their season of critical feeding and mating, as some scaremongers often imply. It’s true that absolute extent of Arctic ice is lower this spring than it was in 1979. However, according to NSIDC Masie figures, polar bear habitat at mid-May registers about 12 million km2, just as it did in 2006 (although it is distributed a little differently); other data show spring extent has changed little since a major decline occurred in 1989, despite ever-rising CO2 levels.

Polar bear feeding_Shutterstock_sm

In other words, there has been virtually no change in sea ice cover over the last 12 years, despite the fact that atmospheric CO2 has now surpassed 410 parts per million, a considerable and steady increase over levels in 2006 which were about 380 ppm (see below, from the Scripps Oceanographic Laboratory, included in the Washington Post story 3 May 2018):

Scripps CO2 curve at 29 April 2018

Not only that, but if rising CO2 levels were responsible for the decline of sea ice and implied effects on polar bears since 1979 (when CO2 levels were around 340 ppm), why has spring ice extent been so variable since 1989 (when the first big decline occurred) but so little changed overall since then? See the NSIDC graph below for April:

Sea ice 2018 April average_NSIDC graph

This year on day 134 (14 May), global ice cover registered 12.3 mkm2:

masie_all_zoom_4km 2018 May 14

In 2016 on the same day, the overall extent was much the same but there was more ice in the Chukchi and Bering Seas and less in the eastern Beaufort:

masie_all_zoom_4km 2016 May 14

More close-up charts of different regions below for 2018 vs. 2016, showing more detail.

Continue reading

Polynya refresher: open water in spring is due to winds & currents, not ice melt

Arctic sea ice begins to open up in spring at predictable locations due to currents and prevailing winds and this was as true in the 1970s as it is today. Polynyas and widening shore leads that most often get mistaken for early sea ice melt are those in the Beaufort and Chukchi Seas and in Hudson Bay.

Beaufort Sea male polar bear USGS_2005 Amstrup photo

But contrary to concerns expressed about possible negative implications of these early patches of open water, these areas have always been critical congregation areas for Arctic seals and are therefore important feeding areas for polar bears.

Seal habitat frozen open lead_Beaufort 2008_Miller

Seals hauled out beside a lightly frozen over lead in Beaufort Sea ice, 2008. USFWS.

Continue reading

Polar bear numbers, margins of error, & consequences for conservation status

Large margins of error in polar bear population estimates means the conservation status threshold of a 30% decline (real or predicted) used by the US Endangered Species Act and the IUCN Red List is probably not valid for this species.

Polar_Bear_Biologist_USFWS_working_with_a_Bear_Oct 24 2001 Amstrup photo

Several recent subpopulation estimates have shown an increase between one estimate and another of greater than 30% yet deemed not to be statistically significant due to large margins of error. How can such estimates be used to assess whether population numbers have declined enough to warrant IUCN Red List or ESA protection?

What do polar bear population numbers mean for conservation status, if anything?

Continue reading