Monthly Archives: February 2014

Foxe Basin aerial survey a watershed moment for polar bear research, Part 2

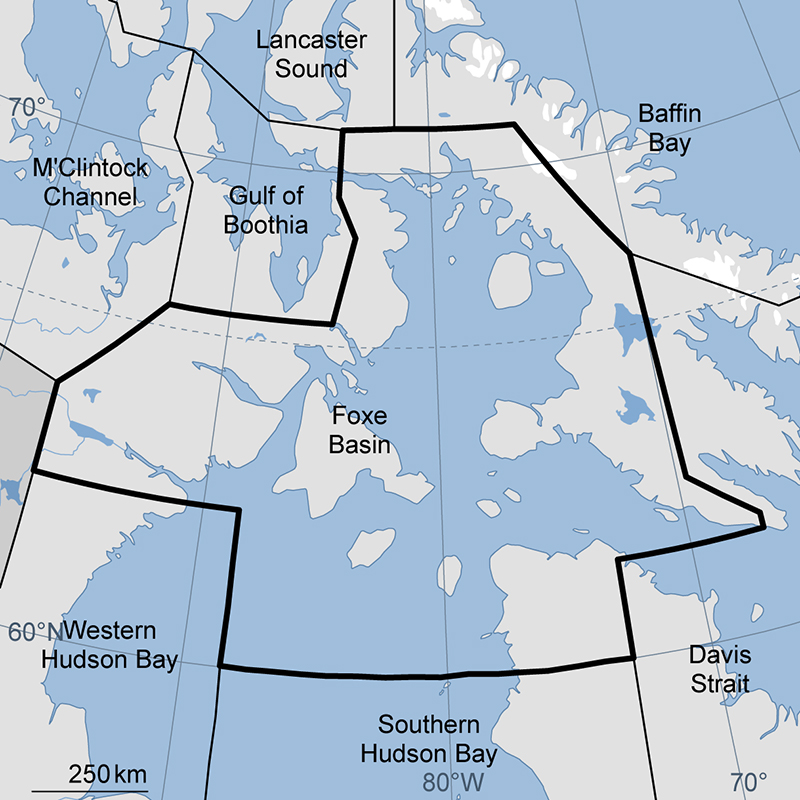
As I outlined earlier this week, Canadian Inuit objected so strenuously to routine mark-recapture methods used by polar bear biologists during the early days of a Foxe Basin population study in 2008 that the work was abandoned and an aerial survey done instead.

In this post, I’ll examine how the polar bear biologists involved reacted to that crisis, which they called a “control of research” issue.

In a published version of a conference paper, co-authored by two of the original investigators of the Foxe Basin mark-recapture study, Lily Peacock and Andrew Derocher (Peacock et al. 2011:374), had this to say:

Control of research is a developing source of conflict. In recent years, some permits for management-oriented research on polar bears were denied by the Government of Nunavut, local hunting and trapping organizations in the Northwest Territories, and by Makivik Corporation in Quebec. Furthermore, in a 2009 resolution, Inuit Tapiriit Kanatami opposed the capture of polar bears throughout Canada (available by request from http://www.itk.ca), even though the application of physical marks is one of the most effective methods of population estimation. Co-management is particularly difficult in Nunavut because of the large number of subpopulations (12), which makes it difficult to fund and conduct research.” [my bold]

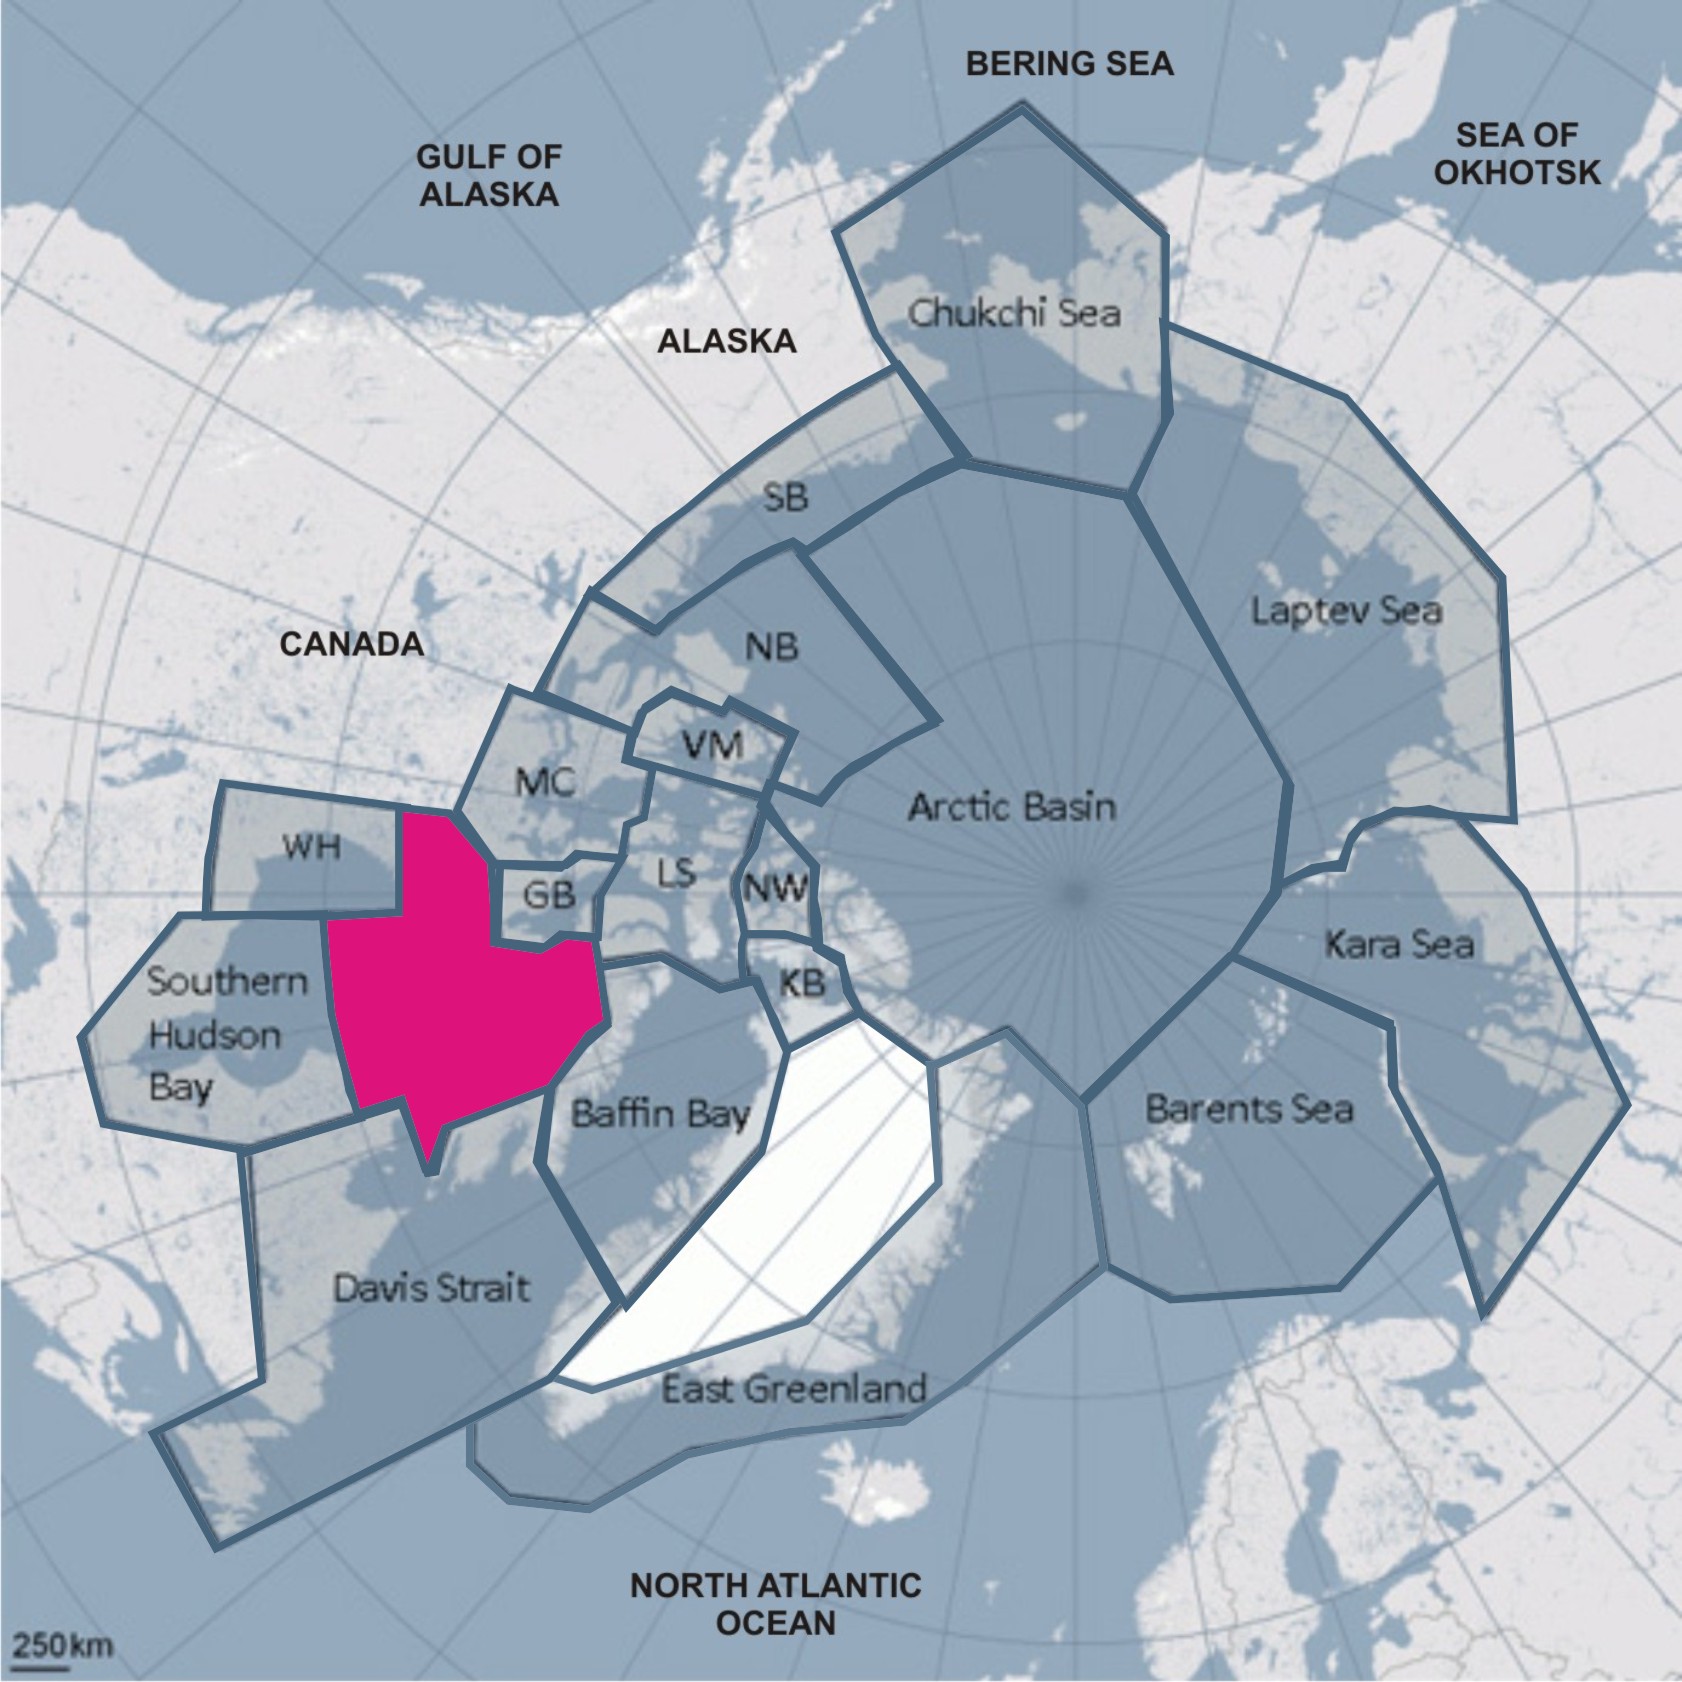
They raised an interesting point – since the Government of Nunavut has the power to insist biologists do more than reiterate that their way of counting bears is the only acceptable way, and because the government can deny permits to projects that don’t measure up, it can lock out traditional polar bear research for virtually all of Canada (the vast majority of Canada’s 13 subpopulations are in Nunavut, see Fig. 1), especially since aboriginal organizations in the Northwest Territories and Quebec have followed Nunavut’s lead.

Figure 1. Territory covered by the Government of Nunavut (top, Wikipedia) and the 13 polar bear subpopulations in Canada (bottom, Environment Canada).

Figure 1. Territory covered by the Government of Nunavut (top, Wikipedia) and the 13 polar bear subpopulations in Canada (bottom, Environment Canada).

That means if polar bear researchers can’t find a way to make their research mesh with Inuit concerns, they’ll be out of work in Canada. Let’s take a look at their approach and see how well it worked for them — explaining in part the new prominence of aerial surveys for population assessments. Continue reading

Tranquilizing polar bears and meat tainted with drugs

This follow-up to my last post has some new information about drug residues remaining in polar bear meat after the animals have been tranquilized.

Chukchi male 1240 lbs labeled Durner 2008

Continue reading

Foxe Basin aerial survey – a watershed moment for polar bear research, Part 1

While researching the population status of Foxe Basin polar bears I came across an issue that seems to have garnered relatively little attention outside the polar bear community – Inuit objections to the handling of polar bears during mark-recapture surveys and the effect of this on polar bear research in Canada.

 Figure 1. US Fish and Wildlife biologists handling a polar bear in the southern Beaufort during a fall survey, October 24, 2001. Steve Amstrup photo.


Figure 1. US Fish and Wildlife biologists handling a polar bear in the southern Beaufort during a fall survey, October 24, 2001. Steve Amstrup photo.

Foxe Basin is a large polar bear subpopulation region that encompasses the northern portion Hudson Bay into the area west of Baffin Island, see map below (courtesy IUCN Polar Bear Specialist Group).

FoxeBasin_PBSG website_Oct 2013Mark-recapture research methods routinely used by polar bear biologists became especially contentious in Foxe Basin during a population study initiated in 2007/2008, with Inuit residents voicing objections and biologists defending its practice. The following year, the mark-recapture effort was halted and an aerial survey took its place.

The aerial survey has been completed and a report on it was released in 2012 (Stapleton et al. 2012; see previous post for results) but we’ve heard very little about what happened to that mark-recapture study and why the Government of Nunavut pulled the plug on it. I plan to change that with the next couple of posts.

I’m not claiming to understand the nuances of the story because I’m only going by available documents. However, I think it’s important to shine some light on this issue since it has clearly changed the shape of polar bear research in Canada.
Continue reading

2013 PBSG polar bear status table information in one document

As I pointed out on Valentine’s Day, the IUCN Polar Bear Specialist Group (PBSG) has released a revised population estimate for polar bears of 18,349 (range 13,071-24,238), based on a new status table posted February 14, 2014.

PBSG status-table-2013_Feb 14 2014_intro

In that February 14th post, I also pointed out that as for the 2005 and 2009/2010 status tables, the PBSG did not add up the columns and give the totals — you had to do that yourself, which is how I got the numbers above (last week, I made a couple of graphs that show changes over time in their status table estimates). Oddly enough, there is now no mention of an official global polar bear estimate anywhere on the PBSG website.

In addition — and the point of this post — is that to see the details of how and why the PBSG biologists arrived at the population estimates and the status assessments they present (with references), you have to click on the hyperlinked title of each separate subpopulation in the table. While they made a one-page black and white summary of the online colour table available as a pdf (linked at the bottom of the page), they did not make the assessment details from the status table available in pdf format.

So I did it myself, via copy/paste into a Word document that I converted to a searchable pdf, without editorial comment except that I included the totals given above and noted a few glaringly obvious omissions (see below). It took me all of 30 minutes.

I offer it here for more effective scrutiny, convenient reference and archival purposes — because the way it stands now, the online table could disappear tomorrow without any hard-copy evidence of the information hyperlinked within it.

UPDATE February 26, 2014 I checked the PBSG website this morning and the omissions I noted below that were present a few days ago have been fixed. I did not receive a reply to my email notification of the issue. An updated pdf is now available.

Continue reading

Chukchi-Beaufort sea ice atlas: check out polar bear habitat 1850-2013

It’s here – as promised and right on schedule — the sea ice atlas put together by University of Alaska Fairbanks (UAF) now has ice concentration maps for Alaska going back to 1850 — and for every year up to 2013. 

Several examples are included below: August 1850 vs August 1870, and April 1850 vs. April 1920 and April 2012.

For background, see my post announcing the site preview, which was then limited to 1953-2012 data, when it became available in late January.

Sea ice atlas_1850_Aug
Continue reading

Graphing polar bear population estimates over time

I’ve already commented on the 2013 update of polar bear population status released by the IUCN Polar Bear Specialist Group (PBSG).

However, I thought it might be interesting to graph the changes in global population estimates over time (from 1981-2013) — not just the actual estimates from PBSG status tables (with their min/max error ranges) but those totals plus the so-called “inaccurate” estimates that the PBSG have dropped from their accounts in recent (2005-2013) assessments: Chukchi Sea, East Greenland, Queen Elizabeth Islands (now known as the “Arctic Basin”), and Laptev Sea.

In 2001, those “inaccurate” estimates contributed 5,000-5,400 bears to the global total, but now they’re gone — no bears from those regions contribute to the official totals listed on recent PBSG status tables.

Adding those dropped estimates back into the global totals makes it possible to generate a graph in which the global estimates are truly comparable over time.

To see how the dropped estimates influenced the perception of population change over time, I’ve also graphed the estimates given by the PBSG in their status tables. I’ve combined the two into one image (Fig. 1, click to enlarge) to make comparison easy.

UPDATE 5 December 2014: Links to more recent posts relevant to this issue added below. The most recent numbers, added 31 May 2015, are here.

UPDATE 26 March 2019: See “Latest global polar bear abundance ‘best guess’ estimate is 39,000 (26,000-58,000)
Continue reading

Polar bear population now officially 13,071-24,238 says IUCN Polar Bear Specialist Group

Without fanfare of any kind (so far), the IUCN Polar Bear Specialist Group (PBSG) has just announced, via a notice posted on its website, that it has revised the population estimate for polar bears to 18,349 (range 13,071-24,238), based on a new status table posted today.

The average is down slightly from the 2009 estimate of 19,747 (which was officially stated as “20,000-25,000”), but that “decline” is an illusion.

As for the 2005 and 2009/2010 status tables, they do not add up the columns to give the totals — you have to do that yourself, which is how I got the numbers above. There is no mention of a change to the global estimate total in any of the “announcements” on their website.

As occurred in 2005 and 2009
, an overall reduction in the total was achieved primarily through removal of an estimate present on their tables since 1993 (Laptev Sea, “800-1200”). Changing this estimate to zero reduced the average total by 1,000 but does not reflect a real-world change.

In addition, four subpopulation estimates were reduced, three of them only slighty (details below) and three subpopulation estimates (Foxe Basin, Western Hudson Bay and Southern Hudson Bay) were increased to reflect recent aerial survey results. Two others were increased slightly.

A new column has been added to the status table, again without explanation, called the Trend relative to historic level (approx. 25-yr past).” Although only seven out of 19 subpopulations had anything like an accurate estimate in 1989, four are now considered to have been “not reduced” while three are considered “reduced.” Why this is considered meaningful enough to add to the table is not clear.

The PBSG say they have decided to update the status table independent of their meetings, which means that no written report or document will be made available to explain any changes — the “justifications” will only be available online.

These are the people we are supposed to trust to provide honest and accurate information about the status of polar bears worldwide. The changes in the status table provided today, which have been made without oversight of any kind, hardly inspire confidence in the information they provide. See what you think.
Continue reading

Foxe Basin polar bear status – another stable population

Foxe Basin_PBSG

Figure 1. Polar bear subpopulation regions defined by the Polar Bear Specialist Group, Foxe Basin marked.

Foxe Basin is a large subpopulation region (Fig. 1), with a total area of 1.18 million square km (Vongraven and Peacock 2011). It comprises Northern Hudson Bay and western Hudson Strait, and the area between western Baffin Island and eastern Melville Peninsula, with a large island (Southampton Island) in the middle (Figs. 2 and 3).

Figure 1. Foxe Basin polar bears subpopulation region, courtesy IUCN PBSG

Figure 1. Foxe Basin polar bears subpopulation region, courtesy IUCN PBSG

Continue reading

Thriving Foxe Basin and Davis Strait polar bears threaten nesting sea birds

UPDATE February 11, 2014. A reader (Kevin, at “Afton’s Waterfowl List”) has pointed out an error in Fig. 3, where I inadvertently labeled the bars on the upper graph as ending in 2011 instead of 2012 (the Pembroke graph ends at 2011. sigh..). I have corrected the figure and the text that refers to it, but do not believe it affects the overall conclusion. See for yourself. Thanks Kevin — and Alan for getting in touch!

Another round of press release inspired news stories emerged last week insisting that polar bear predation on ground-nesting birds during the summer ice-free period is evidence that they are nutritionally stressed by global warming.

A few weeks ago it was snow goose eggs in Western Hudson Bay – this time it’s thick-billed murre (Uria lomvia) and common eider (Somateria mollissima) eggs in Foxe Basin and Hudson Strait (e.g. see the story at Canada’s National Post and a short summary provided by Science [and it’s not even their paper!]). The source of the media attention this time is a newly-published paper by Samuel Iverson and colleagues (Iverson et al. 2014).

Figure 1. From Iverson et al. 2014 (their Fig.1), “map of the study area.” Most of the study sites are within the Foxe Basin polar bear subpopulation region (see Fig. 2 below), although the Ungava Peninsula (E), Ungava Bay (F) and Frobisher Bay (C) sites are in the Davis Strait subpopulation.

Figure 1. From Iverson et al. 2014 (their Fig.1), “map of the study area.” Most of the study sites are within the Foxe Basin polar bear subpopulation region (see Fig. 2 below), although the Ungava Peninsula (E), Ungava Bay (F) and Frobisher Bay (C) sites are in the Davis Strait subpopulation.

Polar bears have always preyed on ground-nesting sea bird and goose eggs while onshore (see Kelsey Eliasson’s take on the situation around Churchill, at his PolarBearAlley blog). The issue in this case is whether the increase in predation can be unquestionably blamed on reduced sea ice cover and nutritionally-stressed bears – that is, predation increases that correlate with year-to-year sea ice changes and bears in poor condition found consuming bird eggs.

As I did for the “polar bears eat more caribou and snow geese than they used to” press release, I refused to take the PR or the news stories at face value and went to the published paper and its supplemental data (it’s open access, see it for yourself here).

What I see in this paper is a spurious sea ice correlation and no data on the condition of the few bears observed consuming eggs. There is also no mention of the fact that polar bear numbers have increased in part of the study area (Davis Strait) or that bears in Foxe Basin and southern Davis Strait have been found to be in very good condition and reproducing well (Rode et al. 2014; Peacock et al. 2013). See my analysis below and judge for yourself.

Continue reading

Tracking polar bears in the Beaufort Sea: January map

Here is the January 2014 follow-up to my post on the July 2013 track map for female polar bears being followed by satellite in the Beaufort Sea by the US Geological Survey (USGS) – Ten out of ten polar bears being tracked this summer in the Beaufort Sea are on the ice.

See that post for methods and other background on this topic, and some track maps from 2012 (also available at the USGS website here).

The USGS track map for January 2014 is copied below (Fig. 1).

Both the Southern Beaufort and the Chukchi Sea were completely ice-covered by the end of January. The seven bears tracked during November and December were reduced to five in January — down 50% from the ten bears collared in July.
Continue reading