
I’ve been busy with work-related activities lately and will be for several more weeks. Until then…
Sea ice changes since March 15 [Update added May 10, see below]
Lots of ice everywhere – even in Hudson Bay. A bit less ice in the Barents Sea (north of Norway) than there was two months ago at the sea ice maximum March 15 (see Fig. 1 below compared to the extent at May 5 in Fig. 2: both from NSIDC). But there is still quite a bit around Svalbard – that group of islands between NE Greenland and NW Norway (see Fig. 3 below a MASIE image, where this situation is more apparent).
Polar bears are eating and mating at this time of year (early May being the tail-end of the season in most areas) – and right now, they have a huge, circumpolar ice platform for those activities.
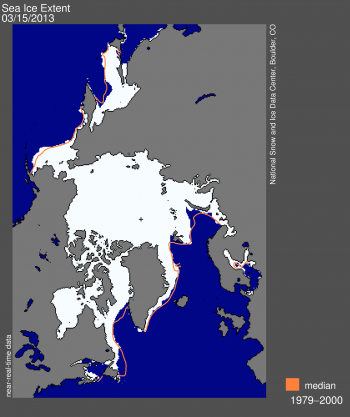
Figure 1. Sea ice extent at March 15, 2013 – the declared winter maximum.
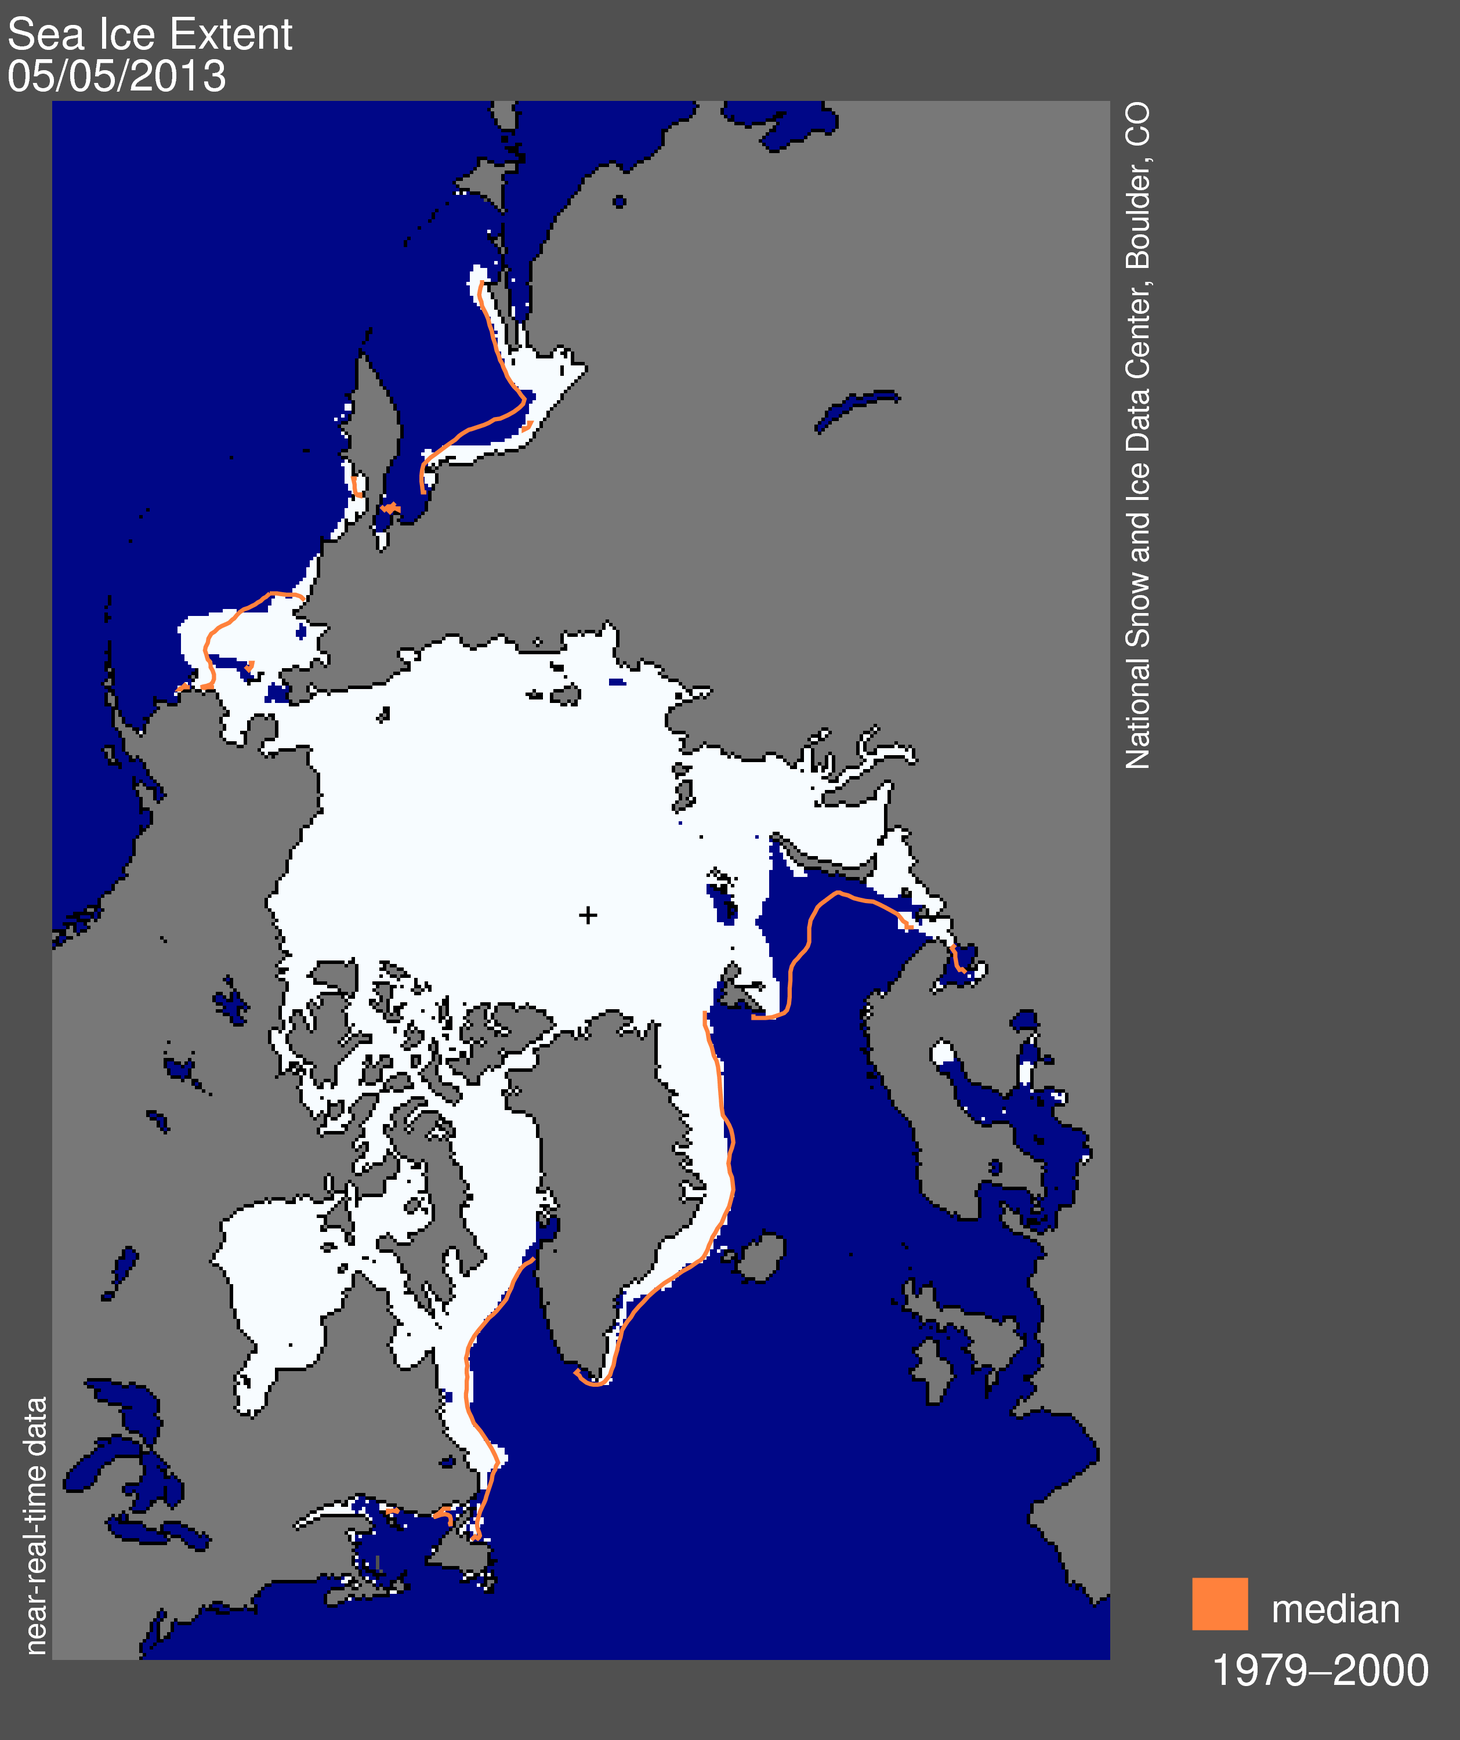
Figure 2. Sea ice extent at May 5, 2013 – almost 2 months past the maximum.

Figure 3. Another view of the May 5, 2013 extent, covering 13.9 million km2.
UPDATE May 10, 2013: I’ve added this sea ice graph from the Danish Meteorological Institute, Centre of Ocean and Ice, which shows that the amount of ice present now is just about ‘normal’ for this time of year (the mean of 1979-2000 values) and well within one standard deviation. The graph tracks ice concentration higher than 15%, determined from satellite data.
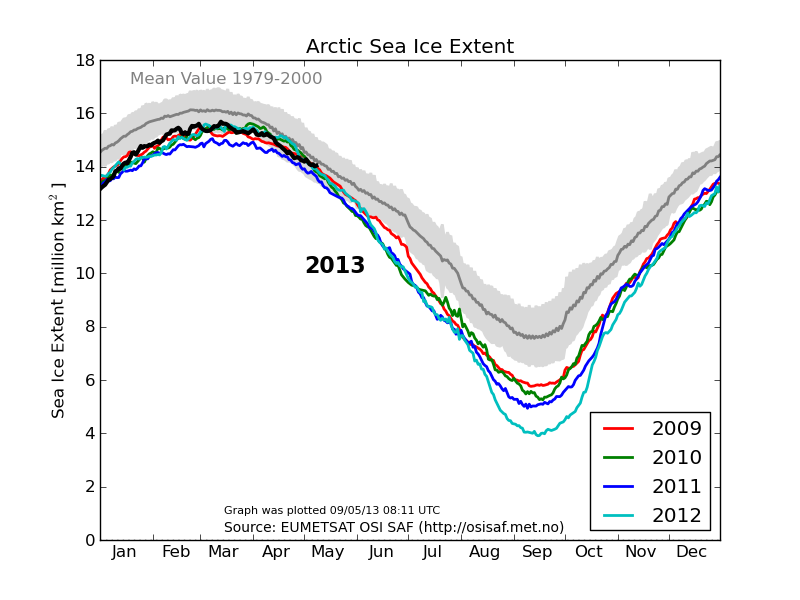
Figure 4. Sea ice extent graph plotted by the DMI for May 9, 2013
(2013 is the black line).


You must be logged in to post a comment.