Tag Archives: sea ice extent

Polar bear survival: habitat 2013 vs. 2016 for 22 January

Using sea ice maps issued by the National Sea Ice Data Center (NSIDC), it’s interesting to compare these two years with respect to polar bear health and survival (keeping in mind that no polar bears live in what I like to call the armpits of the Arctic – the Sea of Okhotsk, the Baltic Sea or in the Gulf of St. Lawrence)1:

22 January 2016

Sea ice extent 2016 Jan 22 NSIDC

Continue reading

July 2015: all 13 collared polar bears in the Southern Beaufort are out on the sea ice

Most of these bears are close enough to shore to hit the beach if that’s where they wanted to be but they’re on the sea ice.

Polar bear S Beaufort_PolarBearNews2010

I’ve been posting these USGS tracking maps for two years.1  The map archive at USGS goes back to December 2009.  Seeing all animals on the ice in July is usual for Southern Beaufort polar bears.

During August, a few of these females usually come ashore (see here and here), probably because they plan to den there later. But most polar bear females stay out on the ice, no matter how far it contracts into the Arctic Basin. Only about 5% of SB bears spend time on land during the summer.

See the July track map below and some sea ice maps and graphs for the region.
Continue reading

Melt season update – Bering Sea ice abundant & Davis Strait ice 2nd highest since 1971

Polar bear habitat in the eastern Bering Sea has expanded since the official spring “maximum extent” was called for late February, and Davis Strait sea ice is tied for 2nd highest since 1971 for this week. Both regions have healthy polar bear populations and spring conditions suggest this will continue into this year.

Rode and Regehr 2010_Chukchi_report2010_Fig1_triplets_labelled

Although the melt season is underway, as of yesterday (22 April, Julian day 112) overall Arctic sea ice extent (Fig. 1) was higher than it was on the same date in 2014, 2007, and 2004 (see also Fig. 2). Despite the record low extent in February (Fig. 3), that pessimists at Polar Bears International suggested was relevant to polar bear heath and survival, I showed that was misleading.

Figure 1. Sea ice extent at 22 April (Julian day 112) for 2015, at 13.976 mkm2, was well within 2 standard deviations and higher than 2007 (shown) as well as 2004 and 2014 (not shown – see it for yourself here).

Figure 1. Sea ice extent at 22 April (Julian day 112) for 2015, at 13.976 mkm2, was well within 2 standard deviations and higher than 2007 (shown), as well as higher than 2004 and 2014 (not shown – see it for yourself here). Click to enlarge.

Sea ice maps and charts tell the story of current polar bear habitat throughout the Arctic.
Continue reading

Arctic sea ice extent total for March does not equal global polar bear habitat

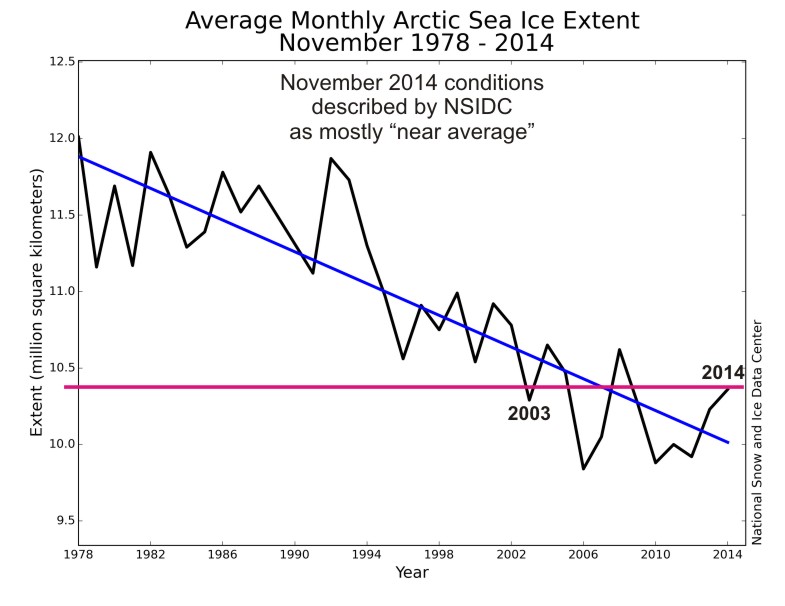
Only half or less of the estimated 2.6% loss per decade of March sea ice extent since 1979 (Fig. 1, below) represents a decline in polar habitat. That’s because several regions with sea ice that are not home to polar bears, like the Sea of Okhotsk, are included in Arctic sea ice totals.

Figure 1. Average monthly Arctic sea ice extent for March 1979-2015, which includes ice in the Sea of Okhotsk and the Sea of Japan, a decline of 2.6% per decade. NSIDC, March summary 2015.

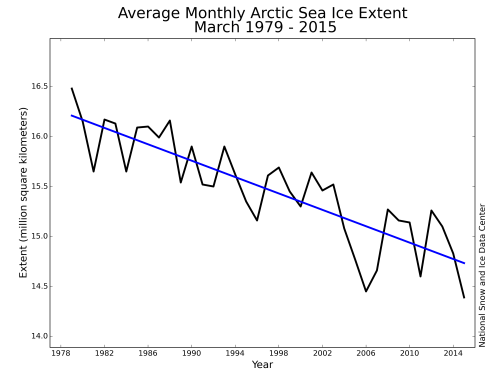
Figure 1. Average monthly Arctic sea ice extent for March 1979-2015 (which includes ice in the Sea of Okhotsk, the Sea of Japan, and the Baltic, where polar bears do not live), shows a decline of 2.6% per decade. NSIDC, March summary 2015.

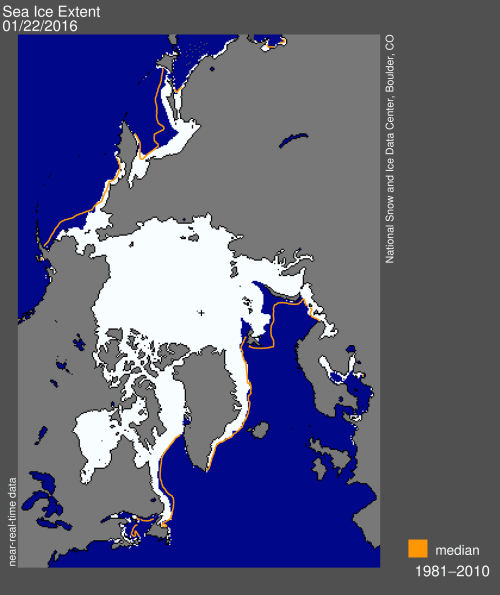
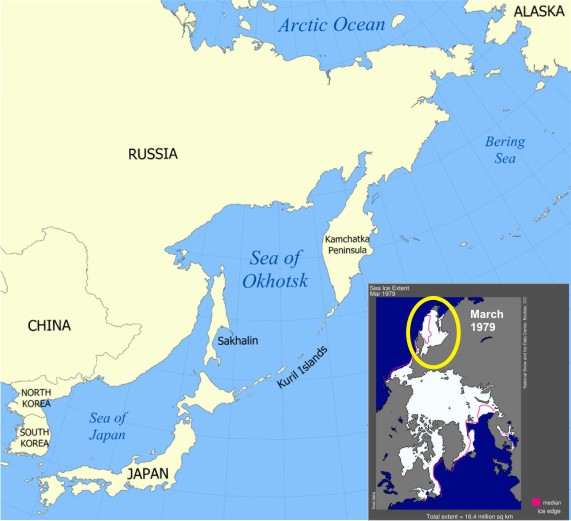
Both the Sea of Okhotsk and northern Sea of Japan (Fig. 2) have sea ice in winter (which is included in total Arctic sea ice records) but they are not truly “Arctic” – neither is connected to the Arctic by continuous ice, even when the ice is at its maximum extent (nor is the Baltic Sea — in contrast to Hudson Bay and the east coast of North America, which are connected to the Arctic by continuous ice).

Sea of Okhotsk_1979 March marked_PolarBearScience

Figure 2. Location of the Sea of Okhotsk and Sea of Japan. Insert ice map for March 1979 from NSIDC shows it’s position relative to the Arctic proper.

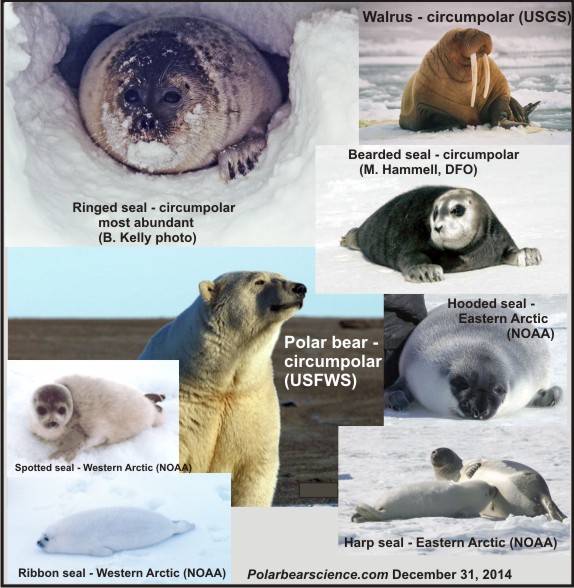
That lack of connection to Arctic pack ice is probably the main reason that polar bears never colonized the Sea of Okhotsk, even though western Arctic seal species (ringed, bearded, spotted, and ribbon) and Arctic whales  (bowhead and beluga) live there. Polar bears don’t currently live in the Sea of Okhotsk and all evidence suggests they never have.

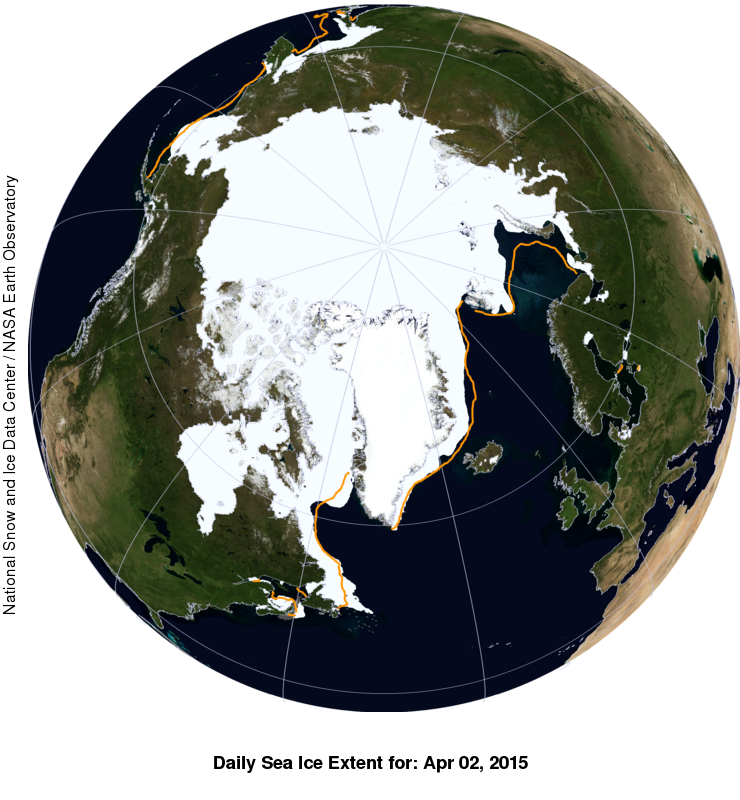
Sea ice maps show that about half of the total ice extent difference between March 1979 and March 2015 was due to a relatively large decline in sea ice cover for Sea of Okhotsk and northern Sea of Japan — regions without polar bears. Surely no reputable scientist or journalist would suggest that the “record low” maximum ice extent for 2015 has any relevance for polar bear health and survival? [or for Northwest Passage travel, for that matter] Sadly, they would.

Continue reading

Superb sea ice conditions for polar bears worldwide during their critical feeding period

Prognosis, excellent. The sea ice hunting platform that polar bears require is everywhere and Davis Strait ice extent is the fourth-highest it’s ever been at this time of year.

Sea ice extent global 2015 April 2 NSIDC with anomaly WUWT

The spring feeding period is a messy, brutal business – many cute baby seals will die as polar bears consume 2/3rds of their yearly food supply over the next few months (April – June/early July), while sea ice is abundant.

Arctic marine mammals_Dec 31 2014_Polarbearscience

That leaves the remaining 1/3 of their energetic needs to be met over the following 9 months (most of it in late fall (late November/December) and hardly any during the summer months, regardless of whether the bears are on land or out on the sea ice) or over the winter. Continue reading

Polar bear habitat update – November 2014 average sea ice levels higher than 2003

Average polar bear habitat for November 2014 was well within two standard deviations1 and higher than 2003, according to the November report from the National Snow and Ice Data Center (line and labels added, below).

Arctic ice Nov aver_NSIDC_sm_PolarBearScience

Notice that the lowest average November level occurred in 2006not 2007 (after the second lowest September extent since 1978) and not 2012 (after the lowest September extent since 1978). Take note that the scale on the graph above does not go to zero but to a whopping ~9.5 million square km!

Quotes from the NSIDC monthy report and sea ice maps for November 2014 and 2 December 2014 below.

UPDATE 3 December 2014: CIS has issued a new ice map corrected for ice level on Hudson Bay – new map below.
Continue reading

Labrador polar bears face a longer ice-free season than Hudson Bay bears, but do well

Pretty typical ice levels in both regions for this time of year – Davis Strait polar bears (especially those in Labrador) are still onshore while Hudson Bay bears (even those in the south) have their sea ice hunting platform back.

Davis Strait Hudson Bay freeze-up at Nov 25 2014_PolarBearScience

Funny thing is, the Davis Strait subpopulation may still be increasing despite a longer ice-free season than Western Hudson Bay. And bears in the south of that region – who spend the summer onshore in Labrador – have the longest ice-free season of all1 yet according to the latest survey they were even doing better than bears in northern Davis Strait.

That apparent paradox has an easy explanation – sea ice extent in late summer/early fall (length of the ice-free season) has much less of an impact on polar bear health and abundance than the state of the food supply in the spring. More seals in spring, polar bears do well; few seals in spring, polar bears starve.

Continue reading

“Meltdown: Terror at the Top of the World” — new book exploits polar bear attack to sell fear of sea ice decline

The polar bear attack that was all over the news last summer is now an ebook about global warming. The Maine lawyer who was mauled by a bear while on a hiking trip to Labrador (and lived to tell the tale) has allowed his story to be co-opted by an activist journalist to promote fears of sea ice decline, polar bear extinction, and man-made global warming.

Melt-down_Terror at the Top of the World_Nov 12 2014 press release book cover

The press release issued yesterday by the news group that published the book and employs author Sabrina Shankman (InsideClimateNews), described it this way:

“A riveting new e-book about the battle between man, beast and Nature in a warming world. Called Meltdown: Terror at the Top of the World, the e-book tells the story of the hikers’ harrowing encounter with a polar bear; of the plight of the polar bear in general, facing starvation and extinction as the sea ice melts and its habitat disappears; and of the Arctic meltdown, the leading edge of man-made climate change.”

I have little doubt the man mauled by the bear was indeed terrified and that his companions were as well. However, that horror is exploited shamelessly in this book as a means to promote anxiety over the future survival of polar bears and instill panic over a prophesied Arctic “meltdown.”
Continue reading

Polar bear habitat update – Sea ice starting to form on Hudson Bay

Is that ice I see forming along the shore of Hudson Bay, just in time for Hallowe’en? Not enough to resume hunting but a sign that freeze-up can’t be too far off. See the ice map below and this photo posted at PolarBearAlley confirming the presence of slushy ice on the shore near Churchill.

Sea ice extent Canada 2014 Oct 31 CIS

[Map above from Canadian Ice Service updated daily, click to enlarge]

Continue reading

Polar bears are not in peril due to recent sea ice changes

To counter the misleading ploy used by the Sunday Times — of implying polar bears are in peril because of recent changes in Arctic sea ice (Sunday Times & The Australian, 21/22 Sept. 2014 Arctic ice cap in a ‘death spiral’) — I’ll go over again why the polar bear as a species is not threatened by declines in summer sea ice or even winter ice that is predominantly “thin” (first year) ice.

Polar Peril_Arctic ice cap in a death spiral_SundayTimes_Sept 21 2014_21_NWS_20_POLAR_1096592k
Graphic above from the Sunday Times, September 21, 2014
Continue reading