
[Update Nov. 23, 2013: I’ve added a few comments, noted, in the text]
This is a follow-up to an earlier post, Polar bear problems in N Hudson Bay not due to late freeze-up, to counter some misinformation that’s being circulated about the history of Hudson Bay freeze-up dates.
Polar bear biologists working in Western Hudson Bay published new definitions of breakup and freeze-up earlier this year. The new method better reflects how polar bears interact with seasonal changes in sea ice on the bay.
Formerly, 50% ice coverage levels were used to assign the date when major ice change phenomena were reached each year (breakup in summer, freeze-up in fall (e.g. Gagnon and Gough 2005). The new method (Cherry et al. 2013, see discussion here) defines breakup at 30% ice coverage and freeze-up at 10%.
Cherry and colleagues had a fairly complicated method of defining 30% coverage for breakup in Western Hudson Bay. However, freeze-up in the fall is much simpler because ice always forms first along the western shore, starting in the north.
This means that the weekly graphs of ice development provided by the Canadian Ice Service for Hudson Bay, which are expressed as a percentage (just like the Cherry et al. study), can be used to compare freeze-up dates historically.
These graphs refute the absurd claim that freeze-up on Hudson Bay has been “one day later each year” over the last 30 years – an assertion repeated just the other day at PBI. Let’s take a closer look, shall we?
Writing about freeze-up (November 20), PBI said this:
“This year’s ice formation is earlier than in recent years, when delayed freeze-ups of Hudson Bay have forced the bears to undergo longer fasting periods. Over the past thirty years, the bay has been freezing an average of a day later each year, so it’s good news for the bears that natural variation has many of them feasting on seals a bit earlier this year—although later than the historical average and with most of the bay still open water.” [links in original, my bold]
[Both links provided by PBI are to a pdf of the middle graph shown in Figure 1, below, compiled by CIS for the week of November 12, as if this one graph is all the evidence needed to support their assertion. Note also that the claim of “1 day later per year for 30 years” is a 30 day difference from about 1984 to 2013. This is not quite the 33 years covered by the graph they present to support their claim but I’m not going to quibble that because I don’t think it really matters, as you’ll see below]
According to the graph generated by the Cherry method, freeze-up occurred on or about November 12 in 1991 and 1993: this was the earliest freeze-up date recorded between 1991 and 2009. The latest freeze-up dates occurred in 1998 and 2009, on or about December 6.
How does this compare to CIS weekly ice development graphs from 1981 to 2013, such as PBI used to support their allegation of “one day later each year”? Not bad, as it turns out.
This year, polar bears were testing out the ice and starting to hunt by November 13 [week of Nov. 12], when ice coverage was ~5% (according to the graph for the week of Nov. 12). Because of this (and because we know that ice forms very rapidly after this point), I’ve marked the 5% level on all the graphs with a pink line and circled the mark for the 10% line (now the official “freeze-up” level as far as polar bears are concerned, according to Cherry et al. 2013).
PBI says bears had basically left the shore by Nov. 20, and that ice extended at least 6 miles out into the bay by that date (see ice maps here).
[Kelsey over at PolarBearAlley, on the ground near Churchill, contends that freeze-up occurred between 11th and 15th November, evidence that this is not a phenomenon that’s synchronized or uniform across the entire region. Kelsey has some thoughts on that too].
That said, ice coverage was ~10% according to the CIS graph for the week of Nov. 19 (Fig. 2), which is in good agreement with the predictions made by Cherry and colleagues in their paper: so far, so good.
But to understand how ice coverage has changed over the last 30 years or so, we need to look at more than the graph for November 12, as PBI try to do. We need to see the ice graphs going back to at least the end of October (Fig. 1, below).
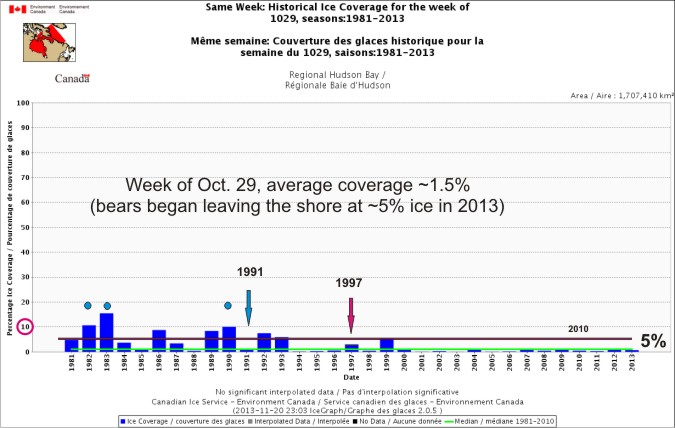
Figure 1. Historic weekly ice coverage generated by the Canadian Ice Service for Regional Hudson Bay, for the week of October 29 (1981-2013). There were only 3 years (blue dots) when the ice had reached 10% coverage (1992, 1993 and 1990), the point when bears would have left the shore. The green line is the average for that week calculated by CIS (over 1981-2010), while the pink line (added) is the 5% level (rapidly forming ice). Note that 2012 and 2013 – as well as 2000, 2004, 2007, and 2009 – had average ice coverage by this date, about 1.5%.
Polar bears would have left the shore as early as October 29 (indicated by the 10% line, blue dots in Fig. 1) only three times between 1981 and 1991. [added: I chose 1991 as a “bridge year” because that is when the detailed Cherry et al. data ended.]
Therefore, it was not usual for freeze-up (10%, the coverage critical to for polar bears) to have occurred at the end of October during the early part of the satellite record. [added: I did check the graph for the week before this (October 22), which showed no years with 10% ice coverage]
The top panel of Fig. 2 shows that the usual condition prior to 1991 was for freeze-up to occur the week of November 5: 7 out of 11 years had freeze-up the week of November 5.
After 1991, freeze-up did not ever occur the week of November 12 (Fig. 2, middle panel — the graph used by PBI to support their claim), although 1997, 1999 and 2004 came close. Also, in several years, ice coverage had reached 5% by the 12th of November, [added: which we know from recent years is when some bears move onto the ice.]
In fact, after 1991, it was normal for freeze-up to be completed by November 19 (Fig. 2, bottom panel): 17 out of 22 years had 10% coverage by that date. This is a difference of two weeks: 14 days or so.
Note from the graph for November 19 that in 2009, ice coverage was only slightly below 10%. In 1998 and 2003, coverage had reached 5% by November 19, indicating ice development was well underway in those years as well.
However, in 1998 coverage did not reach the 10% level until early December (which the Cherry et al. graph also shows). However, breakup that summer was very late (bears did not leave the ice until about August 22), which means that in 2009, polar bears did not spend any longer on shore than average.
This means that there were only two years after 1991 (2006 and 2010) when freeze-up on Hudson Bay was not well underway by November 19.
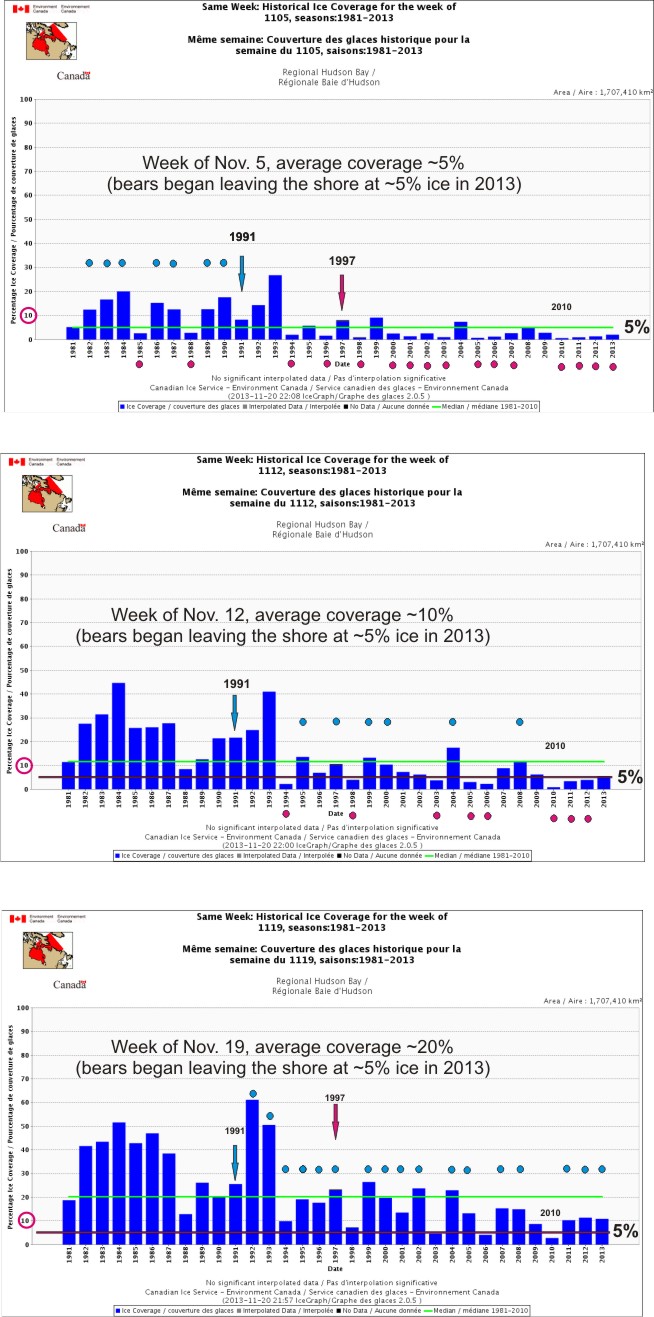
Figure 3. Historic weekly ice coverage generated by the Canadian Ice Service for Regional Hudson Bay. Upper panel is coverage for the week of November 5. Middle panel is the week of November 12. Lower panel is the week of November 19. The green line is the average for that week calculated by CIS (over 1981-2010), while the pink line (added) is the 5% level (rapidly forming ice). The 10% mark on the left scale is circled, indicating the line for new official “freeze-up” level as far as polar bears are concerned. Pink dots indicate years when ice coverage had reached 5% (rapidly forming ice) by that date; Blue dots mark years when the 10% level had been reached (official freeze-up level for polar bears). Click to enlarge.
In summary, for the period 1981-2013:
- Prior to 1991, it was normal for freeze-up (10% coverage) to be completed by November 5.
- After 1991, it was normal for freeze-up to be completed by November 19, two weeks later. Freeze-up for the last three years (2011, 2012, 2013) was normal, completed by the week of November 19.
- [added: It may be necessary to constrain “freeze-up” to a single calendar date for graphs and models, but it is not biologically meaningful to do so: the movement of polar bears onto the newly developing ice in the fall seems to take about a week. This suggests the weekly CIS ice charts are perfectly adequate for assessing freeze-up changes over time.]
- The change in freeze-up dates relevant to polar bears over the 33 year historic record of 1981-2013 is about 2 weeks.
- There has not been a discernible trend for freeze-up being “one day later per year” over the historic record, as Polar Bears International claims. [added: If PBI have evidence to support their assertion, they haven’t yet presented it. ]
References
Cherry, S.G., Derocher, A.E., Thiemann, G.W., Lunn, N.J. 2013. Migration phenology and seasonal fidelity of an Arctic marine predator in relation to sea ice dynamics. Journal of Animal Ecology 82(4):912-921.
http://onlinelibrary.wiley.com/doi/10.1111/1365-2656.12050/abstract
Gagnon, A.S. and Gough, W.A. 2005. Trends in the dates of ice freeze-up and breakup over Hudson Bay, Canada. Arctic 58: 370-382. http://arctic.synergiesprairies.ca/arctic/index.php/arctic/article/view/451


You must be logged in to post a comment.