
Without fanfare of any kind (so far), the IUCN Polar Bear Specialist Group (PBSG) has just announced, via a notice posted on its website, that it has revised the population estimate for polar bears to 18,349 (range 13,071-24,238), based on a new status table posted today.
The average is down slightly from the 2009 estimate of 19,747 (which was officially stated as “20,000-25,000”), but that “decline” is an illusion.
As for the 2005 and 2009/2010 status tables, they do not add up the columns to give the totals — you have to do that yourself, which is how I got the numbers above. There is no mention of a change to the global estimate total in any of the “announcements” on their website.
As occurred in 2005 and 2009, an overall reduction in the total was achieved primarily through removal of an estimate present on their tables since 1993 (Laptev Sea, “800-1200”). Changing this estimate to zero reduced the average total by 1,000 but does not reflect a real-world change.
In addition, four subpopulation estimates were reduced, three of them only slighty (details below) and three subpopulation estimates (Foxe Basin, Western Hudson Bay and Southern Hudson Bay) were increased to reflect recent aerial survey results. Two others were increased slightly.
A new column has been added to the status table, again without explanation, called the “Trend relative to historic level (approx. 25-yr past).” Although only seven out of 19 subpopulations had anything like an accurate estimate in 1989, four are now considered to have been “not reduced” while three are considered “reduced.” Why this is considered meaningful enough to add to the table is not clear.
The PBSG say they have decided to update the status table independent of their meetings, which means that no written report or document will be made available to explain any changes — the “justifications” will only be available online.
These are the people we are supposed to trust to provide honest and accurate information about the status of polar bears worldwide. The changes in the status table provided today, which have been made without oversight of any kind, hardly inspire confidence in the information they provide. See what you think.
On December 16, 2013, the PBSG posted a brief announcement on their website (see previous post here) inferring an intention to publish a new population estimate and new subpopulation boundaries by February 1, 2014 (pdf here). The update did not appear as promised and was revised on February 3 to “in February.”
Today (February 14, 2014), the “Population status reviews” page (dated February 14, 2014) says this:
“The PBSG subpopulation status table and status assessments have been regularly updated for decades. The first status table was published after the 11th meeting of the PBSG in Copenhagen in 1993. Status reviews have traditionally been discussed and updated every time the group members have physically met. From now on the status assessments will be updated as new information becomes available, and a new status table was agreed upon prior to the Moscow Meeting of the Parties in December 2013.” [my bold]
A single line “News” item on the PBSG home page announces: “New status table finalized.” This is what it says:
“A new and updated status table was discussed fall and early winter 2013, and agreed on by the group as of December 1, 2013. The group has decided to detach the process of updating these status reviews from physical meetings, and the table will from now on be updated when new and valid information are available.” [my bold]
In other words, there will no longer be a document that includes explanations for changes made to the structure of the table, references to published documents, and explanations for changes made to various subpopulation estimates. As explained below (at least, as of now), it appears that the details will only be available online.
The new 2013 status table is offered online in colour here, copied below as an image (click to enlarge). The online version has detailed text explanations, with references, hyperlinked to each subpopulation entry (“Press the subpopulation hyperlink and more information will appear“). This seems to have replaced the misleading “State of the Polar Bear” graphic that the PBSG commissioned for upwards of US$50,000. [A pdf copy of the 2013 colour table is here.]
A pdf of the table is provided by the PBSG (a black and white version, one page, copied here. However, the explanations for the status decisions are not included — those are only available in the online version. In other words, the entire status table information package is not available as a single document.
[a pdf of the “2010 status table” is here, for comparison]
Changes from the 2010 table in population estimates for the various subpopulations are detailed below the status table image and a map of the polar bear subpopulations is included at the end of the post.
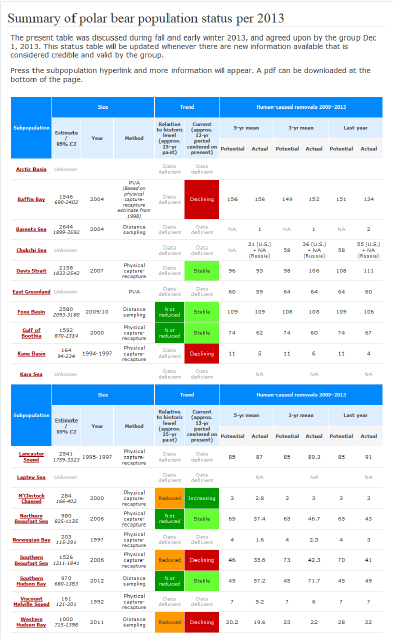
Changes in population estimates from the 2010 PBSG status table
Subpopulations (4 in total) whose estimates have declined relative to the 2010 updated status table (the number displayed in the first column):
Baffin Bay: from 2074 (1544-2604) to 1546 (690-2402) [appears to be based on reworking the same numbers, not an actual decline of 528]
Barents Sea: from 2650 (1900-3600) to 2644 (1899-3592)
Laptev Sea: from 800-1200 to 0 (“unknown”) – [why now, not back in 2009? they don’t say]
Northern Beaufort Sea: from 1202 (686-1718) to 980 (825-1135)
[see background here]
The total of negative difference above: 1,756
Subpopulations (5 in total) whose estimates have increased relative to the 2010 updated status table (the number displayed in the first column):
Foxe Basin: from 2197 (1677-2717) to 2580 (2093-3180) [based on the 2009/10 aerial survey]
Southern Hudson Bay: from 900-1000 to 970 (680-1383) [based on 2012 survey]
Western Hudson Bay: from 935 (791-1079) to 1000 (715-1398) [based on the 2011 aerial survey]
Norwegian Bay: from 190 (102-278) to 203 (115-291)
Davis Strait: from 2142 (1811-2534) to 2158 (1833-2542)
The total of positive differences above: 497
Overall though, there has not been a significant change [I’m not counting here the 2,650-5,700 bears they removed without adjustment from the totals between 2001 and 2005] More later, once I’ve had more time to think about it.

The 19 polar bear subpopulations currently defined by the IUCN Polar Bear Specialist Group (PBSG), with a few extra labels added (as presented, left, and rotated 90 degrees, right. SB, Southern Beaufort; NB, Northern Beaufort; VM, Viscount Melville; MC, M’Clintock Channel; LS, Lancaster Sound; GB, Gulf of Boothia; NW, Norwegian Bay; KB, Kane Basin; WH, Western Hudson Bay. Courtesy the PBSG. Click to enlarge.


You must be logged in to post a comment.