
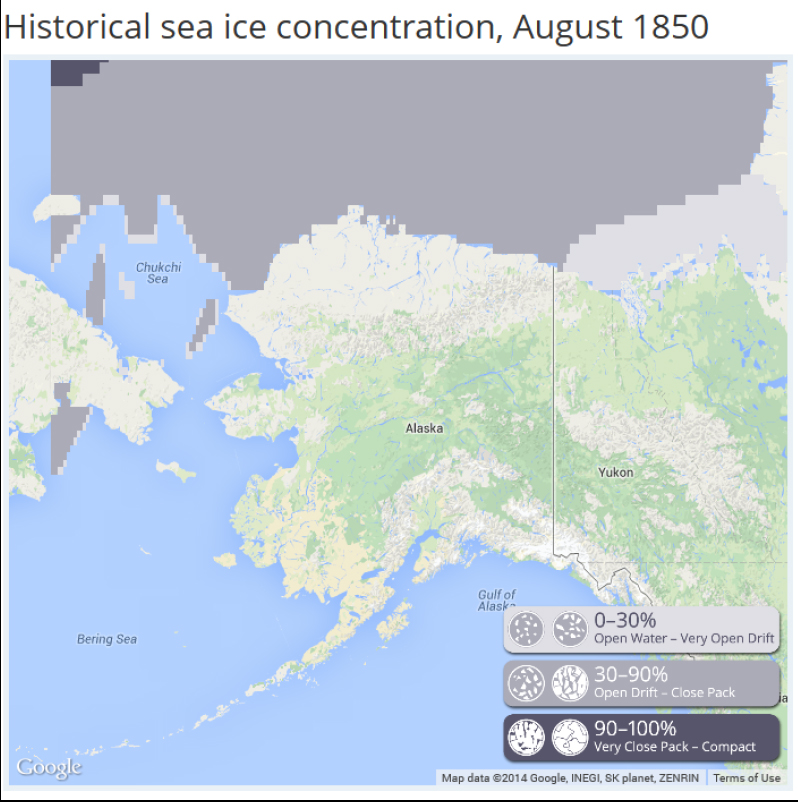
It’s here – as promised and right on schedule — the sea ice atlas put together by University of Alaska Fairbanks (UAF) now has ice concentration maps for Alaska going back to 1850 — and for every year up to 2013.
Several examples are included below: August 1850 vs August 1870, and April 1850 vs. April 1920 and April 2012.
For background, see my post announcing the site preview, which was then limited to 1953-2012 data, when it became available in late January.


You must be logged in to post a comment.