
NOAA’s list of purported evidence for harm being caused to polar bears by Arctic warming is short and weak. It puts the gloomiest spin possible on the current well-being of an animal with all the earmarks of a healthy, well-distributed species.

This year, polar bears are virtually the only species that NOAA mentions in their Arctic Report Card – they’ve put all their icon-eggs in one leaky basket [what happened to walrus??]. But polar bears are doing so well that to make an alarming case for polar bears as victims of Arctic warming, many important caveats had to be left out or misrepresented. Some details given are simply wrong.
This year’s polar bear chapter was penned by IUCN Polar Bear Specialist Group chairman Dag Vongraven (you might recall his email to me earlier this year) and a polar bear conservation activist from Polar Bears International (whose battle cry for donations is “Save Our Sea Ice!”), Geoff York.
I challenge their four weak talking points one by one below.
Point 1. “A decline in survival of female polar bears of all age classes, from 1194 to 806, between 1987 and 2011 in western Hudson Bay was due to earlier sea ice break-up in the spring and later freeze-up in the autumn.”
This astonishingly misleading statement about polar bear numbers has little resemblance to the conclusions of the study that produced the most recent counts (Lunn et al. 2013).
Figure 8 from this report, copied below, shows the real story.
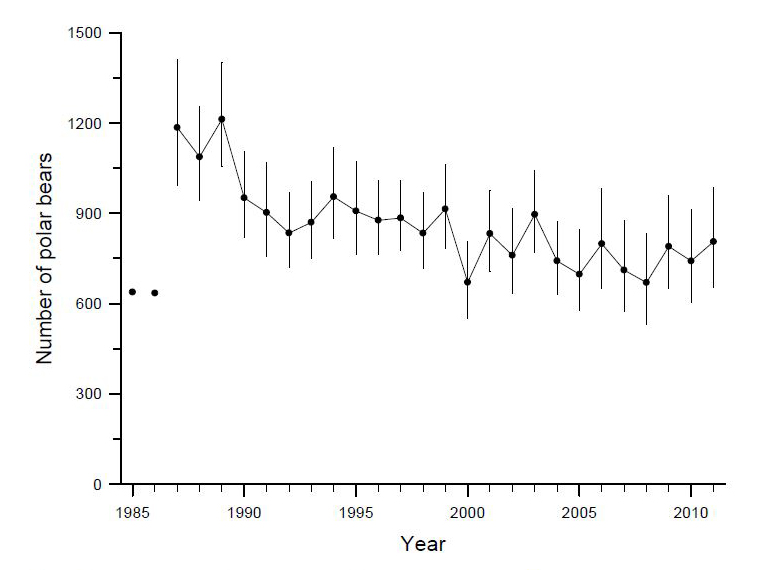
Figure 8 from Lunn et al. (2013) report on W. Hudson Bay polar bear population.
First of all, it is apparent from the graph above that the most noticeable drop in polar bear numbers in Western Hudson Bay occurred back in 1990, which had the second-earliest breakup date since 1979.
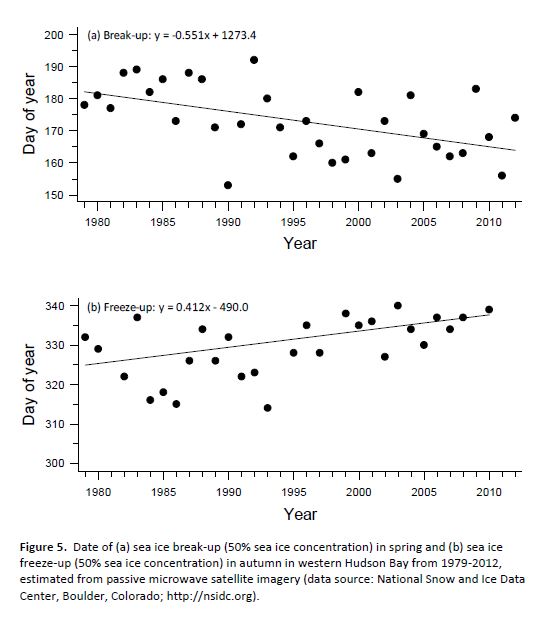
See Fig. 5 from the report copied below for breakup and freeze-up date changes over time, which oddly uses the old criteria for defining breakup and freeze-up, not the new method said to best describe conditions relevant to polar bears. What is almost more striking than the slight trend for each, is the year-to-year variability.
 Lunn et al. stated in their Western Hudson Bay polar bear report:
“Although the current estimate of abundance in 2011 is lower than the estimate of 935 (95% CI =794-1076) for the year 2004 from Regehr et al. (2007), comparison of these numbers is not valid.” [my bold]
They instead calculated a new estimate for 2004 using the same method they used for 2011 and came up with these figures: 2004 – 742 (range 630-872) and 2011 – 806 (653-984). The two estimates are not statistically different, indicating no change (and definitely no decline) since the last estimate was calculated a decade ago.
That’s certainly not the impression anyone would get from the “Report Card” statement quoted above. The trend of the Western Hudson Bay polar bear population is now considered ‘likely stable’ by Environment Canada, although the IUCN Polar Bear Specialist Group insists on keeping its assessment of “declining.” Go figure.
Point 2. “In 2010, polar bear numbers in the southern Beaufort Sea appeared to stabilize at 900 bears following a period of low survival during 2004-2006 that led to a 25-50% decline in abundance. However, survival of sub-adult bears declined during the entire period.”
The only way the mark-recapture study referred to in the above statement (Bromaghin et al. 2014, in press) got the results it did was because the authors failed to include the last two years of available data – they truncated the study at 2010, while data collection continued until 2013. It’s a real work of obfuscation and it’s not surprising to see it given prominence in this report.
The only new data these authors collected came from 2007 through 2010 (details here), which were added to numbers from previous studies. The authors knew before starting their field work in 2007 that a population decline had taken place just before (2004-2006). They also knew why the numbers had dropped and that previous declines (caused by similar conditions) had been followed by a full recovery.
The decline in population was caused by thick spring ice in spring, a recurring phenomenon unique to this region that has always, as far as is known, been followed by a full recovery in population numbers. The authors looked for it, but found no correlation between the population decline with reduced summer sea ice.
The authors of this study appear to have deliberately excluded two years of available data in order to create an anomalously low population estimate and an exaggerated declining trend.
This conclusion is supported by a preliminary report published by the US Fish and Wildlife Service in their 2013/2014 Polar Bear Newsletter that their fall aerial survey results showed that by 2012, the population was high compared to previous years. In other words, the population recovered from its earlier decline, a fact which the authors of the paper had to have known.
Point 3. “Polar bear condition and reproductive rates have also declined in the southern Beaufort Sea, unlike in the adjacent Chukchi Sea, immediately to the west, where they have remained stable for 20 years. There are also now twice as many ice-free days in the southern Beaufort Sea as there are in the Chukchi Sea.”
These statements about the Chukchi Sea population gloss right over the fact that PBSG biologists predicted that Chukchi Sea bears would be as severely impacted by the recent loss of summer sea ice as Southern Beaufort bears.
However, once researchers got around to doing a comprehensive study, they found Chukchi polar bears were doing very well indeed, fatness-wise (only Foxe Basin bears were in better condition) and were reproducing well (some triplet litters were captured).
“Bears in the CS exhibited larger body size, good body condition, and high indices of recruitment compared to most other populations measured to date.” (Rode et al. 2014)
Polar bear researchers most assuredly did not expect this result: the two regions are within the same “ecoregions” they defined for their computer models developed to predict the future – they expected variation in responses of polar bears to occur between different ecoregions, not within the same ones.
In reality, the Rode et al. Chukchi Sea study presents strong evidence that the biologists’ predictions of a grim future for polar bears – based on theoretical responses to summer sea ice declines that have already occurred – have been refuted.
Point 4. “Genetic studies indicate that polar bears have been through long and dramatic periods of population decline during the last one million years, and that during periods with little sea ice there have been multiple episodes of interbreeding between polar bears and brown bears.”
Oh dear. Vongraven and York are really grasping at straws with this one and appear not to have read the literature they cite.
One of the most publicized hybridization events documented by genetic studies (Cahill et al. 2013, which Vongraven and York cite) is about brown bears in Southeast Alaska meeting polar bears driven out of the Arctic by the Last Ice Age – in other words, a meeting of bears caused by extremely cold Arctic conditions, not warm ones.
Recent hybridization events between polar bears and tundra grizzlies in the Western Arctic are due to male grizzlies traveling over spring sea ice into polar bear territory – a phenomenon noted as far back as 1885 that occurs when sea ice is at its maximum extent, not when sea ice is low. In fact, polar bear biologist Ian Stirling is on record as saying that hybridization is “definitely not” a sign of climate change.
Conclusion
A graph from the “Sea Ice” chapter of the “Arctic Report Card” (Figure 4.2, copied below) says all you really need to know about changes in polar bear sea ice habitat over the last several decades. IUCN Polar Bear Specialist Group members (and others) focus on the red line — the dramatic decline in summer (September) sea ice.

Sea Ice Figure 4.2 from NOAA’s “Arctic Report Card 2014.” The black line is the one that matters to polar bears.
However, it’s the black line — the very slight decline in spring (March) sea ice — that’s important to polar bears. Spring is their critical feeding period; spring is when the presence of sea ice is crucial to polar bears and spring conditions have changed very little since 1978.
Whatever happens to the sea ice from August to October matters very little to polar bears if they have fed well during the previous spring: their fat reserves will carry them through until the ice reforms in the fall.
The red line above is a red herring — don’t be fooled, the black line is the one that matters to polar bears.
References
Bromaghin, J.F., McDonald, T.L., Stirling, I., Derocher, A.E., Richardson, E.S., Rehehr, E.V., Douglas, D.C., Durner, G.M., Atwood, T. and Amstrup, S.C. 2014 in press. Polar bear population dynamics in the southern Beaufort Sea during a period of sea ice decline. Ecological Applications http://www.esajournals.org/doi/abs/10.1890/14-1129.1 [paywalled]
Brown, Z.W., van Dijken, G.L. and Arrigo, K.R. 2011. A reassessment of primary production and environmental change in the Bering Sea. Journal of Geophysical Research 116:C08014. doi:10.1029/2010JC006766.
Cahill, J.A., Green, R.E., Fulton, T.L., Stiller, M., Jay, F., Ovsyanikov, N., Salamzade, R., St. John, J., Stirling, I., Slatkin, M. and Shapiro, B. 2013. Genomic Evidence for Island Population Conversion Resolves Conflicting Theories of Polar Bear Evolution. PLoS Genetics 9(3): e1003345. doi:10.1371/journal.pgen.1003345 http://www.plosgenetics.org/article/info%3Adoi%2F10.1371%2Fjournal.pgen.1003345
Lunn, N.J., Regehr, E.V., Servanty, S., Converse, S., Richardson, E. and Stirling, I. 2013. Demography and population assessment of polar bears in Western Hudson Bay, Canada. Environment Canada Research Report. 26 November 2013. PDF HERE
Polar Bear News 2013-14. 2013. Polar bear newsletter of the US Fish & Wildlife Service, Anchorage, Alaska. Pdf here.
Rode, K.D., Regehr, E.V., Douglas, D., Durner, G., Derocher, A.E., Thiemann, G.W., and Budge, S. 2014. Variation in the response of an Arctic top predator experiencing habitat loss: feeding and reproductive ecology of two polar bear populations. Global Change Biology 20(1):76-88. http://onlinelibrary.wiley.com/doi/10.1111/gcb.12339/abstract
Stirling, I. and Parkinson, C.L. 2006. Possible effects of climate warming on selected populations of polar bears (Ursus maritimus) in the Canadian Arctic. Arctic 59:261-275. http://arctic.synergiesprairies.ca/arctic/index.php/arctic/issue/view/16. [open access]


You must be logged in to post a comment.