
Sea ice development over Hudson Bay, Hudson Strait, and Davis Strait has been rather unusual this year but what that might mean for polar bears over the coming winter and spring is hard to tell.

Note: The Canadian Ice Service seems to be in the process of updating its sea ice page and graphing features that used to be available weekly on Thursday have not been available until the following week. This means the most recent graphs available are for the week of 11 December (see below).
Does this year’s odd freeze-up pattern (along with strong El Nino conditions, updated here) portend an early breakup of sea ice next summer – or thick ice development over the coming winter and spring? Either would be not the best conditions for Western and Southern Hudson Bay polar bears, so we’ll have to wait and watch to see what happens.
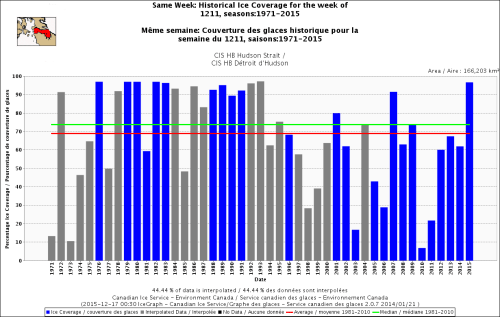
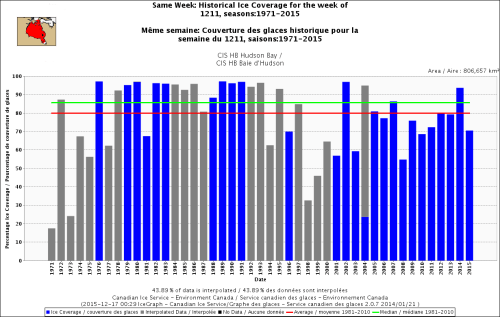
Davis Strait and Hudson Strait ice for the week of 11 December was the highest since 1993 and while Hudson Bay ice is only a bit below average, the pattern of ice freeze-up has been rather unusual (freezing from north to south, rather than west to east). See the graphs and charts below and the comparison to ice development in thick ice years.
Davis Strait, week of 11 December 1971-2015

Hudson Strait, week of 11 December 1971-2015
Hudson Bay, week of 11 December 1971-2015
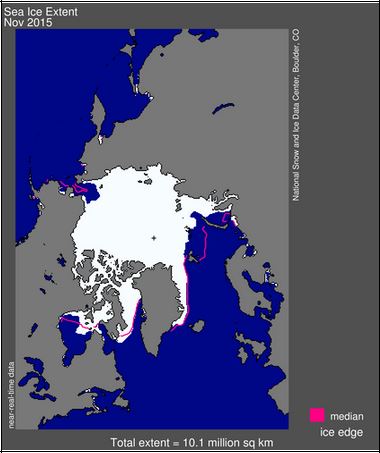
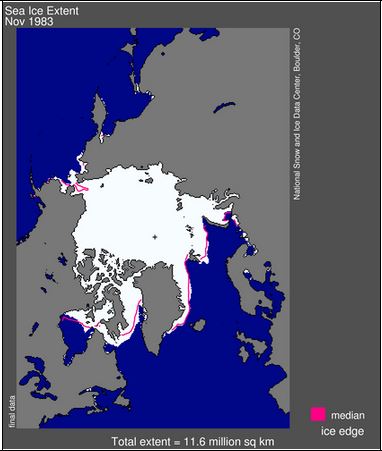
Oddly, freeze-up patterns for the years 1983 and 1992 – known to have been heavy ice years on Hudson Bay (Crockford 2015) – shared some features with ice development this year, at the end of November (see below: 2015, 1983, 1992 from NSIDC):
1) Higher than average ice cover in Foxe Basin.
2) Higher than average ice cover in Davis Strait.

Surprisingly, the current ice chart (15 December 2015, below) looks remarkably similar to the pattern that was present at the end of November 1992, a notoriously heavy ice year in Hudson Bay that had one of the latest breakup years since 1979. At the end of November 1992 there was light ice along the southwest coast and no ice in the southeast but a lot in the north – just as we are seeing this year, although a couple of weeks later.

Just pointing it out – time will tell if it means anything.
Current CIS sea ice map (16 December 2015) below:
See Kelsey Eliasson’s take on this at PolarBearAlley (14 December 2015)
References
Crockford, S.J. 2015. “The Arctic Fallacy: sea ice stability and the polar bear.” GWPF Briefing 16. The Global Warming Policy Foundation, London. Pdf here.


You must be logged in to post a comment.