
Similar to the spin on the 2013 Baffin Bay/Kane Basin polar bear population survey, the IUCN Polar Bear Specialist Group now insists the latest count of the Barents Sea subpopulation is not evidence of an increase in numbers since 2004, as the leader of the study announced in 2015.
This is Part 2 of the big surprises in the latest version of the polar bear status table published by the IUCN Polar Bear Specialist Group (PBSG) on 30 March 2017. See last post here regarding the PBSG population size estimates that no longer concur with the 2015 Red List assessment, including the global total — even though PBSG members wrote the report (Wiig et al. 2015, and its Supplement).
Here I want to focus on the results of subpopulation surveys that were made public after the 2015 Red List assessment was published, particularly the Barents Sea estimate.
While the 2013 Baffin Bay and Kane Basin estimates (SWG 2016) have been added to the new PBSG table, any suggestion that these might indicate population increases are strong discounted. Similarly, contrary to initial reports by the principal investigators of the survey, the PBSG insist that the Barents Sea population has not actually increased since 2004, which you may or many not find convincing.
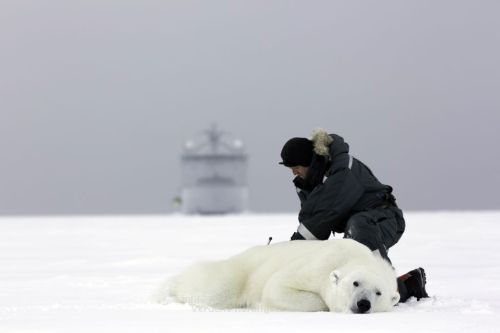
Some of the recent prolonged PBSG discussion about the polar bear status table at their last meeting in 2016 almost certainly involved what to do about the Barents Sea survey conducted in August 2015 by Jon Aars and colleagues at the Norwegian Polar Institute (Svalbard area only, see photo below).
As you’ll recall, Aars issued a press release (pdf here) and told the world his results: that most bears were in excellent condition (“many looked like pigs“) and that they’d recorded a 42% increase in the number of bears counted, which they interpreted as a real and significant increase — and not particularly surprising:
“A rise in the population does not come as a big surprise, as population numbers previously have been low due to the fact that these bears were hunted until 40 years ago, Dr. Aars added.”
But here is what local reporters (NTB: News in English from Norway, published 23 December 2015), who were able to contact him for an interview (pdf here), had to say:
“Researchers from Norsk Polarinstitutt in Tromsø have conducted their first census of sorts since 2004 regarding the polar bear population on Svalbard and in the Norwegian portions of the Barents Sea. “The population has increased,” project leader Jon Aars of the polar institute told NTB. “The Norwegian polar bear population is now calculated to include around 975 bears, compared to 685 11 years ago.”
Aars stressed that there’s a degree of uncertainty in the numbers, but he thinks the researchers have the necessary basis to claim that there’s been an increase in the total.
He also said the polar bears spotted and counted were in “good shape.” He said the ice “came early in the fall of 2014 and lasted a long time.” That means a lot for the bears, he noted.
Ice conditions in the Barents have been poor in most years since 2000, and researchers have been extremely worried about the state of the polar bear population. “It’s positive to see that the polar bears have managed well, under conditions that have been worse for several years,” Aars told NTB.” [my emphasis]
This is how I described the current size of the Barents Sea subpopulation (Crockford 2017), noting that such an increase was expected by Norwegian researchers:
“…a recent update to the Wiig et al. (2015) data for BS is now available: according to a press release issued by the government entity that conducted the survey, in 2015 the Svalbard portion of the BS increased by 42% (from 685 to 975, an increase of 290) since a similar count in 2004 (Norwegian Polar Institute 2015), and apparently anticipated despite poor sea ice conditions since 2004 (Fauchald et al. 2014). Applied to the entire region (using the estimate derived by Aars et al. (2009) of 2650) gives a 2015 estimate of about 3749, an increase of 1109. This estimate fits well with the comment by Aars et al. (2009) that in 2004 there were “about three times” (actually 2.87) as many bears in the Russian sector than in Svalbard and thus, using the Svalbard figure of 975 generates an estimate of about 3773 for the entire region.”
While my calculations may have generated a slightly inflated estimate, it is not an implausible total under the circumstances. I used this number not to insist that a significant increase had taken place but that a significant decline had not occurred.
Below is what the 2017 PBSG assessment says about the Barents Sea survey. We’ll probably never know how much pressure was applied to the Norwegians to make their study results conform to the objectives of the PBSG, which now dismiss the 42% increase in Svalbard numbers as within the confidence limits of the previous estimate (Aars et al. 2009) of 2,650 (1900-3600):
“A new survey in the Norwegian extent of BS was conducted in August 2015. The ice edge was located beyond an ice-free gap north of the Svalbard Archipelago. The number of bears encountered in Svalbard indicates that there is a local stock of ~200-300 bears (preliminary results), which did not differ much from the number detected in 2004.
The results (J. Aars et al., in prep.) also indicate, in accordance with the results from 2004, that more bears are off-shore in the pack ice in autumn. The total estimated for Norwegian Arctic was just under 1000 bears, considerably higher than the total for the Norwegian side in 2004, but with a confidence interval overlapping with the earlier estimate.
During the new survey, the distribution of bears was clumped along the ice edge with most bears close to the Russian border, but access to the Russian portion of BS, for aerial survey, was not permitted. Because of the overlapping confidence intervals, it cannot be concluded that the BS subpopulation has grown.
It is believed that excess hunting in the area before 1973 led to a population size far below the carrying capacity. Consequently, it could be that the current population size is still lower because of an ongoing decline in, carrying capacity. Thus, it is unclear what the trajectory of the subpopulation will be in near future; we do expect that habitat loss will continue. There have not been any dramatic time trends in reproduction or condition parameters in BS, although poor ice years seem to influence these parameters.”
What if there had been a 42% decline in numbers — would the same contortions of interpretation have been applied to dismiss its significance? I wonder.
References
Aars, J., Marques, T.A., Buckland, S.T., Andersen, M., Belikov, S., Boltunov, A., et al. 2009. Estimating the Barents Sea polar bear subpopulation. Marine Mammal Science 25:35-52.
Crockford, S.J. 2017. Testing the hypothesis that routine sea ice coverage of 3-5 mkm2 results in a greater than 30% decline in population size of polar bears (Ursus maritimus). PeerJ Preprints 2 March 2017. Doi: 10.7287/peerj.preprints.2737v3 Open access. https://doi.org/10.7287/peerj.preprints.2737v3
Fauchald, P., Arneberg, P., Berge, J., Gerland, S., Kovacs, K.M., Reigstad, M. and Sundet, J.H. 2014. An assessment of MOSJ – the state of the marine environment around Svalbard and Jan Mayen. Norwegian Polar Institute Report Series no. 145. Available at http://www.mosj.no/en/documents/
SWG [Scientific Working Group to the Canada-Greenland Joint Commission on Polar Bear]. 2016. Re-Assessment of the Baffin Bay and Kane Basin Polar Bear Subpopulations: Final Report to the Canada-Greenland Joint Commission on Polar Bear. +636 pp. http://www.gov.nu.ca/documents-publications/349
Wiig, Ø., Amstrup, S., Atwood, T., Laidre, K., Lunn, N., Obbard, M., Regehr, E. & Thiemann, G. 2015. Ursus maritimus. The IUCN Red List of Threatened Species 2015: e.T22823A14871490. Published online here; PDF copy of report here;
PDF of supplement here.


You must be logged in to post a comment.