
Is there a mutiny in the works between the IUCN Red List and the IUCN Polar Bear Specialist Group (PBSG) over polar bear population estimates or has there simply been a breach of ethics? What else explains the fact that some of the subpopulation estimates used by the PBSG to support the status of ‘vulnerable’ for the IUCN Red List in 2015 are unacceptable to them in 2017? And why are the PBSG refusing to embrace the Red List global estimate of 22,000-31,000?
The latest version of the IUCN PBSG status table was posted online 30 March 2017 without fanfare or even a note on their home page. It seems the result came from much discussion at their official meeting last summer (June 2016) that they say continued into early March 2017.
PBGS members voted to reject four subpopulation estimates used in the 2015 Red List polar bear status review — even though the inclusion of those numbers was required in order for the Red List status of ‘vulnerable’ to be upheld. The group has also chosen not to update their global population page with the Red List estimate of 22,000-31,000.
And surprise, surprise — now that only one subpopulation out of nineteen worldwide has shown a recent decline, the PBSG have removed the “trend” columns from their summary table for subpopulations.
Welcome to conservation ‘science’ practiced by IUCN polar bear specialists.
Regular readers may recall that the quality control folks at the Red List insisted in 2014 that a status assessment of ‘vulnerable’ based on future risks generated by predictive computer models could only be used if estimates were provided for all subpopulations (as was stated clearly in the minutes of one of the PBSG meetings posted online, read marked excerpt here).
Below find the pertinent quotes regarding concerns raised by the Chairman of the IUCN Standards and Petitions Committee, where the “Bayesian Network (BN) approach” refers to the method used by the US Geological Survey (Amstrup et al. 2007) to support an Endangered Species Act classification of ‘threatened’ for polar bears in 2008 (my bold):
“Four shortcomings of the Bayesian Network (BN) approach (from the standpoint of the work of Amstrup et al. and the Red List requirements were noted. …It was agreed that the Red List Assessment has quantitative requirements which would not be met by current renditions of the BN model.”
…
“We also need reasonable estimates of the size of all subpopulations; we cannot simply say, for example, that for subpopulations where are [sic] estimates are currently poor that in the future these will be 20% lower.” [Pg. 15-16]
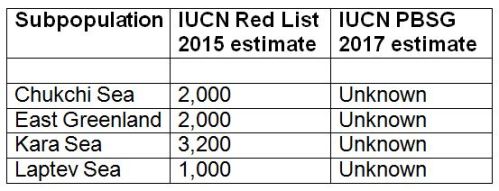
Accordingly, the PBSG members who wrote the Red List assessment report included “reasonable” estimates for the three subpopulations that have never been surveyed (Chukchi Sea, East Greenland, and Laptev Sea) plus a survey result they didn’t especially like for the Kara Sea — and got their Red List determination of ‘vulnerable’ accepted.
However, now that the PBSG have the status result they wanted from the Red List assessment, they have rejected all four of those “reasonable” numbers, including the 2013 Kara Sea estimate that was based on a legitimate survey (described here).
This is not the first time that individual PBSG members have used subpopulation estimates that the group formally decided were ‘unacceptable’ when it suited them to do so. For example, Karyn Rode and colleagues (2014:78) used the Chukchi Sea estimate of ‘2000’ for a comparison of Beaufort Sea bears and sea ice conditions, even though the PGSG had listed the Chukchi Sea population size as “unknown” in 2009 (Obbard et al. 2010).
It follows from the above rejection of these four subpopulation estimates that the PBSG also appears to have rejected the 2015 Red List global population estimate (of course, because the numbers would no longer add up).
A full month after all of the other pages were updated, the “global population size” page remains as it was in July 2014 (after the chairman emailed me to say their estimates were a “qualified guess given to satisfy public demand“). There is still no mention (on this page or anywhere else on the website) of the 2015 IUCN Red List assessment estimate of 22,000-31,000 co-authored by PBSG members Wiig, Amstrup, Atwood, Laidre, Lunn, Obbard, Regehr, and Thiemann (Wiig et al. 2015; see the Supplement, Table 3, for the subpopulation estimates used).
Equally outrageous is that since the Southern Beaufort Sea subpopulation (out of all 19 worldwide) is the only one to have recently documented a decline (Crockford 2017), the new status table no longer contains an assessment of trend (see snapshot of upper half below, full pdf here). Most other subpopulation are stable or increasing, including Baffin Bay and Kane Basin (in 2014, Baffin Bay was the only other population thought to be declining), although several are still ‘data deficient’.

Compare the above to the 2014 table snapshot below with the trend column entries marked prominently (full pdf here) and an option to download the status table.

[Note that the “status map” page (updated 27 March 2017) does contain trend information for a few select subpopulations]
You will only find the 2014 table here, as there is no archive function on the PBSG status table page — previous versions simply disappear. This means there has been no archive of polar bear status tables since the 2009 meeting report (minutes of meetings since then have been published but those reports do not include the status assessment tables and descriptions as previous reports have done).
The hubris on display here is simply mind-boggling.
The PBSG seems to have planned to get the 2015 Red List assessment of ‘vulnerable’ by any means necessary, even if it meant using subpopulation estimates the group felt were too inaccurate to use for any other purpose.
I’ll have more to say about the PBSG treatment of the Barents Sea survey results in my next post (call it PBSG 2017 update, part 2).
References
Amstrup, S.C., Marcot, B.G. & Douglas, D.C. 2007. Forecasting the rangewide status of polar bears at selected times in the 21st century. US Geological Survey. Reston, Virginia. pdf here.
Crockford, S.J. 2017 V3. Testing the hypothesis that routine sea ice coverage of 3-5 mkm2 results in a greater than 30% decline in population size of polar bears (Ursus maritimus). PeerJ Preprints 2 March 2017. Doi: 10.7287/peerj.preprints.2737v3 Open access. https://doi.org/10.7287/peerj.preprints.2737v3
Obbard, M.E., Theimann, G.W., Peacock, E. and DeBryn, T.D. (eds.) 2010. Polar Bears: Proceedings of the 15th meeting of the Polar Bear Specialists Group IUCN/SSC, 29 June-3 July, 2009, Copenhagen, Denmark. Gland, Switzerland and Cambridge UK, IUCN.
Rode, K.D., Regehr, E.V., Douglas, D., Durner, G., Derocher, A.E., Thiemann, G.W., and Budge, S. 2014. Variation in the response of an Arctic top predator experiencing habitat loss: feeding and reproductive ecology of two polar bear populations. Global Change Biology 20(1):76-88. http://onlinelibrary.wiley.com/doi/10.1111/gcb.12339/abstract
Wiig, Ø., Amstrup, S., Atwood, T., Laidre, K., Lunn, N., Obbard, M., Regehr, E. & Thiemann, G. 2015. Ursus maritimus. The IUCN Red List of Threatened Species 2015: e.T22823A14871490. Published online here; PDF copy of report here;
PDF of supplement here.


You must be logged in to post a comment.