Tag Archives: Southern Beaufort

Guest post: How ‘science’ counts bears

This essay by Dr. Jim Steele, professor emeritus, San Francisco State University, is reblogged from a July 3 2013 post at WUWT post, with Dr. Steele’s permission. I am not a field biologist and have never done a mark-recapture study but Dr. Steele has. His perspective on the way polar bear biologists count bears and estimate survival in the Southern Beaufort is a perfect companion to yesterday’s post, a related post that I’ll put up later this week, and this one from December, among others. I’ve added links to the references cited in this essay where they are available, as is my custom. See the original post for Jim’s responses to comments and questions.

———————————————————————
Guest post by Jim Steele   “How ‘science’ counts bears”

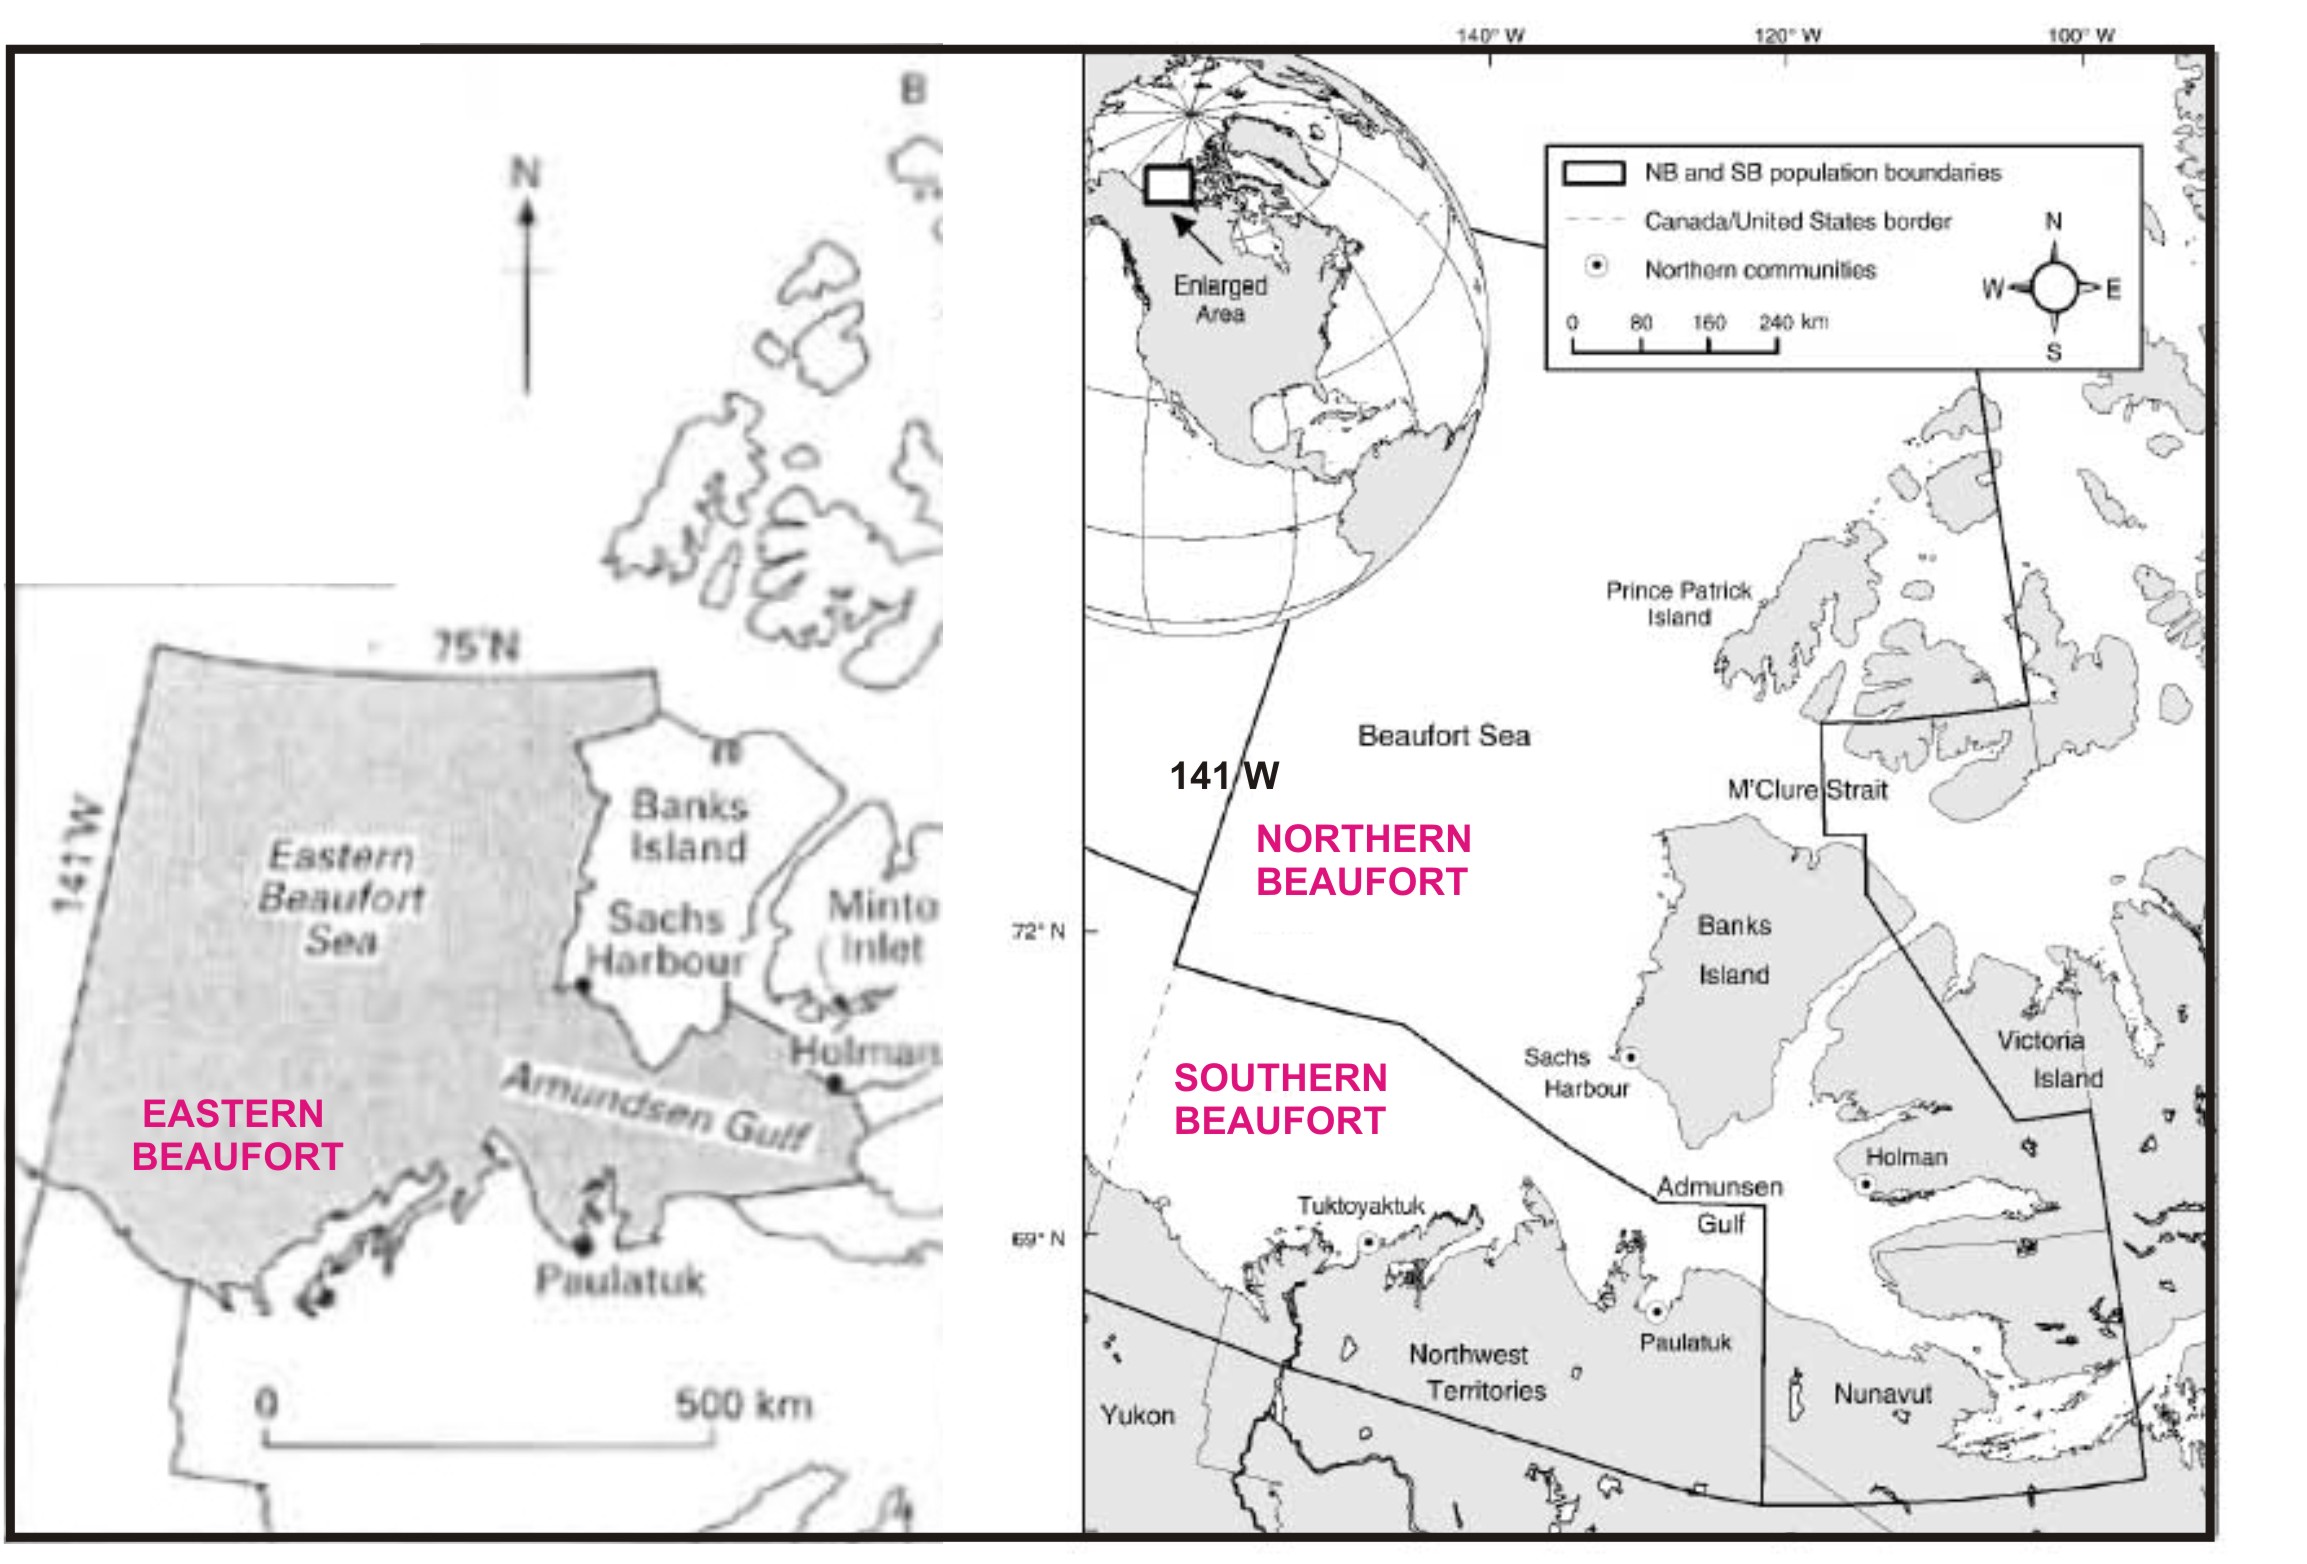
The Inuit claim “it is the time of the most polar bears.” By synthesizing their community’s observations they have demonstrated a greater accuracy counting Bowhead whales and polar bears than the models of credentialed scientists. To estimate correctly, it takes a village. In contrast the “mark and recapture” study, which claimed the polar bears along South Beaufort Sea were victims of catastrophic global warming and threatened with extinction, relied on the subjective decisions of a handful of modelers.

In mark and recapture studies, the estimate of population abundance is skewed by the estimate of survival. For example, acknowledging the great uncertainty in his calculations of survival, in his earlier studies polar beat expert Steven Amstrup reported three different population estimates for bears along the South Beaufort Sea. If he assumed the adult bears had an 82% chance of surviving into the next year, the models calculated there were 1301 bears. If survivorship was 88%, the abundance climbed to 1776 bears. If he estimated survivorship at a more robust 94%, then polar bear abundance climbed to 2490.1 Thus depending on estimated survival rates, a mark-and-recapture study may conclude that the population has doubled, or that it has suddenly crashed.

Here are the simplified basics of estimating survival.

Continue reading

Did polar bear numbers in E. Beaufort fluctuate each decade due to thick ice years?

Now that we have a plausible explanation (previous post here) for why shorefast ice in the Eastern Beaufort got too thick for ringed seals every ten years or so, it’s time to talk about the effect that this recurring sea ice phenomenon might have had on polar bear population numbers.

We know from the reports of polar bear biologists that without fat young seals to eat in the spring, some bears in those thick-ice springs came close to starving and many mothers lost all or most of their cubs (Amstrup et al. 2006; Stirling 2002; Stirling and Lunn 1997; Stirling et al. 1980; Stirling et al. 2008). This presumably had some impact on population numbers – the question is: how bad was it?

None of the reports on the effects of the thick ice have given us any indication of how many polar bears might have died or lost their cubs. However, Ian Stirling and colleagues (Stirling et al. 2011) recently published a paper on the Northern Beaufort subpopulation that looked, at first glance, to have done just that.

You have to keep in mind that the geographic area in question – the Eastern Beaufort – is not an official polar bear subpopulation region – at least, not any more. As Fig. 1 below shows, the Eastern Beaufort was once its own, strictly Canadian region (or at least, a strictly Canadian research region) see previous post here), but management is now shared between two subpopulations and managed by two governments (Canada and the USA). About half of the bears of the “Eastern Beaufort” reside in the ‘Northern Beaufort’ subpopulation and the other half live in the ‘Southern Beaufort’ subpopulation.

Figure 1. Re-jigging of polar bear subpopulations now splits what used to be an entirely Canadian segment, called the “Eastern Beaufort” (map on the left, from Stirling and Lunn 1997), into “Southern Beaufort” (shared with the USA) and “Northern Beaufort,” with the Canada-USA border at 141 W (map on the right, from Stirling et al. 2011). Labels added for clarity. Most of the polar bears sampled for the Stirling et al. paper were captured along the west and south coasts of Banks Island, although a few were captured north of Banks Island in M’Clure Strait and in Amundsen Gulf to the southeast.

Figure 1. Re-jigging of polar bear subpopulations now splits what used to be an entirely a Canadian research segment, called the “Eastern Beaufort” (map on the left, from Stirling and Lunn 1997), into management regions called “Southern Beaufort” (shared with the USA) and “Northern Beaufort,” with the Canada-USA border at 141 W (map on the right, from Stirling et al. 2011, Fig. 1). Labels added. Most of the polar bears sampled for the Stirling et al. paper were captured along the west and south coasts of Banks Island, although a few were captured in M’Clure Strait and in Amundsen Gulf.

Despite the changing boundaries, ringed seals and polar bears in the Eastern Beaufort have been the focus of research since the early 1970s. In part, this is because the region has been targeted for oil exploration and studies on both species have been part of the associated ecological impact assessments (Stirling et al. 1993).

Getting back to the point, did Stirling et al. 2011 find fluctuations in polar bear numbers in the Northern Beaufort that might reflect the periodic bouts of thick spring ice in the Eastern Beaufort? Unfortunately, no — the data lack necessary precision. You’ll see why, I think, from the summary below.  Continue reading

The 32,000 population estimate for polar bears is not an error due to counting overlapping territories twice

UPDATE FEBRUARY 19, 2014The misleading “State of the Polar Bear” graphic is now GONE (as of January 31, 2014). A new 2013 status table is offered by the PBSG here. It has detailed text explanations and harvest information, with references, hyperlinked to each subpopulation entry (“Press the subpopulation hyperlink and more information will appear“) and may have replaced the “State of the Polar Bear” graphic that the PBSG commissioned for upwards of US$50,000, although the PBSG website says it is being “updated” [A pdf copy of the 2013 colour table is here, and my commentary on it is here.] I have left the original post as is, below.

[UPDATE April 1, 2013: see updates here and here ]

This is a brief follow-up to my last post.

I got an email from a reader suggesting that the high numbers for the world’s polar bear population, as given by the Polar Bear Specialist Group (PBSG) on their website in their State of the Polar Bear (SoPB) summary feature – as tallied by nation (22,600-32,000) – may simply be an error resulting from counting overlapping territories twice (i.e. where a subpopulation with one population estimate is shared by two nations, the total amount has been attributed to each nation, rather than giving each of them half of the total).

That is not the case and I’ll tell you why.

If you haven’t yet seen the last post, pop back and have a look – it’s short.

Then note the following:
1) Re: the numbers given for Russia (given as 2,700-4,800 in SoPB-by-nation). Russia has three subpopulations of polar bears: Chukchi (shared with the USA), Kara Sea and Laptev Sea. See previous post here on these estimates by the PBSG.

Chukchi officially has a population of zero because it has never been surveyed. The same is true for the Kara Sea: its population is officially zero and always has been. The Laptev Sea is given a tentative estimate of 800-1,200 in most subpopulation estimates but on the “State of the Polar Bear” summary, it is given as zero. Thus, at the very most, the total for Russia could be 800-1,200.

Conclusion: the estimate of 2,700-4,800 for the Chukchi Sea is not a result of an overlap in count. It’s a new number and there is no information given about where it comes from (it’s remotely possible that the SoPB-by-nation number comes from a recent survey of the Chukchi Sea, see previous post here, but that number has not been made public and the study results have not yet been published).

2) Re: numbers for the USA (given as 1,200-1,800 in SoPB-by-nation). The US has two subpopulations: Southern Beaufort (which it shares with Canada) and the Chukchi Sea (which it shares with Russia). The number usually given for the Southern Beaufort is 1,200-1,800 – so the US share is something like 600-900. While the US shares the Chukchi population with Russia, the Chukchi has never been surveyed – its population is officially zero (half of zero is still zero).

Conclusion: if there has been any “doubling up” going on, it is here. The official (documented) number for the US should be about 600-900.

3) Re: numbers for Greenland (given as 3,500-4,400 in SoPB-by-nation). East Greenland has never been surveyed and the official estimate for that subpopulation is zero. West Greenland comprises three polar bear subpopulations that it shares with Canada: Baffin Bay (total count 1,544-2,604), Davis Strait (total count 1,811-2,534) and Kane Basin (total count 94-234). That comes to 3,449-5,372. Conclusion: if there had been a “doubling” of shared population numbers, the number for Greenland should have been listed in the SoPB-by-nation map as 3,449-5,372 (not 3,500-4,400).

The estimate for the world’s polar bear population, as given by the Polar Bear Specialist Group (PBSG) on their website in their State of the Polar Bear summary feature – as tallied by nation (22,600-32,000) – is not simply an error resulting from counting overlapping territories twice.

Cooling the polar bear spin

I’ve had quite enough of the obfuscation of facts and model-based extrapolations into the future with regards to polar bears. I’m pretty sure I’m not the only one who is interested in what polar bears are doing now and, as much as can be determined, get some understanding of what the biological, geological and evolutionary history of polar bears and their habitat looks like. Spare us the emotional media hype, icon-peddling and fear-mongering about the future — we’d just like some information about the bears!

Polar bears at the Stanley Park Zoo, Vancouver, taken with my first camera in the early 1970s.

I’ve been looking at the scientific literature produced by polar bear and Arctic seal biologists for some time and I’ve found it contains some rather interesting and potentially important facts that are being left out, glossed over, or misrepresented in statements and publications generated by polar bear advocates of all kinds. It’s past time for these issues to be brought to light and publicized in one easily-accessible, up-datable forum. Hence, PolarBearScience.com — a new blog in which I discuss the science of polar bears while throwing cold water on some of the spin. Continue reading