Tag Archives: State of the Polar Bear

State of the Polar Bear Report 2018: Polar bears continue to thrive

Press Release 27 February 2019, International Polar Bear Day

New Report: Polar Bears Continue To Thrive

State PB 2018 cover 27 Feb 2019

Inuit paying the price of rising bear populations

The State of the Polar Bear Report for 2018, published today by the Global Warming Policy Foundation, confirms that polar bears are continuing to thrive, despite recent reductions in sea ice levels. This finding contradicts claims by environmentalists and some scientists that falls in sea ice would wipe out bear populations.

The report’s author, zoologist Dr Susan Crockford, says that there is now very little evidence to support the idea that the polar bear is threatened with extinction by climate change.

We now know that polar bears are very resourceful creatures. They have made it through warm periods in the past and they seem to be taking the current warming in their stride too”.

In fact, it is the human residents of the Arctic who seem to have most to worry about. With more and more bears on the landscape at all times of year, there have been worrying reports of people being threatened, mauled and even killed, particularly from Nunavut, in the Canadian north.

As Dr Crockford explains,

The people of Nunavut are not seeing starving, desperate bears – quite the opposite. Yet polar bear specialists are saying these bears are causing problems because they don’t have enough sea ice to feed properly. The facts on the ground make their claims look silly, including the abundance of fat bears. Residents are pushing their government for a management policy that makes protection of human life the priority.

UPDATE: Read my opinion piece in Canada’s Financial Post here.

Key findings [Read the whole thing here]

· Data published since 2017 show that global polar bear numbers have continued to increase slightly since 2005, despite the fact that summer sea ice in 2018 was again at a low level not expected until mid-century: the predicted 67% decline in polar bear numbers did not occur.

· Despite marked declines in summer sea ice, Chukchi Sea polar bears continue to thrive: reports from the first population-size estimate for the region, performed in 2016, show bears in the region are abundant (almost 3000 individuals), healthy and reproducing well.

· National Geographic received such a profound backlash from its widely viewed ‘this is what climate change looks like ’ starving polar bear video, released in late 2017, that in 2018 it made a formal public apology for spreading misinformation.

· In Canada, where perhaps two-thirds of the world’s polar bears live, the Committee on the Status of Endangered Wildlife (COSEWIC) decided in 2018 to continue to list the polar bear as a species of ‘Special concern’ rather than upgrade to ‘Threatened.’

· Polar bear attacks made headlines in 2018: two fatal attacks in Nunavut, Canada and a narrowly averted death-by-mauling in northern Svalbard caught the world by surprise.

Citation: Crockford, S.J. 2019. State of the Polar Bear Report 2018. Global Warming Policy Foundation Report 32, London.


Amstrup & colleages can’t refute my critique of their 2007 polar bear survival model, Part 1

It’s been more than a year since I first published my scientific manuscript at PeerJ Preprints (a legitimate scientific forum) on the failure of Amstrup’s 2007 USGS polar bear survival model (Crockford 2017), a year waiting in vain for the polar bear community to comment. They either couldn’t be bothered or knew they couldn’t refute it – I haven’t known for sure which. But I do now.

Beaufort Sea male polar bear USGS_2005 Amstrup photo

Polar bear specialists didn’t comment because they couldn’t refute it in the scholarly manner required by PeerJ: all they could do is tear it down with derision, misdirection and strawman arguments.

I know this because the damage control team for the polar-bears-are-all-going-to-die-unless-we-stop-using-fossil-fuels message wasn’t activated over my fully-referenced State of the Polar Bear Report for 2017 (Crockford 2018) released on International Polar Bear Day last month, but for a widely-read opinion piece I’d written for the Financial Post published the same day (based on the Report) that generated three follow-up radio interviews.

By choosing to respond to my op-ed rather than the Report or my 2017 paper, biologists Andrew Derocher and Steven Amstrup, on behalf of their polar bear specialist colleagues1, display a perverse desire to control the public narrative rather than ensure sound science prevails. Their scientifically weak “analysis” of my op-ed (2 March 2018), published by Climate Feedback (self-proclaimed “fact checkers”), attempts damage control for their message and makes attacks on my integrity. However, a scientific refutation of the premise of my 2017 paper, or The State of the Polar Bear Report 2017, it is not (Crockford 2017, 2018).

Derocher further embarrasses himself by repeating the ridiculous claim that global polar bear population estimates were never meant for scientific use, then reiterates the message with added emphasis on twitter:

Derocher tweet 2018 Feb 28 quote

Just as the badly written Harvey et al. (2017) Bioscience paper said more about the naked desperation of the authors than it did about me or my fellow bloggers, this attempt by the polar bear community’s loudest bulldogs to discredit me and my work reveals their frustration at being unable to refute my scientifically supported conclusion that Amstrup’s 2007 polar bear survival model has failed miserably (Crockford 2017).

Part 1 of my detailed, fully referenced responses to their “analysis” of my op-ed are below.  Part 2 to follow [here]. Continue reading

Histrionics over Arctic temperatures & sea ice extent: implications for polar bears

Panic over Arctic temperatures got smeared across news networks last week, so I think a bit of perspective is in order, including an assessment of what this means for polar bears and their prey (because some of the hysteria is being amplified from that corner).

The region causing all the kerfuffle is at the northernmost tip of Greenland (see map below), where there is a weather station at Cape Morris Jesup. Next-nearest stations are at Alert, Canada (to the west) and Longyearbyen, Svalbard (Norway, to the east).

Cape Morris Jesup location Greenland_Google map

Arctic temps spike over 30 degrees in the midst of winter (The Weathern Network, Friday, February 23, 2018) included the tweet below, showing a fracture of sea ice north of Greenland so transient that it does not show up on daily sea ice maps:

“Along with those spikes in temperature, Lars Kaleschke’s tweet, above, also shows the large rift in the sea ice that opened up just north of Cape Morris Jesup, at the same time. Kaleschke is a professor of sea ice remote sensing at the Center for Earth System Research and Sustainability, at the University of Hamburg, in Germany.

Summary: Temperature and sea ice “abberations” in northern Greenland are transient phenomena that have clearly happened before (e.g. 2011) without major consequences except perhaps through impacts on eastern Arctic and subArctic weather conditions (including the UK).

Lack of sea ice north of Svalbard in the Barents Sea occuried last year and in 2012 in Februrary. But by mid-to-late March, when seal are beginning to give birth on the ice and polar bears are busy hunting them, ice had again covered the region. This year is likely to be the same. However, we won’t know until the end of March or ealry April if a recovery will or won’t happen, so any alarm-ringing about impacts on Arctic fauna surival have no foundation in fact until then.

East Greenland Scorsby Sound March 2011 on Kap Tobin_Rune Dietz_press photo

Scorsby Sound, East Greenland bear in March 2011. Rune Dietz, press photo.

In the Bering Sea, ice extent is well below average for this time of year but studies show the one consistent feature of Bering Sea ice is its variability. Low ice levels have distressing impacts for St. Lawrence island seal and whale hunters. However, there is certainly enough ice in the Bering Sea/Chukchi Sea region for polar bears and Arctic seals to do what they do this time of year (which is try to survive until early April, at which time seals start giving birth to their pups and polar bears start to eat them, with gusto). And the ice season isn’t over: maximum extent of ice in the Bering sea doesn’t usually come until late April or May, and the dramatic decline of mid-February already shows signs of reversing.

Details below this ice map for 24 February 2018, courtesy NSIDC Masie:

masie_all_zoom_4km 2018 Feb 24

PS. I’m off within hours to Toronto for the launch of my State of the Polar Bear Report in honour of International Polar Bear Day, 27 February. Watch for reports in the news and for my op-ed 27 February at the Financial Post.

Continue reading

Misleading “State of the Polar Bear” graphic cost advocate scientists more than US$50,000

UPDATE FEBRUARY 19, 2014The misleading “State of the Polar Bear” graphic is now GONE (as of January 31, 2014). A new 2013 status table is offered by the PBSG here. It has detailed text explanations and harvest information, with references, hyperlinked to each subpopulation entry (“Press the subpopulation hyperlink and more information will appear“) and may have replaced the “State of the Polar Bear” graphic that the PBSG commissioned for upwards of US$50,000, although the PBSG website says it is being “updated [A pdf copy of the 2013 colour table is here, and my commentary on it is here.] I have left the original post as is, below.

I’ve had some time to do a little digging regarding the IUCN Polar Bear Specialist Group (PBSG) State of the Polar Bear web graphic. It turns out this fancy but misleading document was designed by a US company called Periscopic (Portland, Oregon) at a cost of US$50, 000-70,000. So apparently, rather than put $70,000 towards much-needed polar bear research, the PBSG chose to use the money to tell people, in a slightly different way, that it thinks polar bears are doomed. [see UPDATE: April 1 2013]

Just to refresh your memory, last month I pointed out that this fancy summary “tool,” which sits prominently on the home page of the PBSG website, suggests that there are now 22,600-32,000 polar bears worldwide, when tallied by nation (when you add up the individual population estimates provided on each of the two maps on this web “tool” (without clicking through to more detail), you get two different numbers that have no resemblance to the “official” estimate of 20,000-25,000: the page “Nations” gives totals by country that add up to 22,600-32,000 and the numbers given on the “Subpopulations” page (when you hover your mouse over each of the 19 regions) add up to only 13,036 – a far cry from 20,000-25,000 official estimate).

A few days later, I got a response to the email I’d sent to Norwegian polar bear biologist Dag Vongraven, who said it was his job to supervise work on this summary. But, he said, he had “not yet had time to review all details in it as well as I should.” So it seems that without a careful review of the final product, the graphic was posted on the home page of the PBSG website (sometime in October 2012).

It turns out there had been a discussion at the 2009 PBSG meeting, documented in its official report (Obbard et al. 2010:11, Fig. 1 below), about their intention to hire Periscopic as part of on-going PBSG website developments supervised by Vongraven. Several PBSG members agreed this would be a good idea and offered to help by providing data. Continue reading

Update: Polar bear population now 22,600-32,000 – when tallied by nation

UPDATE FEBRUARY 19, 2014The misleading “State of the Polar Bear” graphic is now GONE (as of January 31, 2014). A new 2013 status table is offered by the PBSG here. It has detailed text explanations and harvest information, with references, hyperlinked to each subpopulation entry (“Press the subpopulation hyperlink and more information will appear“) and may have replaced the “State of the Polar Bear” graphic that the PBSG commissioned for upwards of US$50,000, although the PBSG website says it is being “updated” [A pdf copy of the 2013 colour table is here, and my commentary on it is here.] I have left the original post as is, below.

[See followup posts here and here (April 1)]

Two days ago, I got a short note from PBSG chairman and website manager Dag Vongraven of the Norwegian Polar Institute, Tromso. He was responding to an email I sent him earlier this week asking about the apparent increase in global polar bear numbers when tallied by nation as depicted in the “State of the Polar Bear” dynamic “tool” featured on the Polar Bear Specialist Group (PBSG) website, which I discussed in a previous post here. The tally by nation in that PBSG document suggests that the world population estimate for polar bears is 22,600-32,000 – far higher than the 20,000-25,000 “official” estimate.

Apparently, this tool was developed by a US-based web company under Vongraven’s supervision. But, he says, he has “not yet had time to review all details in it as well as I should.So, without a careful final review, the document was posted on the front page of the PBSG website, where it has been featured for several months.

The “tool” consists of three maps – that’s it. They are titled Subpopulations, Nations, and Ecoregions. I previously discussed the population totals by Nation, but when I went back and looked at the Subpopulation numbers, I realized they are very odd as well.

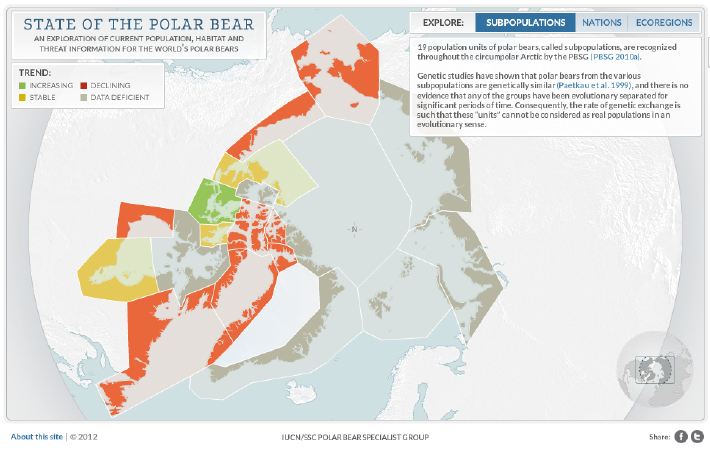
The total population estimate listed on the Subpopulation map add up to just 13,036 – not even close to the 20,000-25,000 “official” estimate. The map (see screen cap below) gives no number (estimate = 0) for the following subpopulations, all of which have an official estimate (see previous post here, estimates from the 2009 PBSG report in square brackets): Foxe Basin [2,197], Viscount Melville [161], Laptev Sea [800-12,00] and Barents Sea [2,650]. On the map below, all of the regions coloured grey have no estimate provided (estimate = 0). In addition, there is no estimate provided for the Chukchi Sea subpopulation, coloured orange in this map, as per the official estimate [you can’t see the numbers given in this screen cap because they only show up when you hover your mouse over the region].

So when you add up the individual estimates provided on each of the two maps on this web tool, you get two different numbers that have no resemblance to the “official” estimate of 20,000-25,000.

"Subpopulation" status, from the Polar Bear Specialist Group special tool, "The State of the Polar Bear." downloaded January 17, 2013

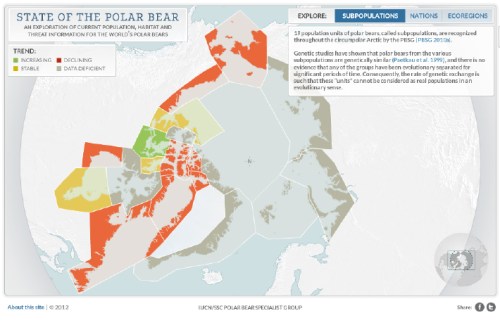
“Subpopulation” status map, from the Polar Bear Specialist Group dynamic web tool, “The State of the Polar Bear.” [downloaded January 17, 2013]. Population estimates for each region show up on the original web-based tool when you hover your mouse over the map. All of the regions coloured grey, as well as one of the orange-coloured regions (Chukchi Sea, centre top), do not have a number provided.

 Vongraven says he is recovering from surgery and so it may be awhile until someone takes a look to see what’s up with this tool. He did not seem overly concerned about it. But he assured me that the official polar bear estimate of 20,000-25,000 has not changed, although it may after the next population review at the PBSG meeting later this year.

The point is this: if you were a high school student or a teacher looking for a simple and authoritative summary on the status of the polar bear, this tool would look very attractive. The IUCN/SSC Polar Bear Specialist Group want us to consider them the ‘premiere’ experts on polar bear numbers worldwide but these maps do not accurately summarize the current state of knowledge about global polar bear population numbers. The maps are misleading and confusing. We may never know who’s bright idea this was but I in my opinion, it’s a dud.

[the “State of the Polar Bear” tool was still up on the PBSG website, in its original state, the last time I looked]