
The issue of polar bear population density (# of bears per 1000 km2) came up a few posts ago, during my discussion of the new Davis Strait population study by Lily Peacock and colleagues (here). Since the various polar bear subpopulations across the Arctic are so different in size, calculating the density of bears in the various regions generates an interesting metric of how well the regional populations are doing relative to each other.
Almost 20 years ago, Taylor and Lee (1995) did just that: they determined the density of polar bears in the various Canadian subpopulations, as of the 1990s. Surprisingly, the ‘leader’ among those, by a wide margin, was one of the smallest in geographic area: the Gulf of Boothia. Located in the central Canadian Arctic (see Figs. 1 and 2 below), in the 1990s, tiny Gulf of Boothia supported a density of 10.4 polar bears per 1000 km2, the highest density of all regions examined.
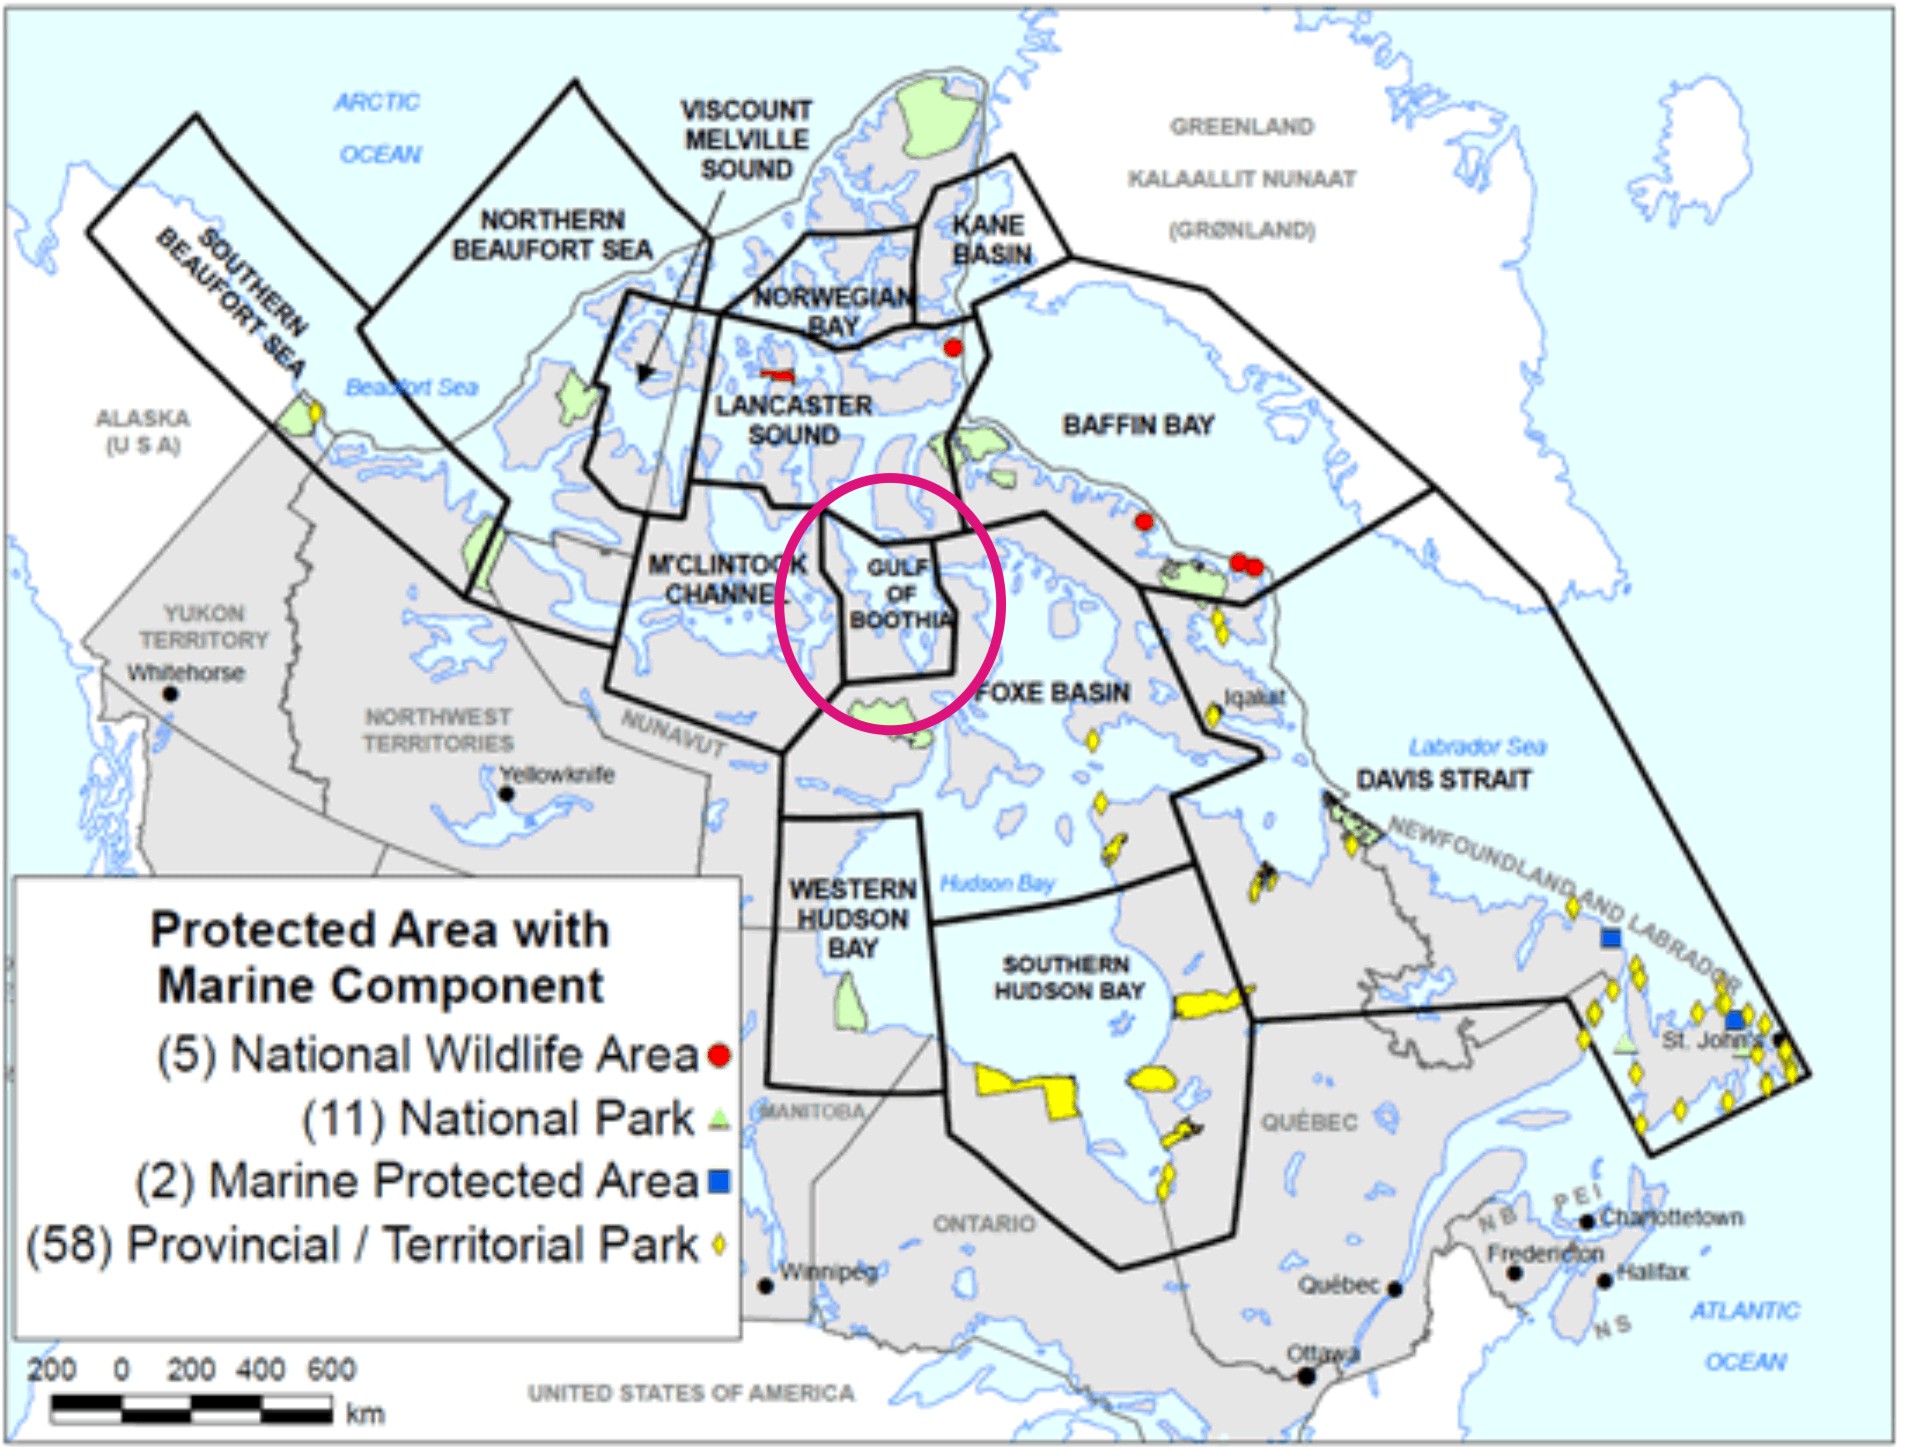
Figure 1. The Gulf of Boothia (circled) is right in the middle of the Canadian Arctic. In terms of geographic area, it is one of the smallest of all 19 subpopulations worldwide: at only 170,000 km2, only the Norwegian Bay and Kane Basin subpopulation regions, also in Canada (just to the north of Gulf of Boothia), are smaller at 150,000 and 155,000 km2 respectively (Vongraven and Peacock 2011). The Gulf of Boothia supports the highest density of polar bears known. Modified from the map of polar bear protected areas provided by Environment Canada.
But this density value for Gulf of Boothia was based on the 1986 population estimate of 900 bears – what is the most current figure?
For that, we need an updated population assessment. That was done in 2000 and it generated an estimate of 1,592 ± 361 bears (Taylor et al. 2009).
Taylor et al. (2009:791) said this about their assessment:
“Our results suggest population size had increased steadily under a harvest regimen of approximately 40 bears/yr” and added, “Barber and Iacozza (2004) found no trends in Gulf of Boothia sea ice conditions or ringed seal habitat suitability indices in the interval 1980-2000.”
In other words, despite there being no trend in either sea ice conditions or habitat for seals – and a yearly harvest of 40 bears – polar bear numbers in the Gulf of Boothia increased significantly (by almost 700 bears) during the twenty years between 1980 and 2000. Even if the 1986 estimate of approximately 900 bears was somewhat less accurate than the more recent one, the fact that tiny Gulf of Boothia can support 1,592 bears is surely a remarkable feat.
Using this new population estimate and the same area of ‘available habitat’ used by Taylor and Lee in 1995, I calculated the most recent density at a spectacular 18.3 bears per 1000 km2! [note this is exactly what Peacock et al (2013) did to get their density value of 5.1 bears/1000 km2, discussed here.] But I didn’t update just Gulf of Boothia, I did them all.
The updated density values for Gulf of Boothia and several other Canadian subpopulations are listed in Table 1 below. Note that aside from Davis Strait, as far as I know these density figures have not been published elsewhere: you’re seeing them here for the first time.
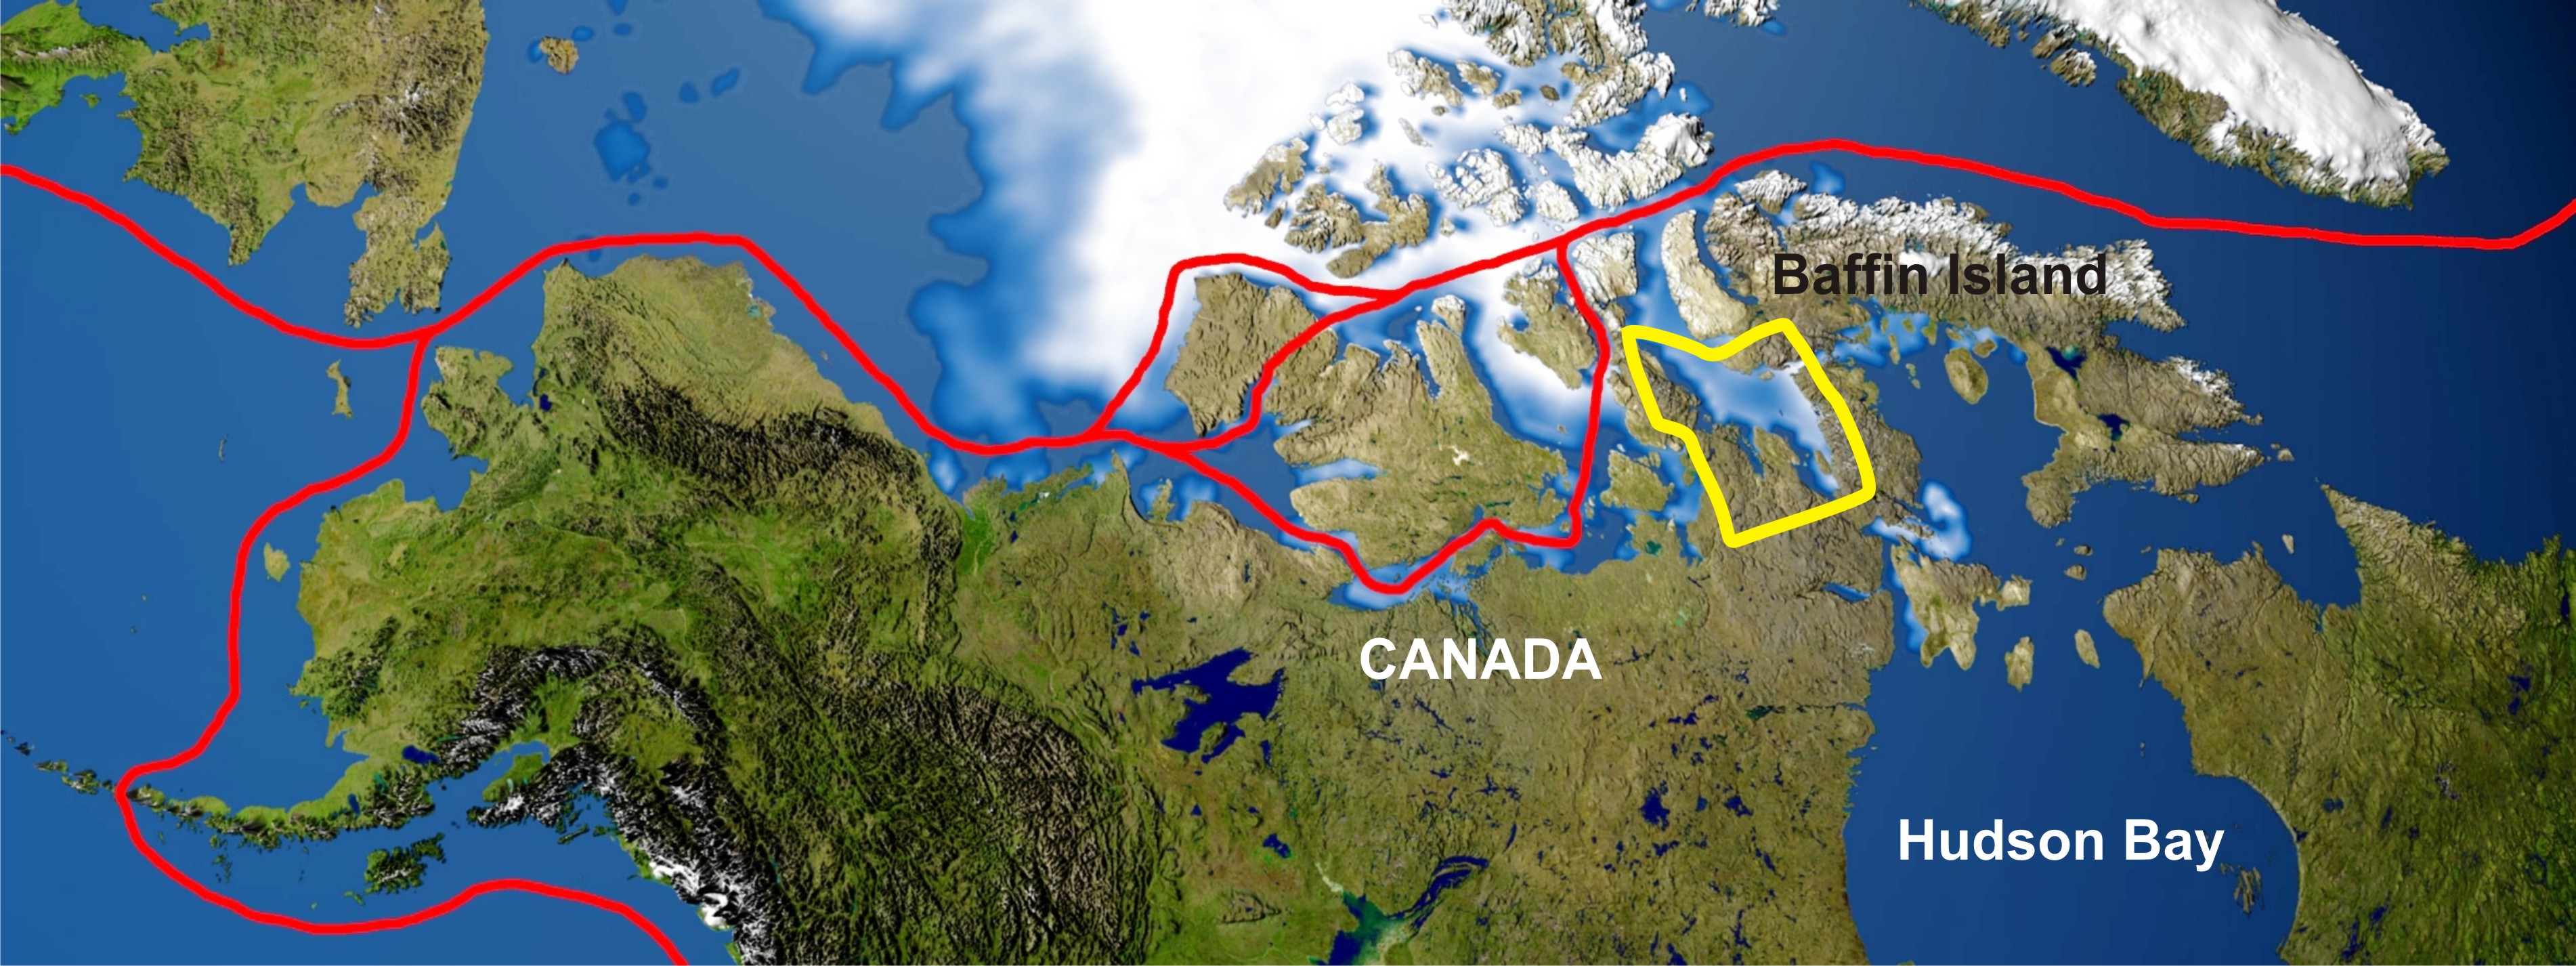
Figure 2. This perspective shows the approximate location of the Gulf of Boothia (outlined in yellow) in relation to primary Northwest Passage routes, in what is presumably mid-to-late summer (showing areas where sea ice lingers some or all years). Modified from map provided by Wikipedia here.
Take a look at Table 1 (download as a PDF here). Because the boundaries of some regions have changed since the 1990s, some of the Canadian regions that Taylor and Lee analyzed had to be left out of this upgrade. Still, there are enough remaining subpopulations to get a sense of the variation among them.
![Table 1. Polar bear subpopulation density comparison, using current abundance estimates. Current polar bear abundance numbers from Vongraven & Peacock (2011), area estimates of available sea ice habitat (in spring) and 1995 abundance estimates from Taylor and Lee (1995), and ice type classification is from Durner et al. (2009). Abundance estimates and densities at 1995 are in [square brackets]; Hudson Bay figures are regional totals, as per Taylor and Lee (1995).](https://polarbearscience.com/wp-content/uploads/2013/06/pb-density-table-1_jun-15-2013_polarbearscience.jpg)
Table 1. Polar bear subpopulation density comparison, using current abundance estimates. Current polar bear abundance numbers from Vongraven & Peacock (2011), area estimates of available sea ice habitat (in spring) and 1995 abundance estimates from Taylor and Lee (1995), and ice type classification is from Durner et al. (2009). Abundance estimates and densities at 1995 are in [square brackets]; Hudson Bay figures are regional totals, as per Taylor and Lee.
In the conclusions of their 1990s density comparison paper, Taylor and Lee (1995) stated:
“Populations occurring in areas of mixed annual and multi-annual ice appear to support higher densities than areas that do not contain multi-year ice.”
Is this true? Do areas with multiyear ice have higher densities?
Note the difference, for example, between M’Clintock Channel and Gulf of Boothia, which are geographically side-by-side and part of the same ‘ecoregion’ in the central Canadian Arctic that have significant amounts of multiyear ice (more on this in a later post). M’Clintock Channel has only 1.9 bears per 1000 km2 (the lowest density), while the Gulf of Boothia has 18.3 bears per 1000 km2 (the highest density).
However, the recent low density in M’Clintock Channel appears to reflect a substantial population decline due to overhunting between 1972 and 2000, as discussed by Taylor et al. (2006):the population there declined from about 750 bears to about 300 bears over this period.
OK, let’s leave M’Clintock Channel out of the comparison. Even so, there is a still a huge difference between the subpopulation with the next-highest density (Northern Beaufort, 6.5) and the highest density (Gulf of Boothia, 18.3), yet both have multiyear ice.
So, while two out of the top three density values are found in areas with multiyear ice (as Taylor and Lee suggested), one of the lowest density regions (Viscount Melville) is also a multiyear ice region.
In the end, it is not clear to me that the presence of a mix of annual and multiyear ice by itself explains why Gulf of Boothia polar bears are doing so well, because they are not just doing better, they are thriving head-and-shoulders above any other subpopulation in the world1.
And it does seem rather odd to me that despite the density of polar bears in the Gulf of Boothia being the highest documented worldwide by a wide margin, no one seems to be asking why this central Canadian region is such an Arctic utopia.
1. Footnote: Regarding Table 1, note that Taylor and Lee (1995) only calculated available spring sea ice habitat area for Canadian and Canadian-shared territories, so there are no comparable figures available for calculating the density of other Arctic regions. However, among those not included by Taylor and Lee, only the Barents Sea has an abundance estimate that could be used for determining a density value. The Barents Sea is a ‘divergent ice’ region, designated *† in the above table, as is the Southern Beaufort (Durner et al. 2009). If only 1/3 of its total area of 1,690.0 1000 km2 was deemed ‘available sea ice habitat’ (my best guess) and given its estimated polar bear population of 2,650 (Vongraven and Peacock 2011), the Barents Sea would have a polar bear density of around 4.7 bears/1000 km2 – lower than the Southern Beaufort (6.0), which is also a ‘divergent ice’ region – and closer to polar bear density in the Davis Strait (5.1, see also Peacock et al. 2013). However, while the calculation of a detailed, truly comparable ‘available spring sea ice habitat’ area for the Barents Sea (rather than my rough guess) might give a slightly different number, I can’t see it being anywhere close to the Gulf of Boothia figure.
References
Barber, D.G. and Iacozza, J. 2004. Historical analysis of sea ice conditions in M’Clintock channel and the Gulf of Boothia, Nunavut: implications for ringed seal and polar bear habitat. Arctic 57:1-14. http://onlinelibrary.wiley.com/doi/10.1111/j.1748-7692.2009.00302.x/abstract
Durner, G.M., Douglas, D.C., Nielson, R.,M., Amstrup, S.C., McDonald, T.L., Stirling, I., Mauritzen, M., Born, E.W., Wiig, Ø., DeWeaver, E., Serreze, M.C., Belikov, S.E., Holland, M.M., Maslanik, J., Aars, J., Bailey, D.A., and Derocher, A.E. 2009. Predicting 21st-century polar bear habitat distribution from global climate models. Ecological Monographs 79:25-58.
Peacock, E., Taylor, M.K., Laake, J., and Stirling, I. 2013. Population ecology of polar bears in Davis Strait, Canada and Greenland. Journal of Wildlife Management 77: 463–476. http://onlinelibrary.wiley.com/doi/10.1002/jwmg.489/abstract?deniedAccessCustomisedMessage=&userIsAuthenticated=false
Taylor, M.K., Laake, J., McLoughlin, P.D., Cluff, H.D., and Messier, F. 2006. Demography parameters and harvest-explicit population viability analysis for polar bears in M’Clintock Channel, Nunavut, Canada. Journal of Wildlife Management 70:1667-1673. http://onlinelibrary.wiley.com/doi/10.2193/0022-541X%282006%2970%5B1667:DPAHPV%5D2.0.CO;2/abstract
Taylor, M.K., Laake, J., McLoughlin, P.D., Cluff, H.D., and Messier, F. 2009. Demography and population viability of polar bears in the Gulf of Boothia, Nunavut. Marine Mammal Science 25:778-796. http://onlinelibrary.wiley.com/doi/10.1111/j.1748-7692.2009.00302.x/abstract
Taylor, M., and Lee, J. 1995. Distribution and abundance of Canadian polar bear populations: a management perspective. Arctic 48:147-154. http://arctic.synergiesprairies.ca/arctic/index.php/arctic/article/view/1236/1261
Vongraven, D. and Peacock E. 2011. Development of a pan-Arctic monitoring plan for polar bears: background paper. Circumpolar Biodiversity Monitoring Programme, CAFF Monitoring Series Report No. 1, CAFF International Secretariat, Akureyri, Iceland. Available at http://www.caff.is/publications/


You must be logged in to post a comment.