Tag Archives: multiyear ice

Arctic Report: primary productivity still high & sea ice flatline continues despite warmer temperatures

NOAAs annual Arctic Report Card is, for the most part, a valiant effort to turn good and ambiguous news into harbingers of climate change disaster. Primary productivity is up across most of the region (good news for wildlife) and despite Arctic temperatures being “twice as high” as the rest of the world in recent years, the summer sea ice ‘death spiral’ has failed to materialize.

Oddly, there is no bad news about polar bears (last mention was 2014). However, the media were told that the few hundred sea birds that died this year in the enormous Bering/Chukchi Sea region over the four months of summer in 2022 is a portend of climate change catastrophe–even though the authors of the NOAA report admit they have no conclusive evidence to explain the phenomenon. However, here are also some honest figures that are quite illuminating.

Continue reading

Thick sea ice in the Western Arctic is not good habitat for polar bears, seals, or walrus

A few weeks into the Arctic summer (July-September), sea ice in the Beaufort and Chukchi Seas is dominated by thick, multi-year ice.

At this time of year, multi-year ice is an important refuge habitat for many polar bears when seasonal ice melts out. However, it provides few opportunities for hunting seals. In fact, it is nearly as devoid of food as is the shore during the melt season. Consequently, most polar bears eat little over the summer whether they are on land or on sea ice due to the scarcity of seals.

Continue reading

Good news for polar bears and seals: new study finds multiyear Arctic sea ice is getting thinner

The fact that multiyear sea ice got thinner between 2018 and 2021 as documented by a new study, is ultimately good news for polar bears: less multiyear ice compared to first year ice is better for all marine mammals in the Arctic. Polar bears and seals, for example, are dependent on the seasonal ice that forms every winter (Atwood et al. 2016; Durner et al. 2009). Multiyear ice is simply too thick for any purpose except as a summer refuge for polar bears (for which land will do just as well) and a platform for maternity dens over the winter, for which thick first year ice will often do just as well (Anderson et al. 2012; Rode et al. 2018).

Continue reading

Polar bear researchers try very hard to make good news in Kane Basin sound trivial

In an astonishing display of under-selling good news, the authors of a new paper announcing that Kane Basin polar bears are doing well have avoided mentioning that the population increased substantially since the 1990s and insist that any benefits will be short-lived.

Kane Basin population size at 2013 was 357 (range 221 – 493), up from 224 (range 145 – 303) in 1997. That’s an increase of 59% based on a 2016 recalculation of the 1997 population estimate of 164 (Crockford 2020) – it would have been a 118% increase otherwise.

Money quote: “We find that a small number of the world’s polar bears that live in multiyear ice regions are temporarily benefiting from climate change.” Kristen Laidre, lead author of Transient benefits of climate change for a high‐Arctic polar bear (Ursus maritimus) subpopulation

Both the paper and the press release also claim, despite acknowledging that there is no evidence for this conclusion (“the duration of these benefits is unknown“), that this good news will probably not last because computer models say beneficial conditions might not persist beyond the end of the century.

As always, if you’d like to see this paper, use the ‘contact me’ page to request a copy (it’s paywalled).

UPDATE 25 September 2020: News just out from Nunavut this morning, “New Nunavut polar bear surveys point to “currently healthy” populations in M’Clintock Channel and Boothia Bay.” The survey report for M’Clintock Channel (mentioned in the post below) and neighbouring Gulf of Bothia has still not been made public but this announcement suggests that population numbers in these subpopulations have also increased by some amount that will be similarly discounted as unimportant.

Continued reading

Potential impact of the second-lowest sea ice minimum since 1979 on polar bear survival

The annual summer sea ice minimum in the Arctic has been reached and while the precise extent has not yet been officially determined, it’s clear this will be the ‘second lowest’ minimum (after 2012) since 1979. However, as there is no evidence that polar bears were harmed by the 2012 ‘lowest’ summer sea ice this year’s ‘second-lowest’ is unlikely to have any negative effect.

This is not surprising since even 2nd lowest leaves summer ice coverage in the Arctic at the level sea ice experts wrongly predicted in 2005 wouldn’t be seen until 2050 (ACIA 2005; Amstrup et al. 2007; Wang and Overland 2012) and this is the same amount of summer sea ice that polar bear experts incorrectly predicted would cause 2/3 of all polar bears to disappear. My book explains how it all went wrong: The Polar Bear Catastrophe That Never Happened

In this summary of how polar bears have been doing since the the lowest sea ice minimum in 2012, I show that contrary to all predictions, polar bears have been thriving despite reduced summer ice in the Barents, Chukchi and Southern Beaufort Seas, and because of unexpectedly short ice-free seasons in Hudson Bay and less multiyear ice in the Canadian Arctic Archipelago.

UPDATE 21 September (10:20 PT): NSIDC has just announced the Arctic sea ice extent minimum (preliminary) for 2020 at 3.74 mkm2 reached on 15 September. See full report here.

Continue reading

Unfounded concern for polar bears from onshore oil exploration in Alaska

Canadian biologist Andrew Derocher was called upon to promote his particularly pessimistic viewpoint on polar bear survival in a story published in the New York Times yesterday (2 December 2018: “Drilling in the Arctic: Questions for a Polar Bear Expert”). However, decades of evidence suggests that onshore oil exploration in the Arctic National Wildlife Refuge is unlikely to harm the few female bears that come ashore in Alaska to make maternity dens.

polar bear investigates an oil platform_USFWS photo used Dec 2018

Here is my rebuttal to Derocher’s claims, all of which I’ve dealt with previously.

Continue reading

Heavy ice off East Coast 2017 caused by winds, cold temperatures, and icebergs

Heavy sea ice off Newfoundland and southern Labrador has been an issue for months: it brought record-breaking numbers of polar bear visitors onshore in early March and April and since then has hampered the efforts of fisherman to get out to sea.

Newfoundland fishing boats stuck in ice_DFO_May 26 2017 CBC

Let’s look back in time at how the ice built up, from early January to today, using ice maps and charts I’ve downloaded from the Canadian Ice Service and news reports published over the last few months.

The tour is illuminating because it shows the development of the thick ice over time and shows how strong winds from a May storm combined with an extensive iceberg field contributed to the current situation.

Bottom line: I can only conclude that climate change researcher David Barber was grandstanding today when he told the media that global warming is to blame for Newfoundland’s record thick sea ice conditions this year.  I suspect that because Barber’s expensive research expedition was scuttled, he simply had to find a way to garner media attention for his project — and the media obliged. Read to the end and decide for yourself.

Continue reading

Experts’ vision of an ice-free summer is already wrong & benefitting polar bears

Polar bear populations in most of the Canadian Arctic Archipelago (CAA) must be booming, as they are elsewhere. That’s because the ‘experts’ were even more wrong in their predictions of future sea ice conditions than most people realize: they expected the CAA would remain choked with ice during a ‘nearly ice-free’ summer driven by human-caused global warming.

polar-bear-feeding_shutterstock_sm

Wang and Overland 2012 fig 3b marked

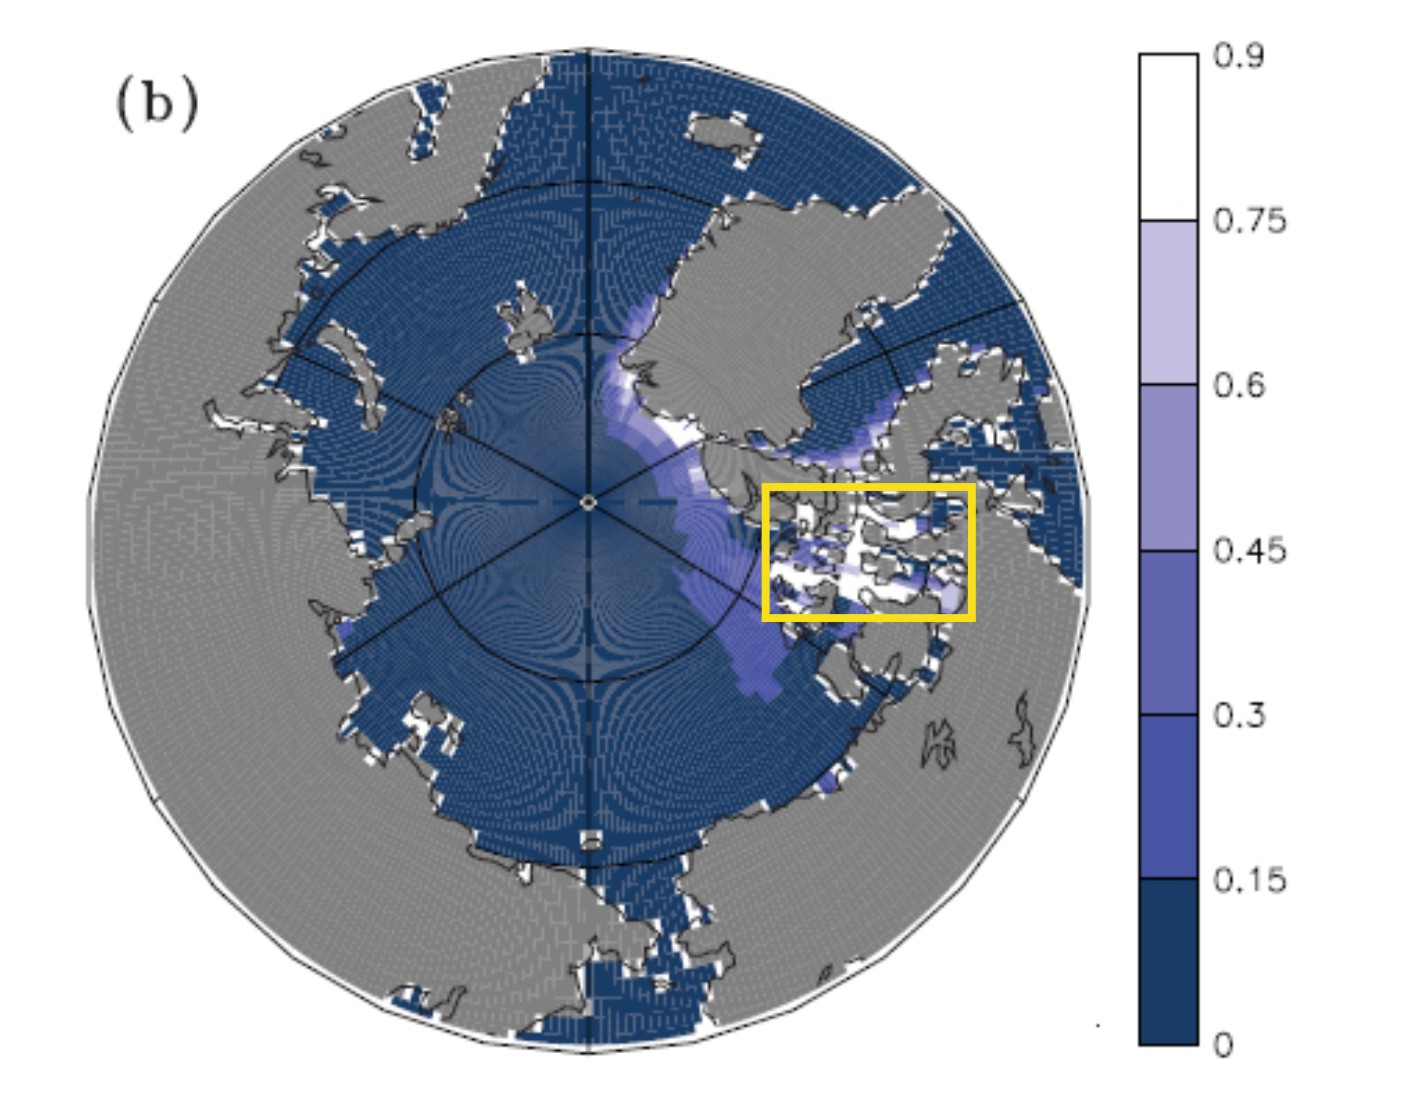
Map presented by Wang and Overland (2012: Fig 3) shows what these experts thought a ‘nearly ice-free’ summer would look like, which they expected to occur by 2030 or so.

Look at the map from Wang and Overland (2012) above, which is what they thought a ‘nearly ice-free’ summer would look like in the year 2030 or so.

Wang and Overland used the same models used by USGS biologists to predict the future survival of polar bears based on habitat loss (Amstrup et al. 2007; Atwood et al. 2016; Durner et al. 2007, 2009). Note the thick ice in the CAA — what USGS experts call the ‘Archipelago’ sea ice ecoregion (denoted by white in the map), indicating ice about 1 metre thick (2-3 feet) — expected to remain at the height of summer in 2030.

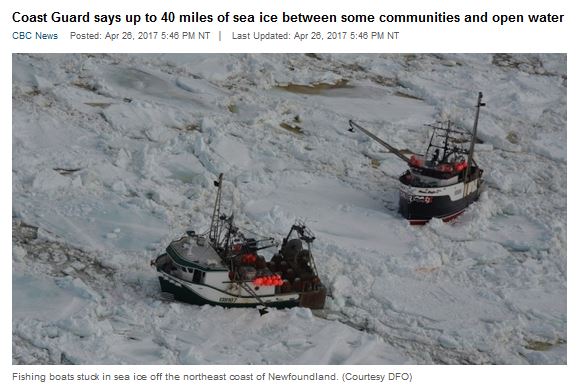
[Earlier renditions of sea ice projections (e.g. ACIA 2005) show something similar. The second update of the ACIA released just yesterday (AMAP 2017, described here by the CBC) has prudently included no such firm predictions in their Summary for Policy Makers, just dire warnings of future catastrophe. But see the 2012 update.]


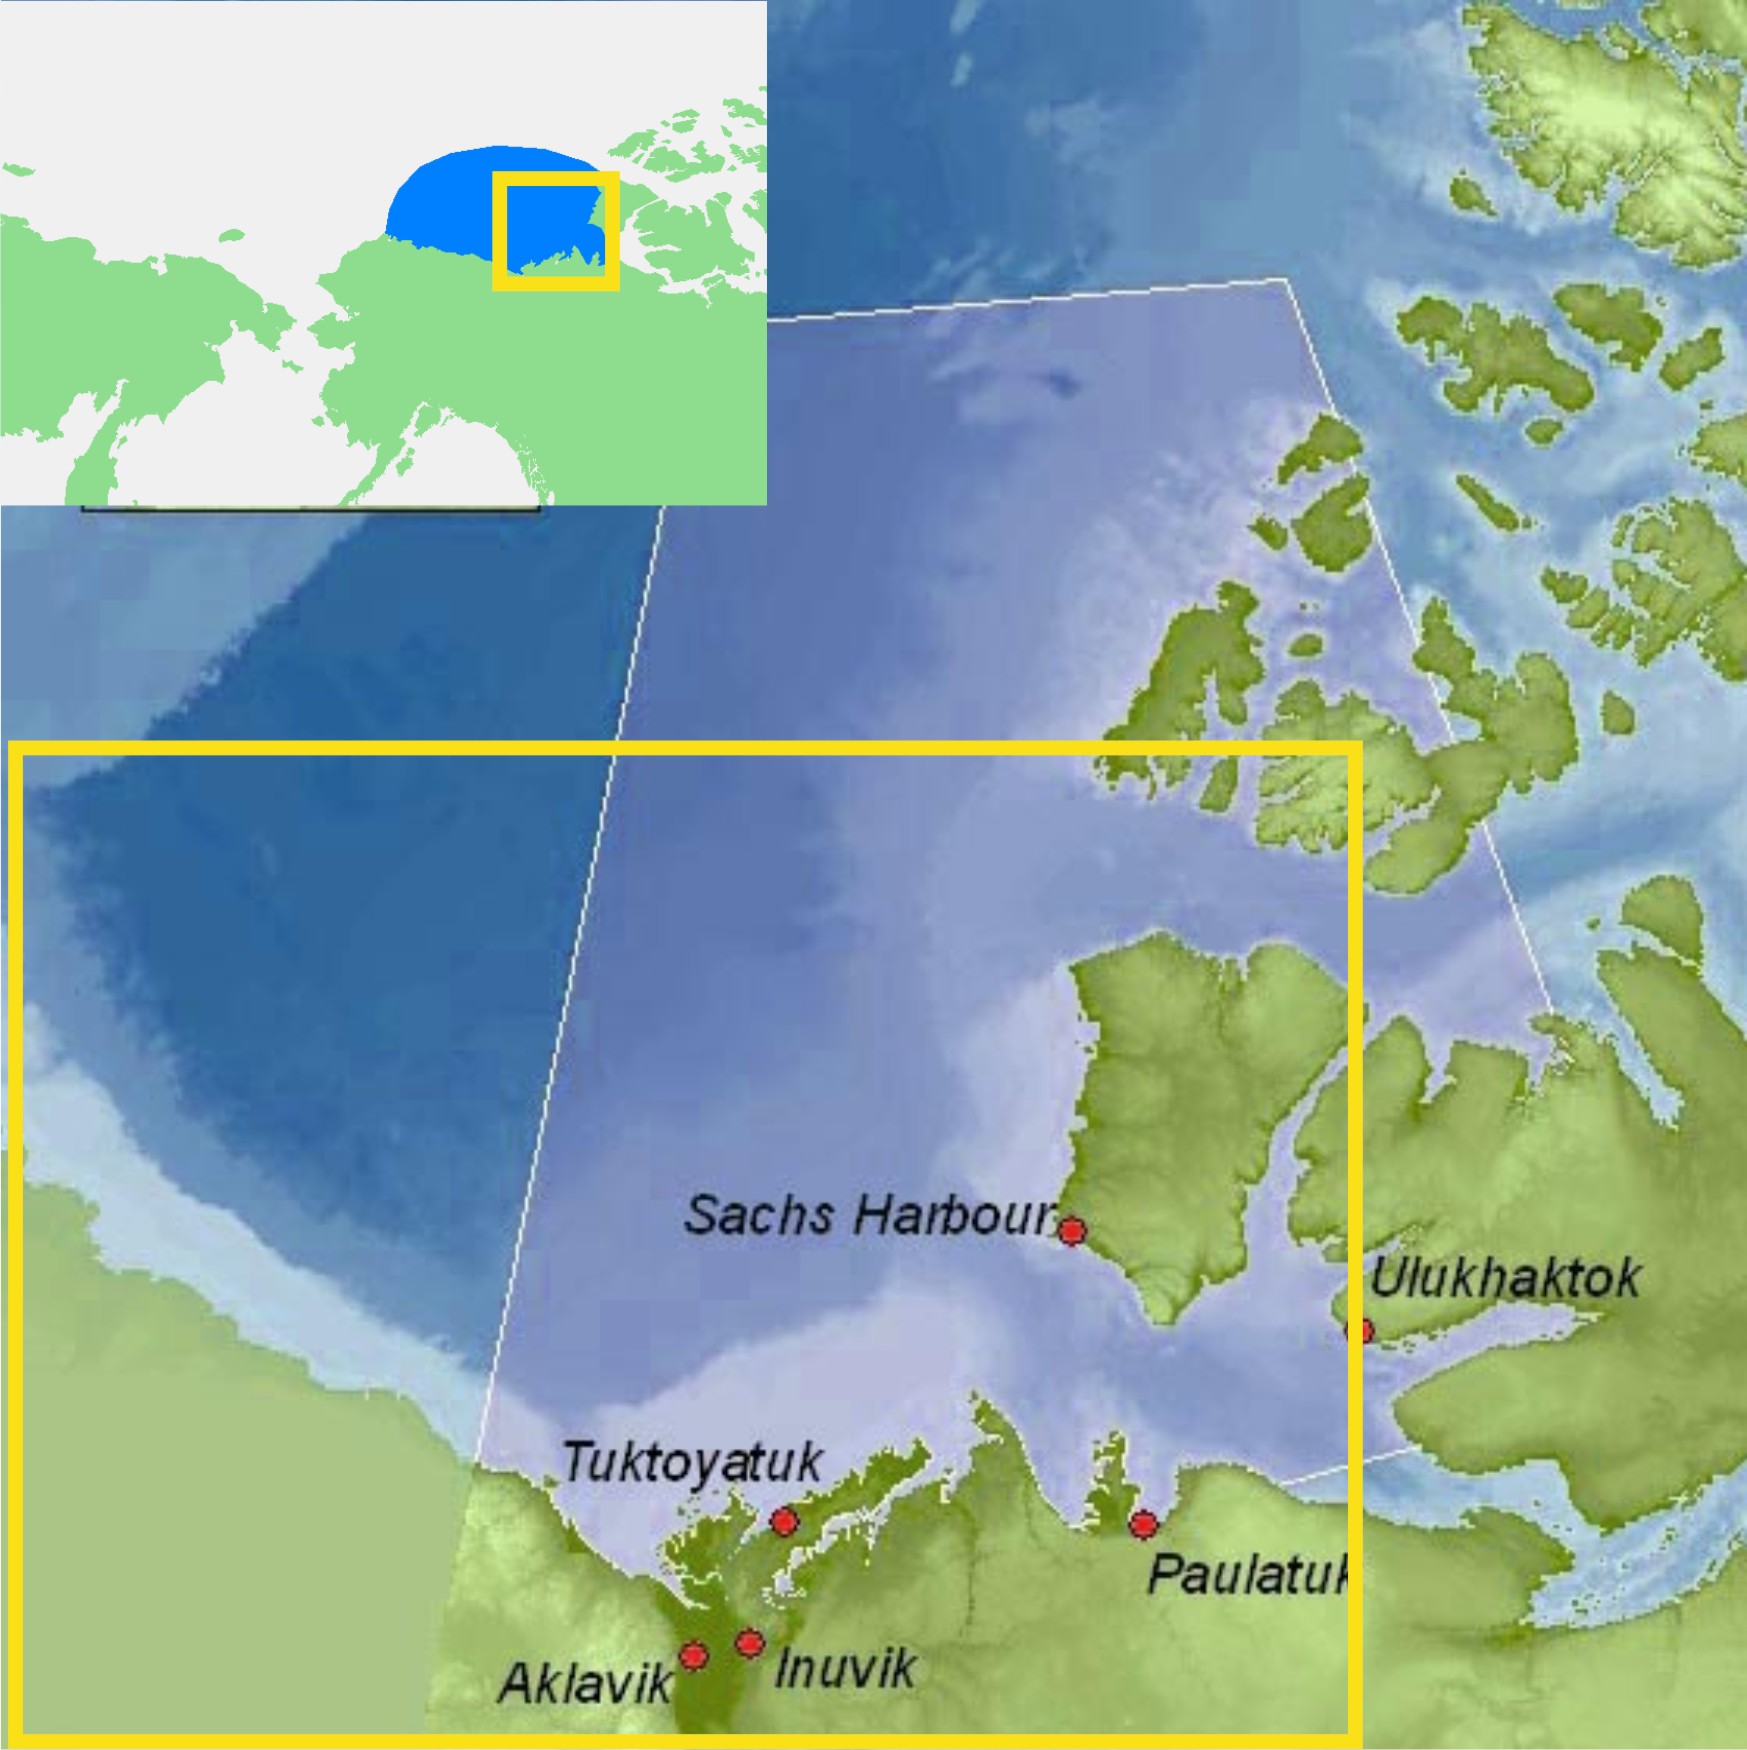
The problem is that ice in this region has been largely absent most summers since 2006, even though overall ice extent has been much more extensive than expected for a ‘nearly ice-free’ summer, as I show below.

This is not another “worse than we thought” moment (Amstrup et al. 2007) — this is sea ice models so wrong as to be useless: failed models used to inform future polar bear survival models that got the bears declared ‘threatened’ with extinction in the US in 2008 (Crockford 2017).

It also means polar bears are almost certainly doing much better than recent population counts indicate, since only one subpopulation out of the six in the CAA has recently been assessed. But since polar bear specialists have consistently underestimated the adaptability of this species and the resilience of the Arctic ecosystem to respond to changing conditions, it’s hard to take any of their hyperbole about the future of polar bears seriously. Continue reading

Why is it that every decade, Eastern Beaufort sea ice gets really thick?

I’ve written before about the incidents of starving polar bears in the eastern portion of the Southern Beaufort Sea (here, here, and here). For two or three years every decade since the 1960s, shorefast ice in the Eastern Beaufort (Fig. 1) has become too thick and compressed in the spring for ringed seals to maintain their breathing holes, so most or all of them presumably go elsewhere — as seals did in Greenland when ice got too thick there (Vibe 1965). With few or no seal pups born during March and April in thick ice years, some bears had a hard time finding enough food: starving bears and dying cubs were the result.

Figure 1. Eastern portion of the southern Beaufort Sea.  The communities of Tuktoyatuk (locally known as ‘Tuk’), and Sachs Harbour on southern Banks Island, have been useful starting points for polar bear research because they are accessible by plane via the larger community of Inuvik The light blue portions, e.g. along western Banks Island and the Eastern Beaufort/Yukon mainland coast, indicate shallow continental shelf areas (20 km wide in places) where extensive shorefast ice develops every winter. Main map from Beaufort Sea Partnership, inset map from Wikipedia.

Figure 1. ‘Eastern Beaufort’ (yellow square) polar bear study region.
The communities of Tuktoyatuk (locally known as ‘Tuk’), and Sachs Harbour on southern Banks Island have been used as base camps for polar bear research because they are accessible by plane via the larger community of Inuvik.
The light blue portions along western Banks Island and the Eastern Beaufort/Yukon mainland coast indicate shallow continental shelf areas (20 km wide in places) where extensive shorefast ice develops every winter.
Main map from Beaufort Sea Partnership, inset map from Wikipedia.

I’ve been trying to get my head around why this would happen in the Eastern Beaufort. Once or twice – maybe – but several times every decade? What on earth drives such a process?

So, I did some reading (actually, quite a lot of reading) and have what appears to be at least a partial answer.

All indications are that the occasional development of exceptionally thick spring ice in the Eastern Beaufort is the result of an entirely natural, cyclical phenomenon. However, some polar bear biologists are attempting to blame the latest episode (but not earlier ones) on increased amounts of open water in the Chukchi Sea during fall of the early 2000s. That doesn’t seem a plausible explanation to me, given the history of the sea ice in this region. Have a look.

Figure 2. Beaufort sea pressure ridges, spring 1949. Courtesy Wikipedia (from NOAA “At the ends of the Earth” image collection #corp1014).

Figure 2. Beaufort sea pressure ridges, spring 1949. Courtesy Wikipedia (from NOAA’s “At the ends of the Earth” image collection #corp1014).

Continue reading

Sea ice, beluga whales, and polar bear densities in the Gulf of Boothia

As I discussed in my last post, the Gulf of Boothia subpopulation in the central Canadian Arctic has the highest density of polar bears anywhere in the world. The question is, why?

For example, is the sea ice in the Gulf of Boothia region so markedly different from its nearest subpopulation-neighbor, M’Clintock Channel (Fig. 1), that it accounts for the wide disparity in polar bear densities between the two? The differences, remember, are dramatic: Gulf of Boothia, 18.3 bears per 1000 km2 vs. M’Clintock Channel, 1.9. And while M’Clintock Channel may be low in part due to recent over-harvests (see footnote 1), even the density before over-harvests occurred in M’Clintock Channel were only 4.7, compared to 10.4 bears per 1000 km2 in Gulf of Boothia (see Table 1 in previous post).

Today, I’ll take a look at sea ice and ringed seal habitat in the Gulf of Boothia and M’Clintock Channel, as well as information from a study on polar bear diets, which together shine some light on why the Gulf of Boothia is such a great place for polar bears.

Figure 1. Map showing the side-by-side relationship of M’Clintock Channel and the Gulf of Boothia. From Barber and Iacozza (2004: Fig. 1).

Figure 1. Map showing the side-by-side relationship of M’Clintock Channel and the Gulf of Boothia. From Barber and Iacozza (2004: Fig. 1).

Continue reading