
Here’s a quick summary of the status of Baffin Bay polar bears, a subpopulation I’ve not previously discussed in detail. Nothing especially earth-shattering here, except perhaps to wonder about the involvement of the World Wildlife Fund (WWF) in a new helicopter survey of the region.
Baffin Bay (Fig. 1) is north of Davis Strait. It lies between western Greenland and Baffin Island in the eastern Arctic.
Unlike the other north/south neighbour-pair of Western/Southern Hudson Bay (which I discussed previously), the sea ice history for Baffin Bay/Davis Strait is not as similar: Davis Strait bears have a much longer on-shore fast than Baffin Bay bears (see last post here). However, all four of these subpopulations have ‘seasonal sea ice’ – that is, the ice melts completely in late mid-to-late summer, forcing bears onshore for varying lengths of time until fall freeze-up.

Figure 1. The Baffin Bay subpopulation region lies north of Davis Strait (map on the left from Vongraven and Peacock 2011: Fig. 3) and management is shared between Canada (Nunavut) and Greenland. In total area, it covers 1.08 million km2 and its “suitable ice habitat in spring” (according to Taylor and Lee 1995) is 413,500 km2, somewhat less than Davis Strait. The map on the right shows the sea ice extent at the end of March 2010 (NSIDC), the winter maximum.
A peer-reviewed paper published last year (Rode et al. 2012) compared body condition vs. sea ice changes in Davis Strait and Baffin Bay (discussed here). But while that research contributed to an updated population estimate for Davis Strait (Peacock et al. 2013, discussed here), it did not do the same for Baffin Bay. This is likely because the body condition work in Baffin Bay was split between spring and fall, and it has already been determined that many Baffin Bay bears are offshore in the spring and not available for counting using shore-based methods.
That’s a shame, because the last population estimate was completed back in 1997 (Taylor et al. 2005) and it is now seriously out of date.
However, it appears the Government of Nunavut is currently in the process of surveying this region by helicopter, so a new population estimate should be available soon.
But this aspect of the survey might surprise you — a press release issued February 11, 2013 by WWF contained the following statement:
“Results from the above-noted surveys will be completed and shared beginning in April 2013.
WWF made contributions of $82,000 to the Government of the Northwest Territories and $111,000 to the Government of Nunavut via Environment Canada, towards the total costs of these surveys. These funds were raised through the Arctic Home campaign from engaged Canadians and matched by The Coca-Cola Company.” [my bold]
So, of the hundreds of millions the WWF pulls in from donations, they passed along less than $100,000 [$96,500 plus an equal contribution by Coca-Cola) to offset “the total costs of the survey.”
We are not told what those total costs are, but I expect they run well over a million dollars for a multiyear/multi-region project like this, perhaps over two million. Which makes $96,500 rather a drop in the bucket. That might have paid for some of the jet fuel for the helicopters used for the survey, but probably not all of it.
Status details below.
Population estimates
An abundance estimate was produced from a survey completed in 1997: at that time 2,074 bears (confidence interval 1544-2604) were thought to live in Baffin Bay; the population was stable or slightly increasing (Taylor et al. 2005). This appears to be the official estimate (Vongraven and Peacock 2011).
However, in 2004, computer model simulations that projected the effects of potential over-harvesting (from both Nunavut and Greenland) over the 10 years following that 1997 estimate generated a new ‘adjusted’ estimate of 1,546 (690-2402). This assumption — that the population declined since 1997 due to over-harvesting — has not yet been confirmed or refuted.
The newest survey, supposedly completed in 2013 as noted above, has so far not generated any insight into whether the population has declined, increased, or remained stable since 1997.
Finally, it is worth noting that Baffin Bay has one of the highest harvest rates of all subpopulations. Split almost equally between Canada (Nunavut) and Greenland, which have quite different regulations and reporting systems, the bears are hunted from both sides (Taylor et al. 2005). The contentiousness of this issue makes it all the more surprising that population estimates haven’t been kept more up-to-date.
Sea ice conditions
The latest PBSG report (Obbard et al. 2010) reports that:
“Date of spring-time sea ice breakup is occurring 2-3 weeks earlier than in 1980.”
…TEK [Traditional Environmental Knowledge] confirms these scientific data, and adds that freeze-up is also later than the earlier 1990s and the extent of land fast ice has also declined.”
A two to three week decline in breakup dates is marginally less than what has occurred in Western and Southern Hudson Bay (see previous post here) over the same period.
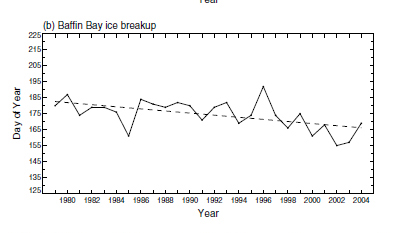
Figure 2. Baffin Bay breakup dates from Stirling and Parkinson (2006): “the Julian calendar dates by which the percent ice coverage decreased to 50% or less…for the years 1979-2004 (dashed line indicates the linear least squares fit).” The dates vary from about Julian date 185 (July 4) to 160 (June 9), with a high in 1996 at 195 (July 14). Keep in mind that bears stay on the ice beyond the ‘breakup’ date, likely 4 weeks or so after.
According to the unique metric used by Rode et al.(2012), sea ice in Baffin Bay was variable between 1977 and 1995 but without a discernible trend; it then declined in the 2000s (see my comments here regarding that method of describing ice conditions and ice maps that show what actually happened).
Stirling and Parkinson (2006) found something similar for breakup dates, defined as the reduction of ice to 50% (Fig. 2) – which means Baffin Bay bears were onshore from about the end of July until late October/early November (about 3 months or so), which is a shorter fast than Western and Southern Hudson Bay bears endure.
Oddly enough, this point is not made clear in any of these papers.
Body condition
![A polar bear near Thule, NW Greenland. Note the decidedly chubby back end on this bear, who looks well prepared for winter. Photo by Robin Davies. [details at my Quote Archive, Featured Quote #6]](https://polarbearscience.com/wp-content/uploads/2012/07/polarbearatthulerobindavies-500x349-sm.jpg)
A polar bear in the summer of 2012 near Thule, NW Greenland (part of the Baffin Bay subpopulation). Note the decidedly chubby back end on this bear, who looks well prepared for winter. Photo by Robin Davies.
[details at my Quote Archive, Featured Quote #6]
The statement I made in my last post, about the unique sea ice metric used in the Rode et al. study, has implications for their conclusions on Baffin Bay polar bear body condition changes:
“Baffin Bay retained sea ice for several weeks longer in summer than Davis Strait for virtually all years between 1981 and 2010, which means ice conditions in the two regions aren’t nearly as similar as Rode and colleagues would like us to believe. It also means that prior to the on-shore summer fast, Baffin Bay polar bears had more time to accumulate body fat than Davis Strait bears — a fact hidden by the “summer sea ice mean” metric.”
Rode et al. found “a negative trend in body condition over time” for some Baffin Bay bears through the 2000s, when sea ice had declined.
However, because they used actual girth measurements (“axillary girth” – diameter around the chest behind the forelimbs), rather than the subjective, relative fatness indices of “very thin to very fat” used in other studies (such as the ones discussed here), it’s really hard to know what a decrease in girth measurements indicate.
Did the bears go from being “very fat” to “fat,” or from “average” to “thin”? In other words, did a decrease in girth measurement mean anything at all to the health or survival of the bears? Their concluding statement is disappointingly devoid of anything definitive on this point:
“In the case of BB, it is likely that declines in body condition over time are, at least in part, a result of recent declines in sea ice habitat.”
Well, that’s hardly surprising but what difference does it make? The authors provided no evidence to suggest that the decline in body condition they documented had any negative effect on the bears whatsoever.
Density
As I calculated in a previous post (here), using 2011 data from Vongraven and Peacock (2011), Baffin Bay had a density of 5.0 bears per 1000 km2,based on the 1997 population estimate. This is about the same density of bears as Davis Strait, which has 5.1 bears per 1000 km2.
Rode and colleagues describe the density of bears in Baffin Bay as “low”. They claim that Taylor et al. (2005) give a density for Baffin Bay of around 3.5 bears per 1000 km2 – which is not true (I checked: Taylor et al. give no density figure for Baffin Bay).
The only way to get a density of 3.5 is to use the 2004 “simulated” population estimate described above – which appears to be what they did. That computer-adjusted estimate does give a lower density figure than Davis Strait.
So, it appears that depending on which population estimate you use, the density of Baffin Bay is either similar to Western Hudson Bay or to Davis Strait.
Conclusions
There is nothing spectacular here – the only issue is whether hunting has been having a negative effect on the population.
Thumbs up to WWF though, for offsetting a small proportion of the costs of the new, helicopter-based survey.
References
Obbard, M.E., Theimann, G.W., Peacock, E. and DeBryn, T.D. (eds.) 2010. Polar Bears: Proceedings of the 15th meeting of the Polar Bear Specialists Group IUCN/SSC, 29 June-3 July, 2009, Copenhagen, Denmark. Gland, Switzerland and Cambridge UK, IUCN. http://pbsg.npolar.no/en/meetings/
Peacock, E., Taylor, M.K., Laake, J., and Stirling, I. 2013. Population ecology of polar bears in Davis Strait, Canada and Greenland. Journal of Wildlife Management 77:463–476. http://onlinelibrary.wiley.com/doi/10.1002/jwmg.489/abstract?deniedAccessCustomisedMessage=&userIsAuthenticated=false
Stirling, I. and Parkinson, C.L. 2006. Possible effects of climate warming on selected populations of polar bears (Ursus maritimus) in the Canadian Arctic. Arctic 59:261-275. http://arctic.synergiesprairies.ca/arctic/index.php/arctic/issue/view/16.
Taylor, M., and Lee, J. 1995. Distribution and abundance of Canadian polar bear populations: a management perspective. Arctic 48:147-154. http://arctic.synergiesprairies.ca/arctic/index.php/arctic/article/view/1236/1261
Taylor, M.K., Laake, J., McLoughlin, P.D., Born, E.K., Cluff, H.D., Ferguson, S.H., Rosing-Asvid, A., Schweinsburg, R. and Messier, F. 2005. Demography and viability of a hunted population of polar bears. Arctic 58:203-214.
Vongraven, D. and Peacock E. 2011. Development of a pan-Arctic monitoring plan for polar bears: background paper. Circumpolar Biodiversity Monitoring Programme, CAFF Monitoring Series Report No. 1, CAFF International Secretariat, Akureyri, Iceland. Available at http://www.caff.is/publications/


You must be logged in to post a comment.