Here’s a quick summary of the status of Baffin Bay polar bears, a subpopulation I’ve not previously discussed in detail. Nothing especially earth-shattering here, except perhaps to wonder about the involvement of the World Wildlife Fund (WWF) in a new helicopter survey of the region.
Baffin Bay (Fig. 1) is north of Davis Strait. It lies between western Greenland and Baffin Island in the eastern Arctic.
Unlike the other north/south neighbour-pair of Western/Southern Hudson Bay (which I discussed previously), the sea ice history for Baffin Bay/Davis Strait is not as similar: Davis Strait bears have a much longer on-shore fast than Baffin Bay bears (see last post here). However, all four of these subpopulations have ‘seasonal sea ice’ – that is, the ice melts completely in late mid-to-late summer, forcing bears onshore for varying lengths of time until fall freeze-up.
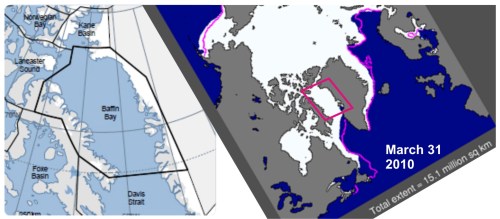
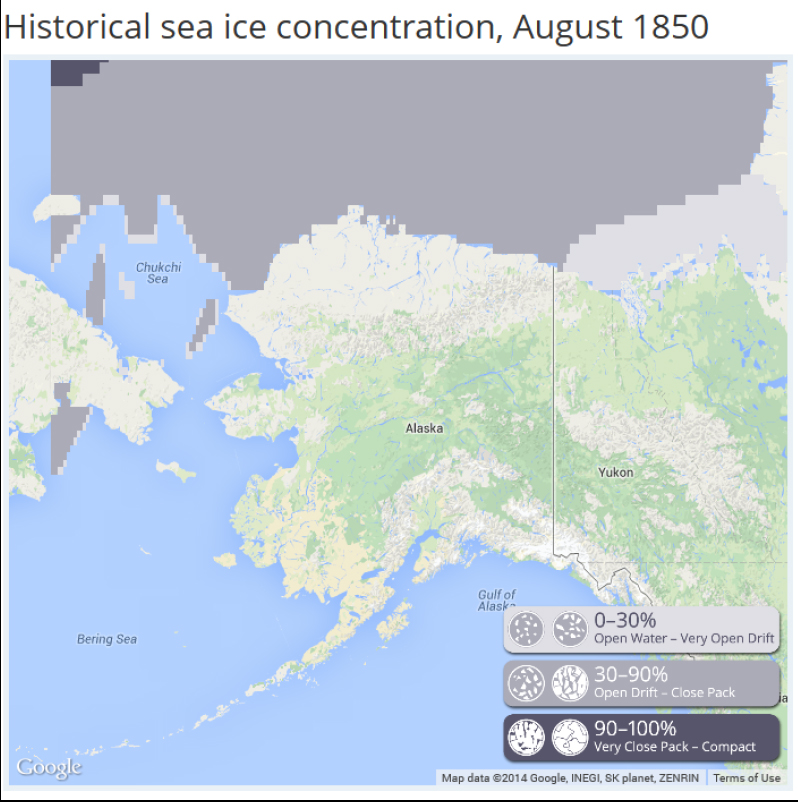
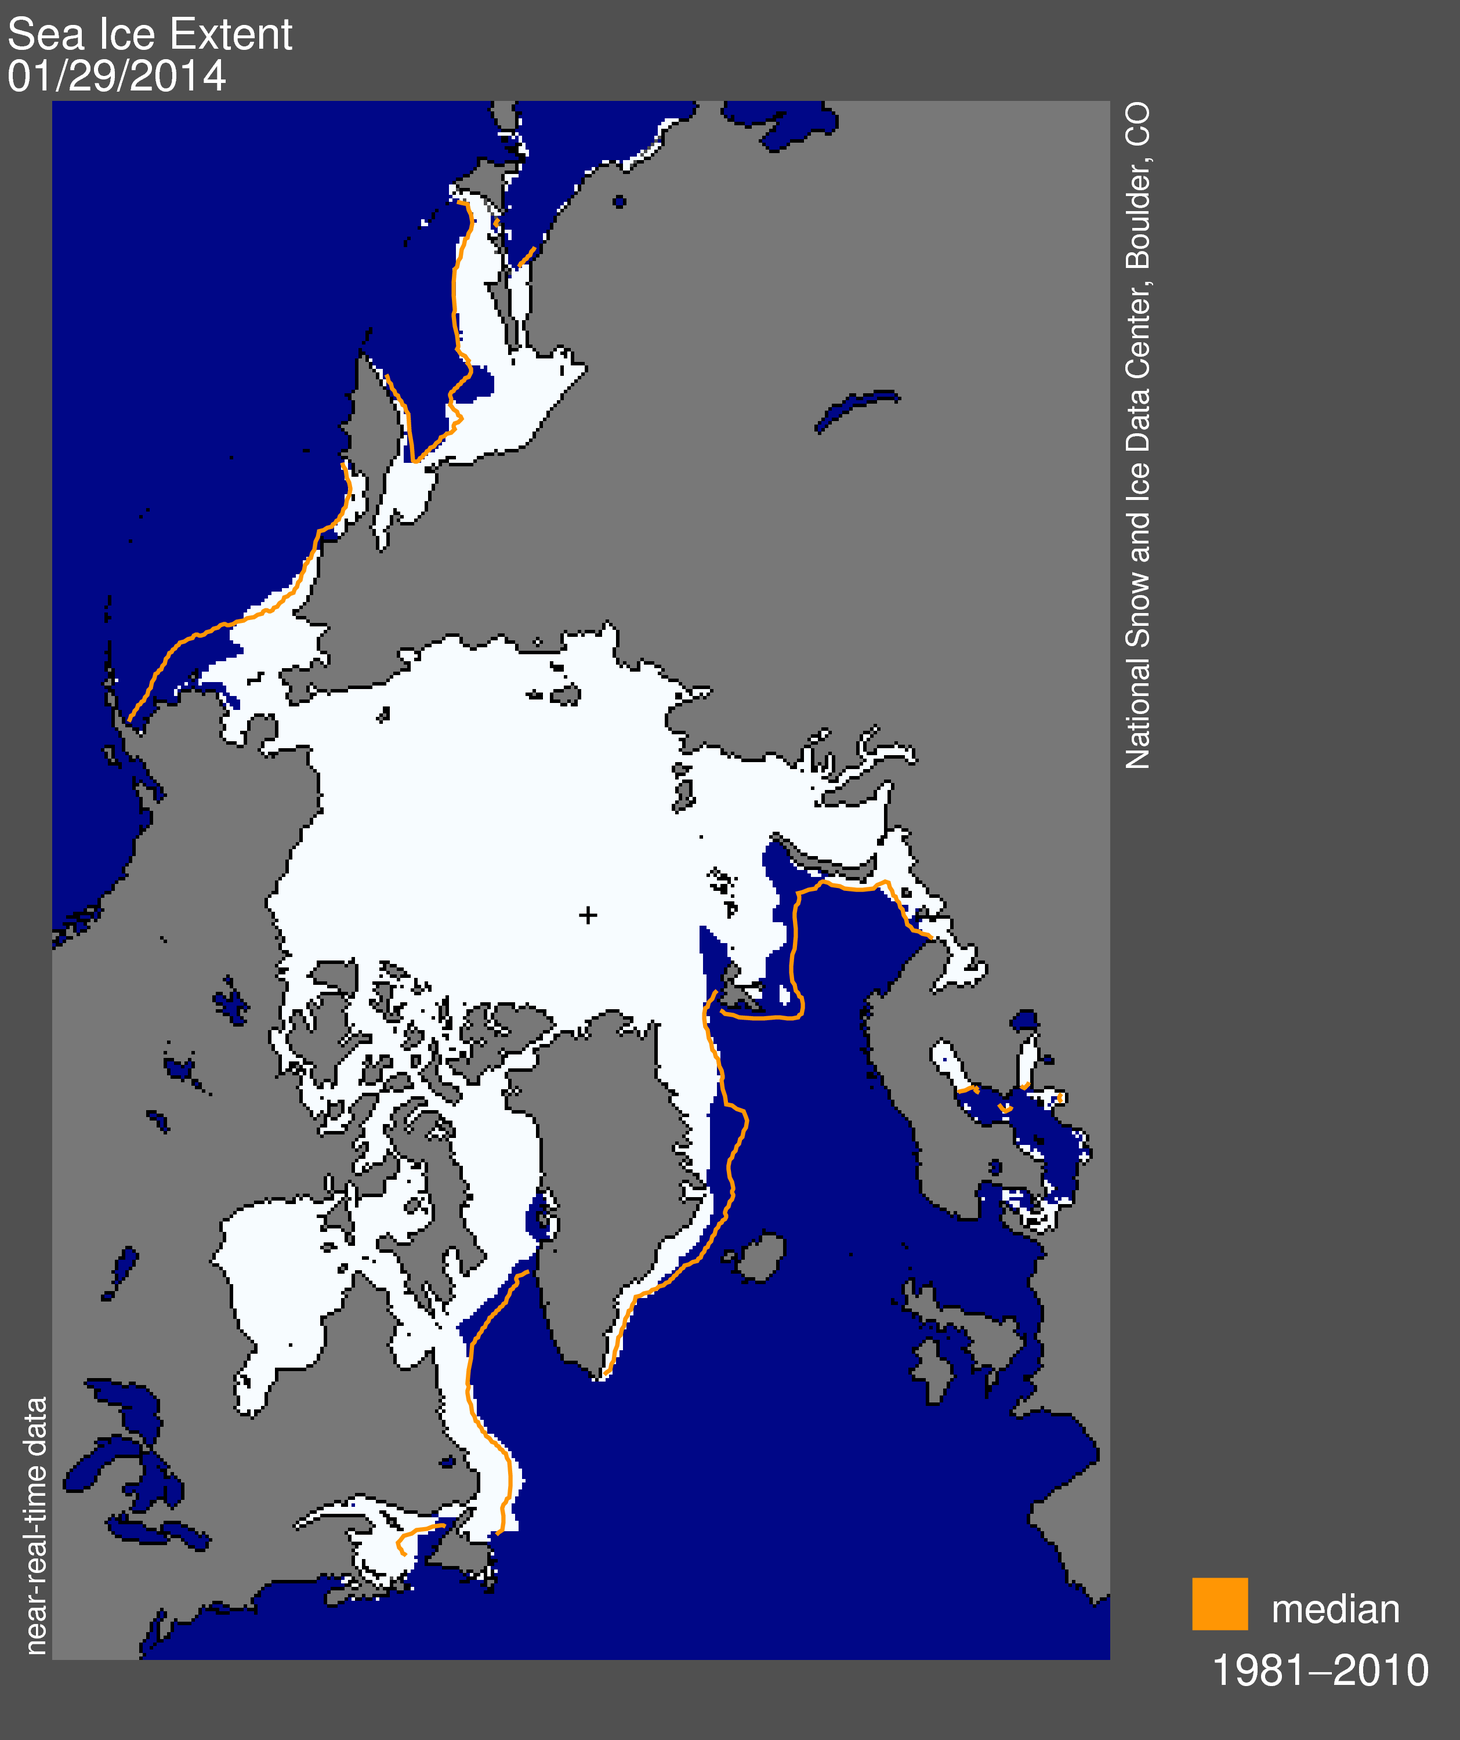
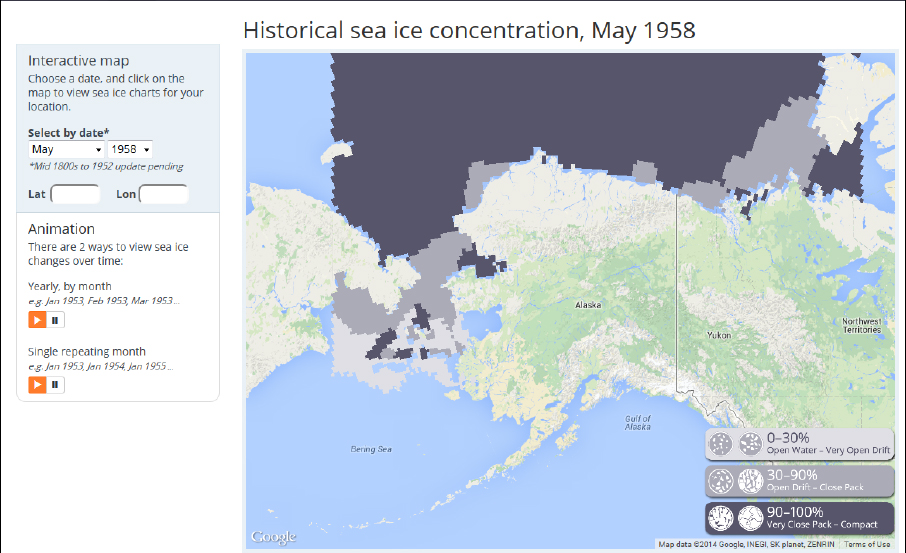
Figure 1. The Baffin Bay subpopulation region lies north of Davis Strait (map on the left from Vongraven and Peacock 2011: Fig. 3) and management is shared between Canada (Nunavut) and Greenland. In total area, it covers 1.08 million km2 and its “suitable ice habitat in spring” (according to Taylor and Lee 1995) is 413,500 km2, somewhat less than Davis Strait. The map on the right shows the sea ice extent at the end of March 2010 (NSIDC), the winter maximum.
A peer-reviewed paper published last year (Rode et al. 2012) compared body condition vs. sea ice changes in Davis Strait and Baffin Bay (discussed here). But while that research contributed to an updated population estimate for Davis Strait (Peacock et al. 2013, discussed here), it did not do the same for Baffin Bay. This is likely because the body condition work in Baffin Bay was split between spring and fall, and it has already been determined that many Baffin Bay bears are offshore in the spring and not available for counting using shore-based methods.
That’s a shame, because the last population estimate was completed back in 1997 (Taylor et al. 2005) and it is now seriously out of date.
However, it appears the Government of Nunavut is currently in the process of surveying this region by helicopter, so a new population estimate should be available soon.
But this aspect of the survey might surprise you — a press release issued February 11, 2013 by WWF contained the following statement:
“Results from the above-noted surveys will be completed and shared beginning in April 2013.
WWF made contributions of $82,000 to the Government of the Northwest Territories and $111,000 to the Government of Nunavut via Environment Canada, towards the total costs of these surveys. These funds were raised through the Arctic Home campaign from engaged Canadians and matched by The Coca-Cola Company.” [my bold]
So, of the hundreds of millions the WWF pulls in from donations, they passed along less than $100,000 [$96,500 plus an equal contribution by Coca-Cola) to offset “the total costs of the survey.”
We are not told what those total costs are, but I expect they run well over a million dollars for a multiyear/multi-region project like this, perhaps over two million. Which makes $96,500 rather a drop in the bucket. That might have paid for some of the jet fuel for the helicopters used for the survey, but probably not all of it.
Status details below.
Continue reading


![A polar bear near Thule, NW Greenland. Note the decidedly chubby back end on this bear, who looks well prepared for winter. Photo by Robin Davies. [details at my Quote Archive, Featured Quote #6]](https://polarbearscience.com/wp-content/uploads/2012/07/polarbearatthulerobindavies-500x349-sm.jpg)


You must be logged in to post a comment.