UPDATE February 11, 2014. A reader (Kevin, at “Afton’s Waterfowl List”) has pointed out an error in Fig. 3, where I inadvertently labeled the bars on the upper graph as ending in 2011 instead of 2012 (the Pembroke graph ends at 2011. sigh..). I have corrected the figure and the text that refers to it, but do not believe it affects the overall conclusion. See for yourself. Thanks Kevin — and Alan for getting in touch!
Another round of press release inspired news stories emerged last week insisting that polar bear predation on ground-nesting birds during the summer ice-free period is evidence that they are nutritionally stressed by global warming.
A few weeks ago it was snow goose eggs in Western Hudson Bay – this time it’s thick-billed murre (Uria lomvia) and common eider (Somateria mollissima) eggs in Foxe Basin and Hudson Strait (e.g. see the story at Canada’s National Post and a short summary provided by Science [and it’s not even their paper!]). The source of the media attention this time is a newly-published paper by Samuel Iverson and colleagues (Iverson et al. 2014).
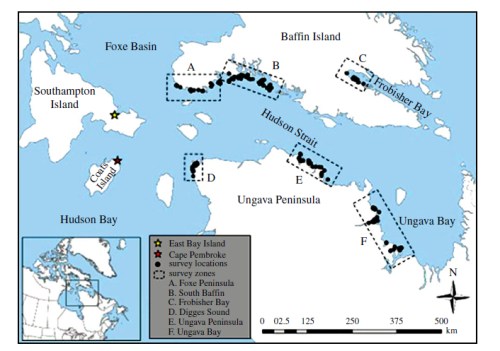
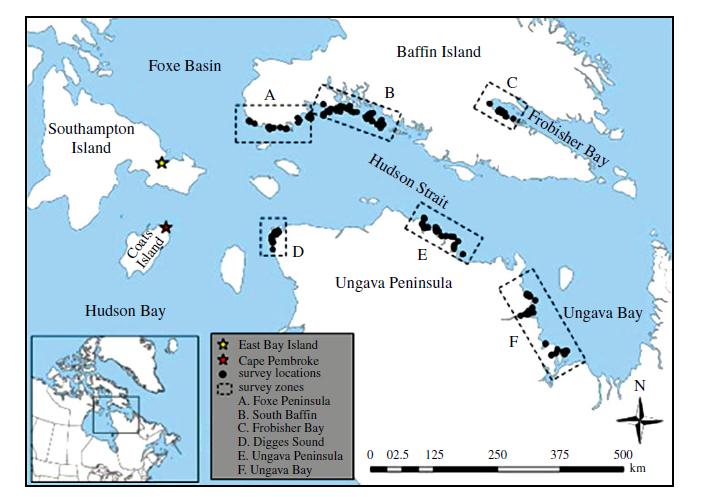
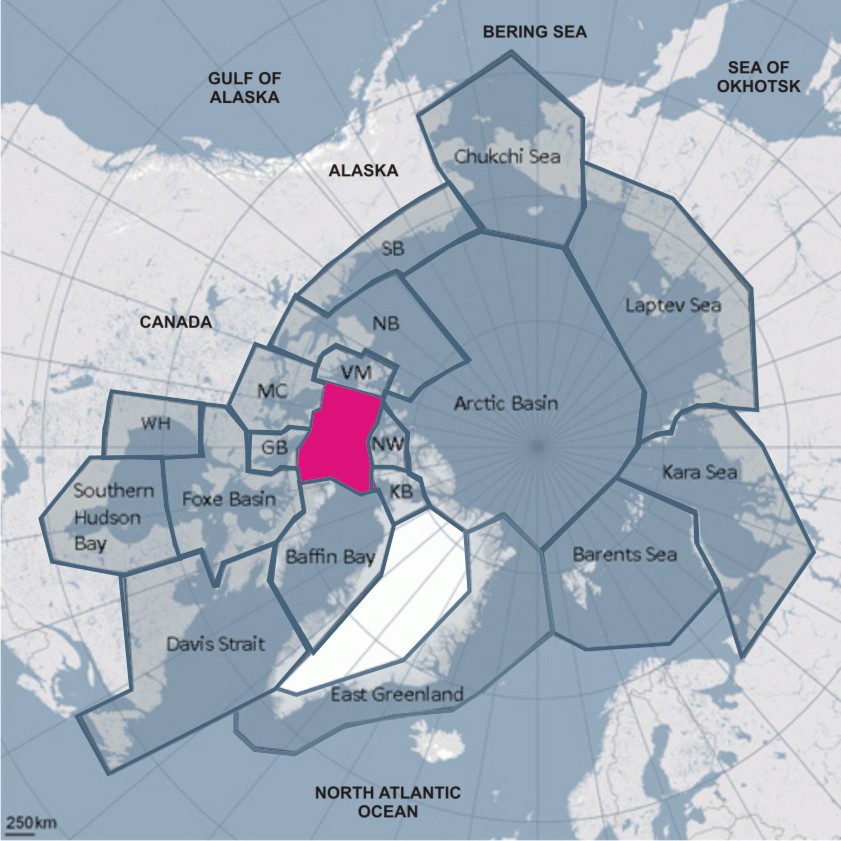
Figure 1. From Iverson et al. 2014 (their Fig.1), “map of the study area.” Most of the study sites are within the Foxe Basin polar bear subpopulation region (see Fig. 2 below), although the Ungava Peninsula (E), Ungava Bay (F) and Frobisher Bay (C) sites are in the Davis Strait subpopulation.
Polar bears have always preyed on ground-nesting sea bird and goose eggs while onshore (see Kelsey Eliasson’s take on the situation around Churchill, at his PolarBearAlley blog). The issue in this case is whether the increase in predation can be unquestionably blamed on reduced sea ice cover and nutritionally-stressed bears – that is, predation increases that correlate with year-to-year sea ice changes and bears in poor condition found consuming bird eggs.
As I did for the “polar bears eat more caribou and snow geese than they used to” press release, I refused to take the PR or the news stories at face value and went to the published paper and its supplemental data (it’s open access, see it for yourself here).
What I see in this paper is a spurious sea ice correlation and no data on the condition of the few bears observed consuming eggs. There is also no mention of the fact that polar bear numbers have increased in part of the study area (Davis Strait) or that bears in Foxe Basin and southern Davis Strait have been found to be in very good condition and reproducing well (Rode et al. 2014; Peacock et al. 2013). See my analysis below and judge for yourself.
Continue reading


You must be logged in to post a comment.