
From the end of October to mid-December, there has been a rapid expansion of polar bear habitat.
This month, I’ve constructed two all-in-one images that show the progressive growth of the ice relative to some critical polar bear onshore summer refuge areas and denning territory. I’ve also included a map that compares 2013 to 2009 at 18 December with the average for the 1980s, and one that shows ice thickness.
I’ve used the US National Snow and Ice Data Center’s MASIE images for 30 October through 18 December for Fig. 1. On the 30 October image, I’ve circled several regions where all or many polar bears spend the summer ice-free period on land (or where they den on land), to help you track how the ice develops in critical regions.
Note that by 30 October, ice had reached the important land-based refuges and denning areas of Wrangel Island (Chukchi Sea), Novaya Zemlya (Kara Sea) and Franz Josef Land (Barents Sea). By the end of November, ice had reached all of the others (see Fig. 2). Fig. 2 shows a close-up view of Canadian ice development over the same period, including Hudson Bay, Foxe Basin and Davis Strait.
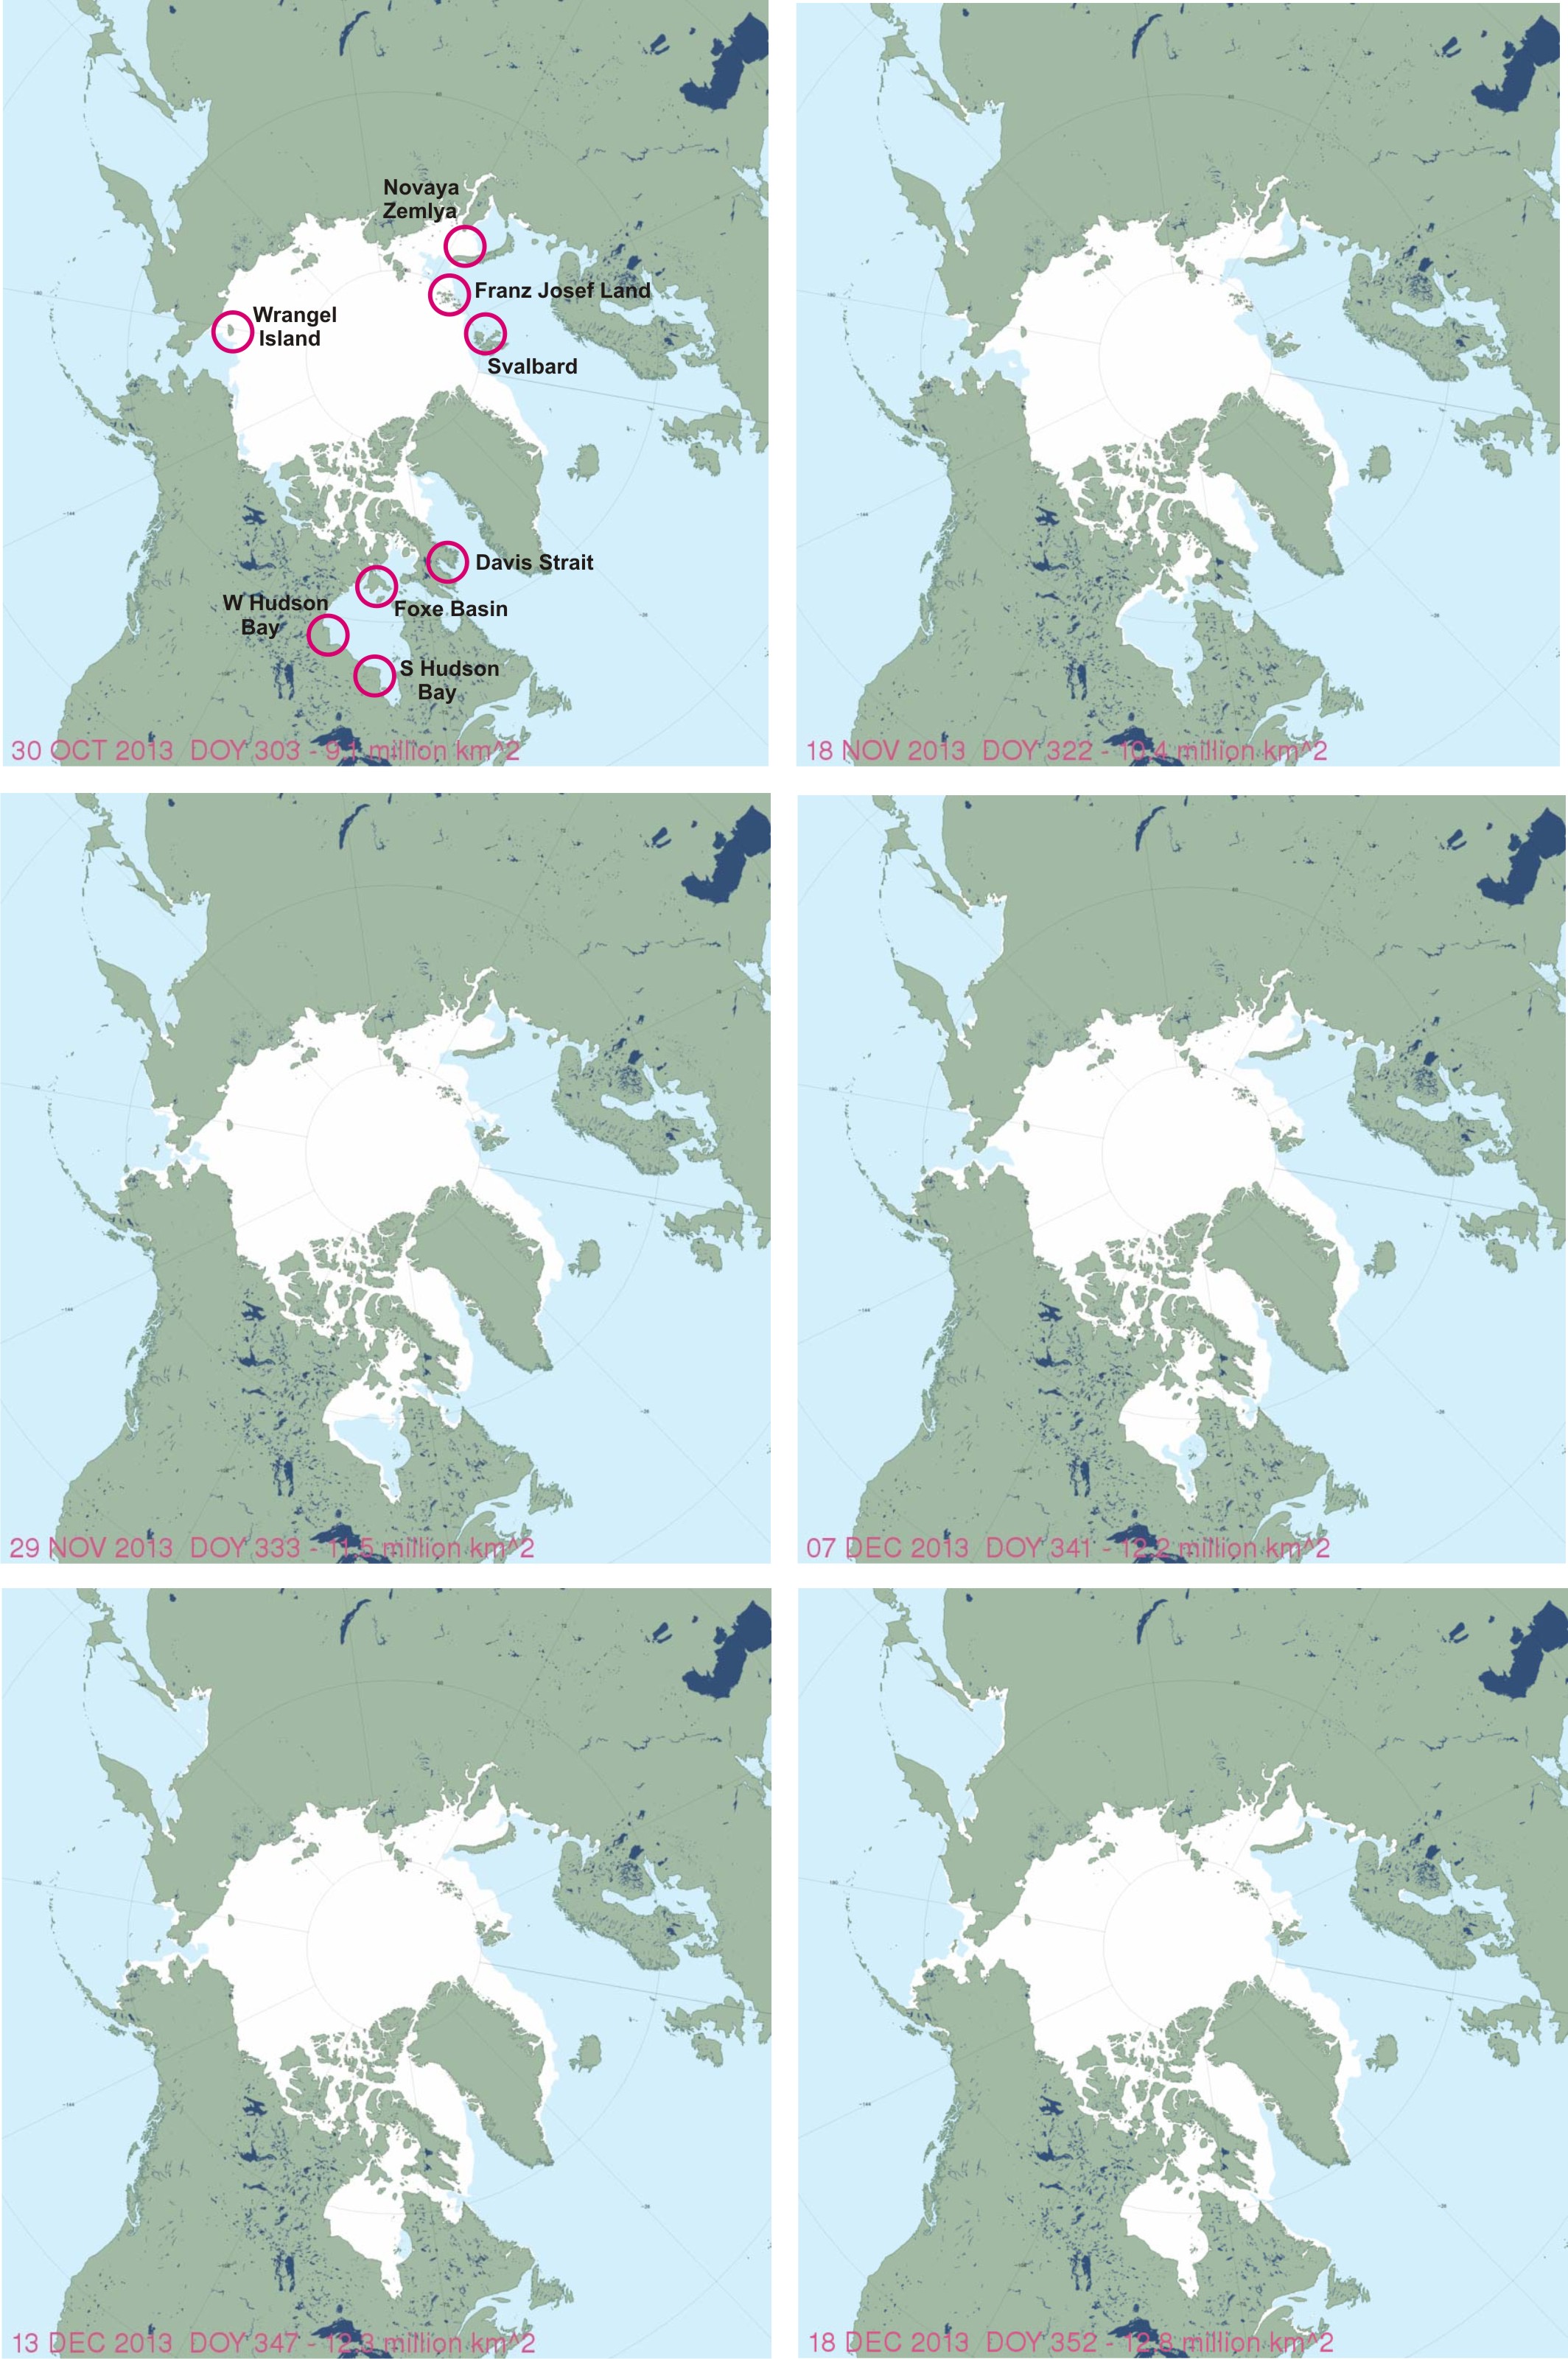
Figure 1. US National Snow and Ice Data Center’s MASIE images for (upper left to right): 30 October, 18 November, 29 November, 7 December, 13 December and 18 December. On the 30 October image (upper left), I’ve circled some regions where polar bears would have spent the summer ice-free period on land or where females den in the fall. Click to enlarge.
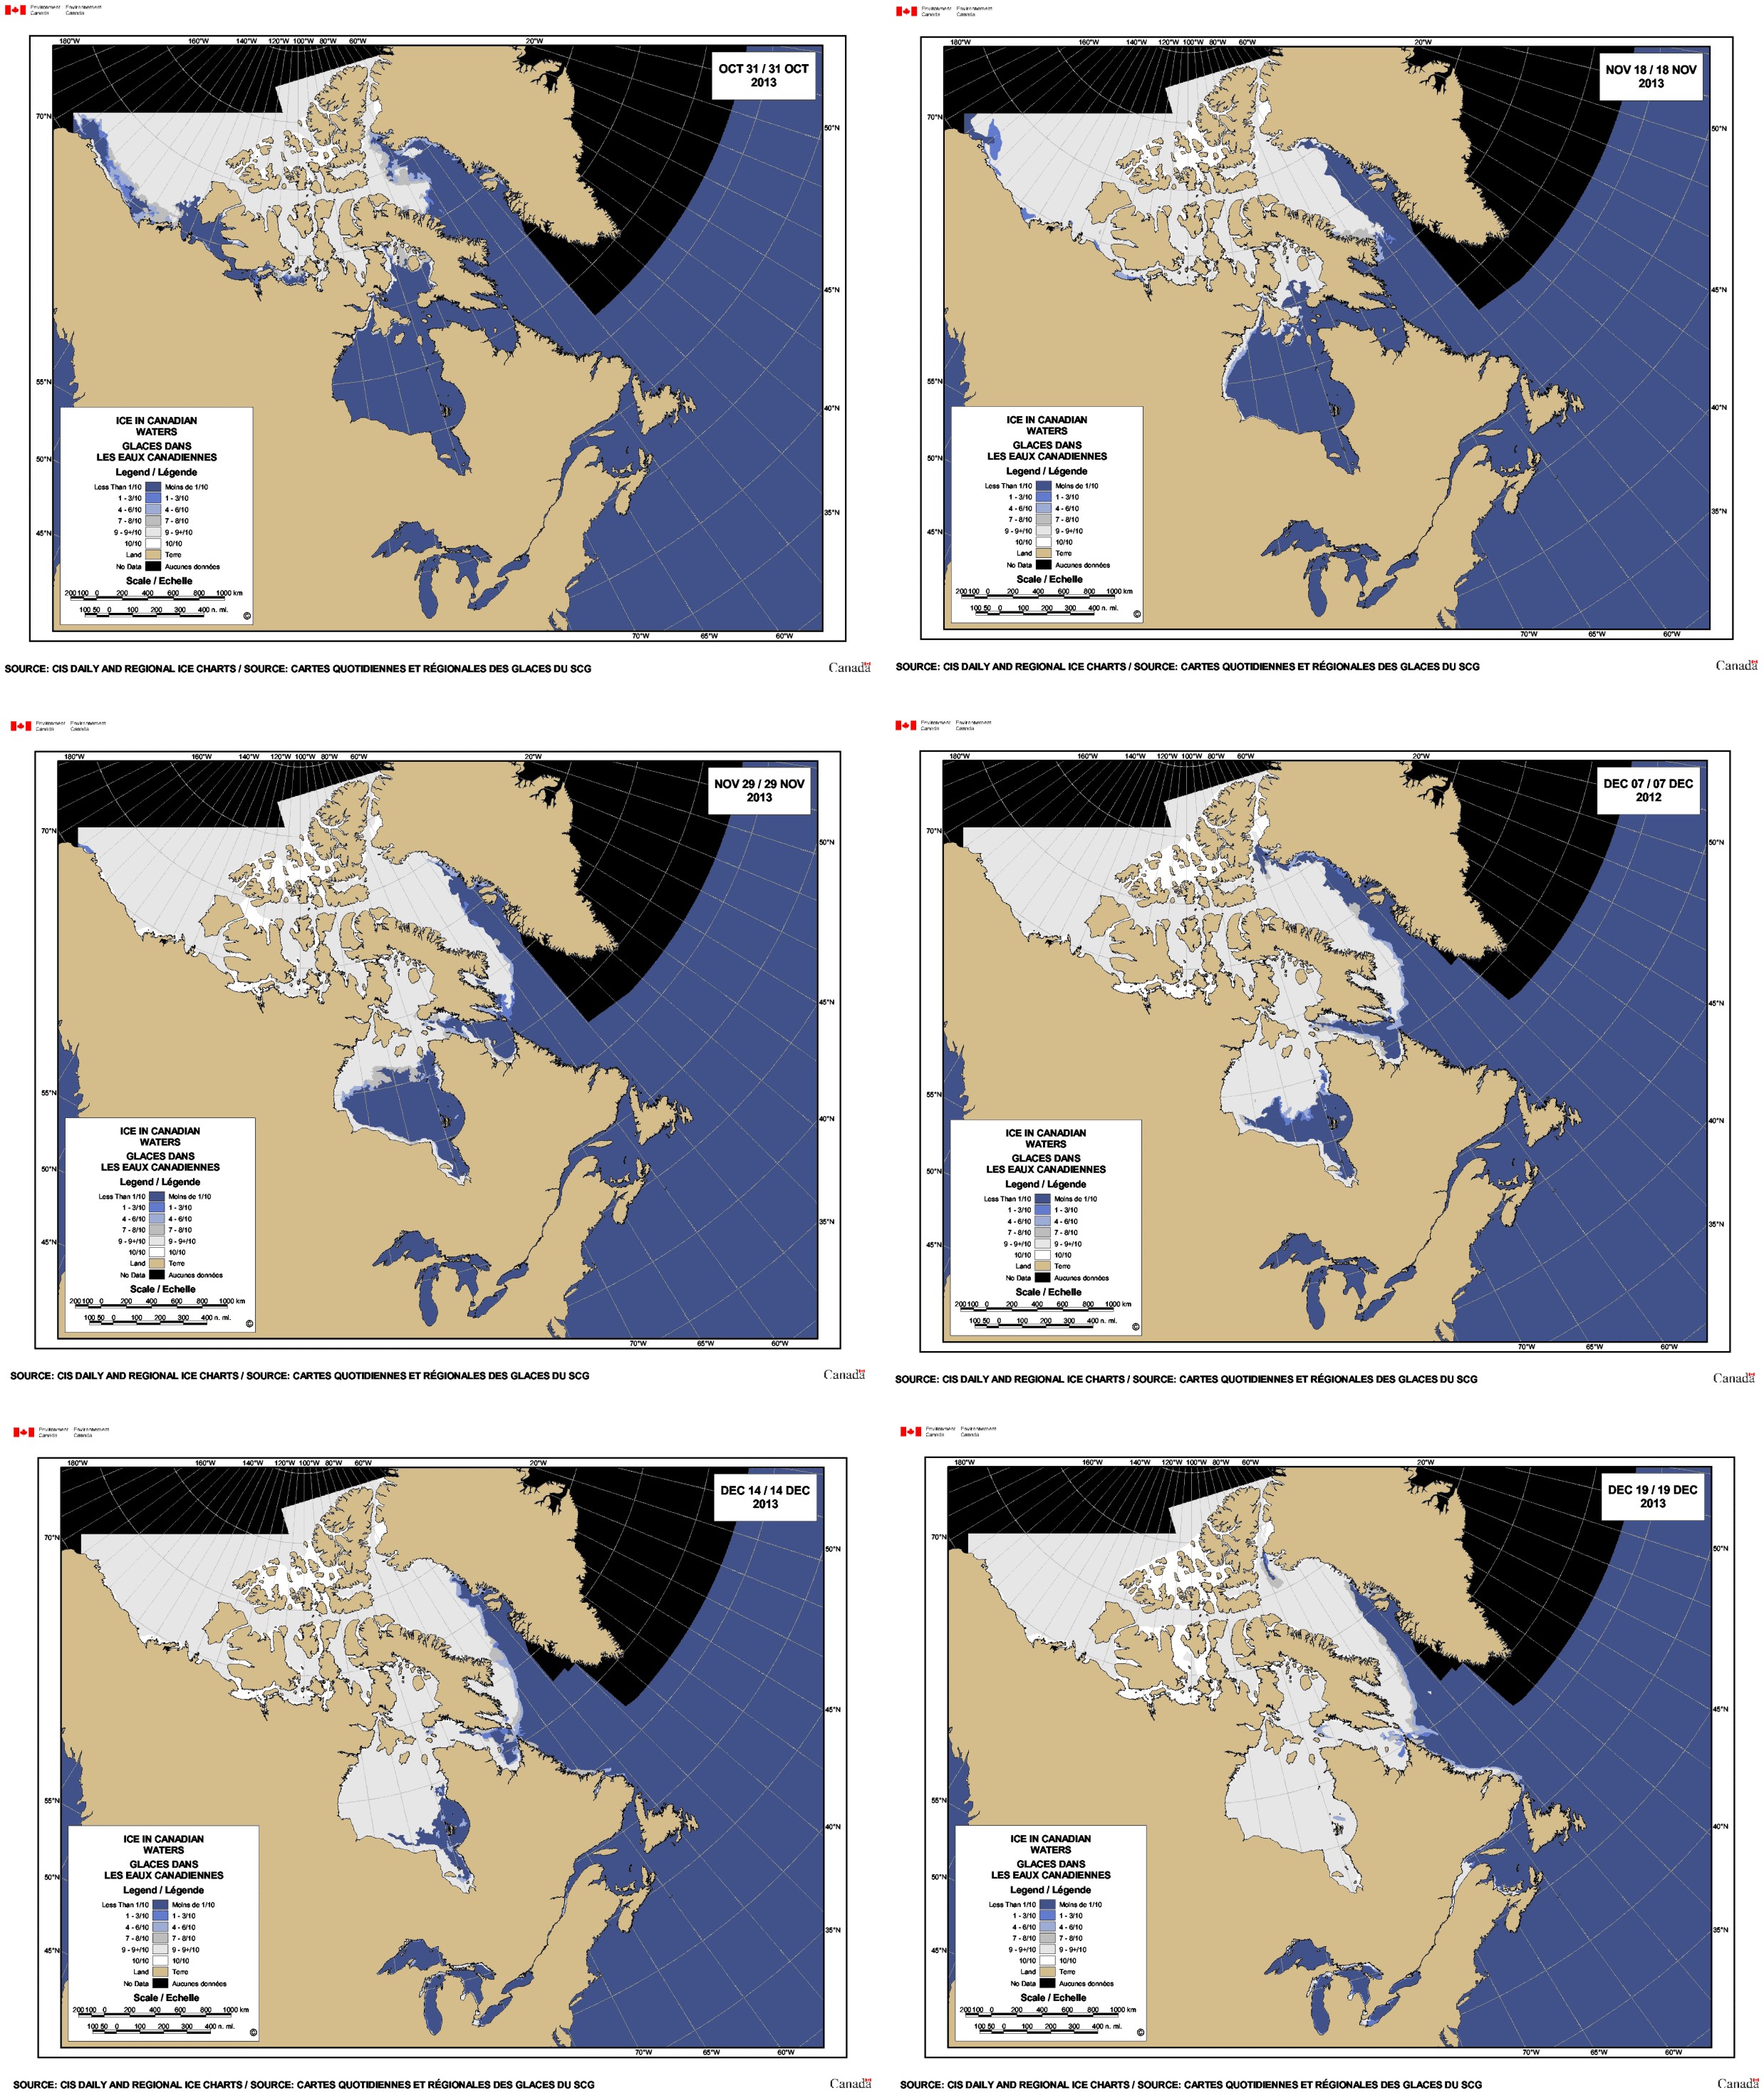
Figure 2. For a closer look at ice development in the Canadian Arctic, including Hudson Bay, I’ve used the Canadian Ice Service images for (upper left to right): 31 October, 18 November, 29 November, 7 December, 14 December, and 19 December. Note that by 18 November, there was sufficient ice for bears in Western Hudson Bay, Foxe Basin and Northern Davis Strait to start moving onto the ice. Two weeks later, bears in Southern Hudson Bay and Southern Davis Strait had enough ice to start hunting. The ice has expanded and thickened markedly since then.
In Fig. 3 below, note that in 2009 there was more ice at 18 December in the Sea of Okhotsk (lower left part of the map, where no polar bears live) and the Northern Bering Sea, and a bit more in parts of the Barents and Kara Seas; in 2013, there was slightly more ice at this date in Hudson Bay and parts of the Barents Sea.
However, as Fig. 1 shows, by the end of November, ice had reached all critical polar bear summer land refuges and denning regions (see my November update here, which includes an ice map of 1979 — when the extent was just about equal to the average for the period 1981-2010).
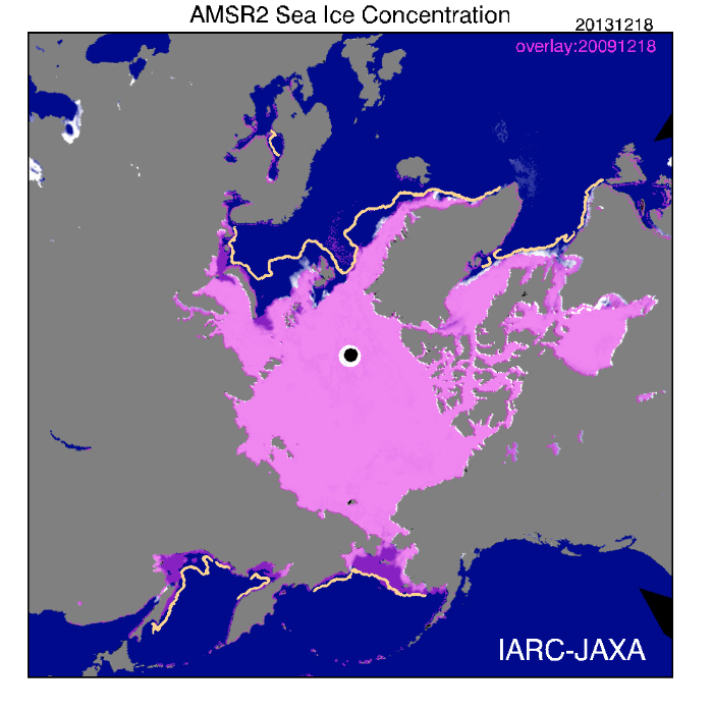
Figure 3. This image shows this year’s ice levels at 18 December 2013 (white) overlaid with 18 December 2009 in purple. Areas that were the same both years show as pink: greater extent for 2013 show as white, while greater extent for 2009 show as purple. The orange line is the average extent during the 1980s for this date. Map from JAXA (Japan Aerospace Exploration Agency), “Arctic Sea Ice Monitor.” Click to enlarge.
As Fig. 3 shows, while there was certainly more ice in the 1980s than in the 2000s on this date in December, there was ice where polar bears needed it in all decades (see Fig. 1, 30 October panel).
The extent of sea ice is not the only feature that matters — ice thickness is also a factor in creating good polar bear habitat. For a snapshot of ice thickness, see Fig. 4 below (also this NRL 30 day animation of ice thickness development).
Keep in mind that ice only has to be 30cm thick (<0.5m, pale purple on the map) to support an adult male polar bear, but that ice that’s too thick restricts the ability of ringed seals (their primary prey) to maintain breathing holes. This means multiyear ice is relatively poor habitat for polar bears. The best, most productive habitat is first year ice (2 meters or less) that forms over relatively shallow coastal areas — the kind of ice that is forming right now in areas like Hudson Bay and the Chukchi and Barents Seas.
[Note that research on polar bears in the Canadian Arctic around Baffin Bay (Ferugson et al. 2000) has shown that polar bears there routinely hunt on ‘young ice’ (0.1-0.3m, called “grey-white” young ice on Canadian Ice Service maps and pale purple on the US Navy ice thickness maps]
Figure 4. Sea ice thickness at 19 December, from the US Naval Research Laboratory (NRL) – HYCOM Consortium for Data-Assimilative Ocean Modeling. Note the thick, multiyear ice bearing down on the coast of Alaska at 140W (the Southern Beaufort). Courtesy WUWT Sea Ice Page, updated daily.
Finally, a recent news article (Alaska Dispatch, December 16) called attention to the marked increase, since last fall, in sea ice volume (a measure which takes into account both extent and thickness). Unfortunately, there is only a few years worth of data available for ice volume, so we don’t know how this year compares to other periods in the recent past:
“The volume of sea ice in the Arctic is 50 percent greater than it was last fall, satellite measurements show.
…
The [CryoSat] satellite, launched in 2010, is designed to measure sea ice thickness across the Arctic Ocean, allowing scientists to monitor changes in volume and not just surface coverage.
…
About 90 percent of the increase in sea ice volume this year is from the growth of multiyear ice, the release said, which now averages about 20 percent thicker than last year — 30 centimeters, or 12 inches.” [my bold]
References
Ferguson, S. H., Taylor, M. K., and F. Messier 2000. Influence of sea ice dynamics on habitat selection by polar bears. Ecology 81:761-772. http://www.esajournals.org/doi/abs/10.1890/0012-9658%282000%29081%5B0761%3AIOSIDO%5D2.0.CO%3B2


You must be logged in to post a comment.