
The oft-repeated claim that polar bears are starving in Western Hudson Bay (e.g., here, here, here, and here) comes primarily from a 10 year old study that documented a declining trend in polar bear body condition (a biology euphemism for relative fatness) between 1980 and 2004, which appeared to correlate with earlier and earlier breakup dates for Hudson Bay.

Figure 1. Polar bear female with cub, 2009, Churchill, Western Hudson Bay. Wikipedia.
The authors of that study (polar bear specialist Ian Stirling and NASA sea ice researcher Claire Parkinson) reported the body weights of lone female bears captured in Western Hudson Bay between 1980 and 2004. The trend over time in those bear weights was then correlated with the overall change in dates of sea ice breakup on Hudson Bay for that period.
However, it turns out that while the trend of body condition and the trend in breakup dates indeed correlated over time, the actual year to year data did not. The question is, what does that mean for the claim that polar bears in WHB are starving?
Body Condition of Polar Bears, 1980-2004
The study (a follow-up from earlier work, Stirling et al. 1999) showed the average weight decline of presumably pregnant, lone females in Western Hudson Bay between 1980 and 2004 was about 65 kg (from ~295 to ~230 kg), “a change that is statistically significant” (Stirling and Parkinson 2006:266).
From the graph provided (Fig. 2), note that weights of problem bears were almost as high in 2000 as they were in 1980 and that the highest weights recorded were in 1982. Both the lowest average weight (~205 kg) and the absolutely lowest weight (~165 kg) were recorded in 2002.1
All weights were adjusted to account for the fact that they were recorded on different days (“we scaled weights to a constant capture date of 21 September by adding (or subtracting) 0.85 kg to (or from) the weights of all bears for each day by which their capture preceded (or followed) that date.”).
Unbelievably, the number of female bears measured each year for this study was not stated anywhere in the paper.
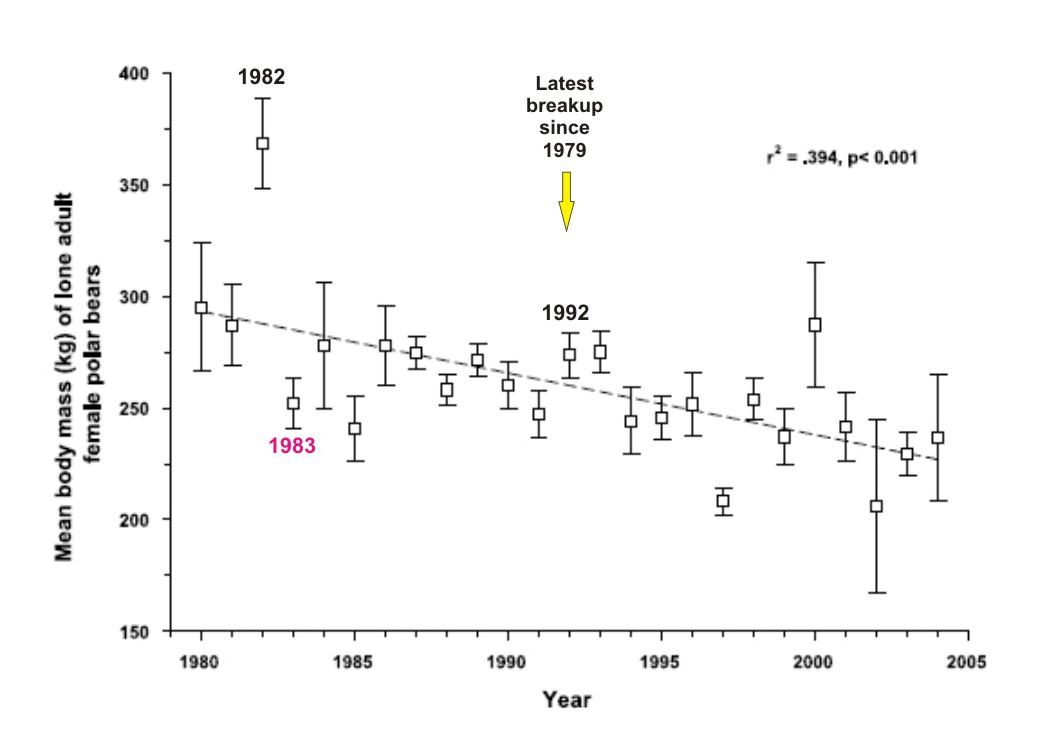
Figure 2. From Stirling and Parkinson (2006), original caption: “Mean estimated mass of lone (and thus possibly pregnant) adult female polar bears in Western Hudson Bay from 1980 through 2004 (dashed line indicates fit of linear regression).” Highest weights were in 1982, lowest in 2002. The actual number of bears measured each year, or the total number, was not stated. Some additional labels are mine. Note that 1992 had by far the latest breakup date (see Fig. 3) but not the heaviest bears.
Regarding the lowest average weights recorded (~230 kg), Stirling and Parkinson (2006:266) stated:
“Derocher et al. (1992) reported that no females weighing less than 189 kg in the fall were recorded with cubs the following spring, suggesting that 189 kg (at 21 September) approximates a minimum weight below which the bears can no longer successfully reproduce.” [my bold]
Here is what Derocher et al. (1992) actually said:
“The minimum weight of a confirmed pregnant female in autumn was 189 kg, but approximately 10% of the suspected pregnant females were below this and may have had insufficient fat stores to fast through the winter and produce cubs.” … “Suspected pregnant females weighed from 148 to 422 kg, with a mean of 258 kg (SE = 4, n = 166). Seventeen (10.2%) of the [166] suspected pregnant females were below the minimum weight of confirmed pregnant females.” [my bold]
So, between 1982 and 1990 – well before there was any major trend in sea ice cover – 17 bears out of 166 females captured may have been too thin (< 189 kg) to support a pregnancy that year.
But even by 2004, the average weight of lone females at 21 September (~230kg) was still well above this “critical” weight for supporting a pregnancy (189 kg).
Breakup Dates
As Fig. 3 below from this study shows, the earliest breakup year occurred in 2003 (second earliest was 1990); latest breakup was 1992 (second latest was 1983) although breakup was also quite late in 2004 as well.
[Note that Stirling and Parkinson used the old 50% coverage definition of breakup, not the 30% coverage definition (Cherry et al. 2013) that claims to best describes the critical levels for polar bears, discussed here, calculated only for 1990 to 20091]
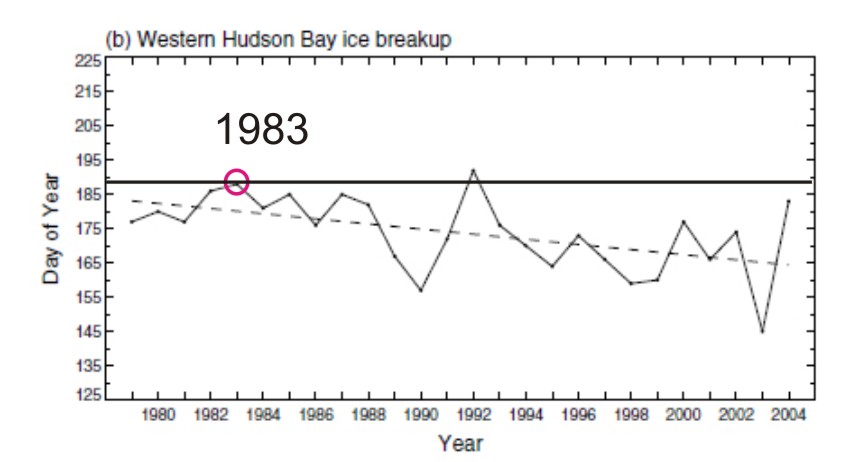
Figure 3. Graph from Stirling and Parkinson (2006:265) depicting breakup dates for Western Hudson Bay from 1979 to 2004, using a 50% ice cover threshold for “breakup.” Dashed line is the trend line fit by linear regression. Note that the solid line (added by me) indicates that 1983 had the second-latest breakup date in this period, a fact not mentioned in the paper.1
Conclusions
Although female polar bears in 2004 may have been thinner than bears in 1980, they were not even close to being too thin to support a pregnancy, let alone too thin to live.
In this case, “thinner” is not the same as “thin” or “starving” – it means slightly less fat.
And although there was a “clear overall trend toward progressively earlier sea-ice breakup” and a “statistically significant” change in mean weights between 1980 and 2004, the lowest weights did not occur during years of early breakup and the highest weights did not occur in years of latest breakup – or the year that followed.
Correlated trends do not necessarily mean the data themselves are correlated.
And, as I’ve mentioned before (here, here, and here), there has not been any new data published since then on the condition of WHB bears, which means these misleading conclusions are also 10 years out of date.
Related posts:
Western Hudson Bay polar bears are not like the others – Part 2 October 5, 2012
W Hudson Bay mark-recapture studies of polar bears were invalid, says peer-reviewed study July 15, 2014
Breakup date average for W. Hudson Bay is July 1 – this year, it’s late again
July 10, 2014
Polar bears of W. Hudson Bay came ashore in 2009 as late as in 1992 March 21, 2013
Natural selection helps polar bears adapt to sea ice variability – which means some bears die September 30, 2014
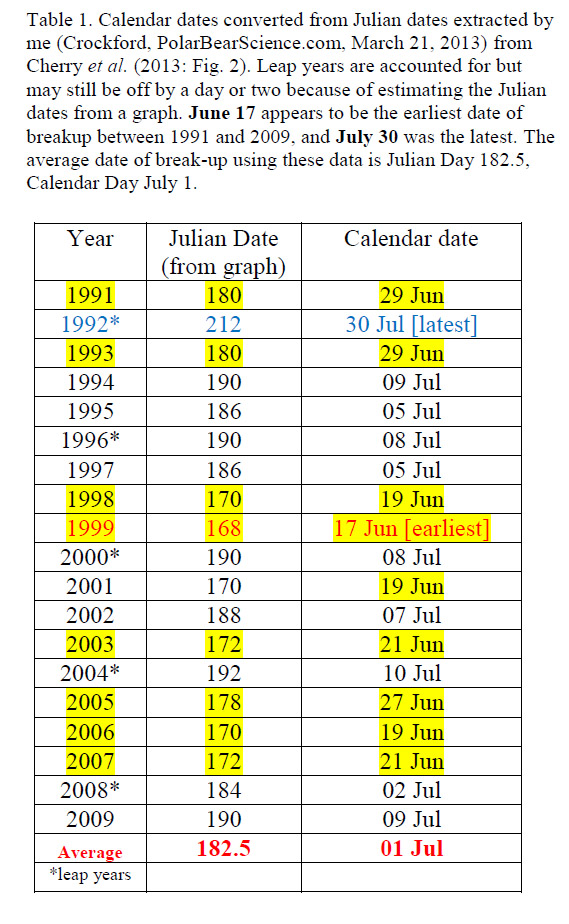
Footnote 1: Breakup dates for 1991-2009 using Cherry et al. (2013) method of 30% ice coverage threshold are listed in Table 1 below. The biggest difference between the two methods seems evident by looking at 1992: breakup occurred (according to Stirling and Parkinson’s graph, Fig. 3 above) on about day 193 (July 11) using the old method but not until day 212 (July 30) using the new method. The new method might have made 1983 (breakup ~day 189 in Stirling and Parkinson) closer to average.
References
Cherry, S.G., Derocher, A.E., Thiemann, G.W., Lunn, N.J. 2013. Migration phenology and seasonal fidelity of an Arctic marine predator in relation to sea ice dynamics. Journal of Animal Ecology 82:912-921. http://onlinelibrary.wiley.com/doi/10.1111/1365-2656.12050/abstract
Derocher, A.E., Stirling, I. and Andriashek, D. 1992. Pregnancy rates and serum progesterone levels of polar bears in western Hudson Bay. Canadian Journal of Zoology 70:561-566. http://www.nrcresearchpress.com/doi/abs/10.1139/z92-084 [open access]
Stirling, I. and Parkinson, C.L. 2006. Possible effects of climate warming on selected populations of polar bears (Ursus maritimus) in the Canadian Arctic. Arctic 59:261-275. http://arctic.synergiesprairies.ca/arctic/index.php/arctic/issue/view/16. [open access]
Stirling, I., Lunn, N.J. and Iacozza, J. 1999. Long-term trends in the population ecology of polar bears in Western Hudson Bay in relation to climate change. Arctic 52:294-306. [open access]
http://arctic.synergiesprairies.ca/arctic/index.php/arctic/article/view/935/960


You must be logged in to post a comment.