Tag Archives: trends

New polar bear hunting habitat forming already along the coast of the Laptev Sea: A new trend?

Not even three weeks after the yearly minimum of sea ice extent was reached this year, new shorefast ice is already forming off the coast of Siberia, which is critical fall hunting habitat for polar bears.

Polar bears on a seal kill in new ice, 31 October 2020 in W. Hudson Bay via webcam.

So, not only was this year’s sea ice extent for September at the very lowest extreme of predicted levels for late summer, given ever-increasing CO2 concentrations in the atmosphere, new ice seems to be forming earlier in the fall as well, which bodes well for winter ice formation. It’s looking to me like the decade-long increasing trend of September ice extent since 2012 (see below) may indicate a change more biologically relevant to ice-dependent Arctic animals than the zero trend since 2007.

Continue reading

Polar bear no closer to extinction than it was 18 years ago as Arctic sea ice resists ‘tipping point’

All predictions of disaster aside, in fact the polar bear is no closer to extinction than it was in 2005 as Arctic sea ice again steadfastly resists slipping past a catastrophic ‘tipping point’ — or the ‘death spiral’, as some chicken-littles continue to call it.

In fact, the summer sea ice trend has been pretty much flat since 2007, with ice covering about 42% less area than it had done in 1979, yet polar bears in many regions are doing better now than they were in 2005, especially in Davis Strait, the Barents and Chukchi Seas and the Canadian Arctic Archipelago.

Continue reading

Six good years in a row for the polar bear subpopulation used to predict species demise

In something resembling a new pattern for Western Hudson Bay polar bears, most of the animals are still out on the ice in late July this year, just like they were in the 1980s. The same thing happened last year but was brushed off as a happy anomaly. However, after last fall’s 1980s-like early freeze-up, this makes the sixth year in a row of good to very good sea ice conditions for Western Hudson Bay polar bears. No wonder polar bear experts haven’t published these data: good sea ice conditions along with polar bears coming ashore fat and healthy are not just inconvenient – they threaten to destroy the extinction panic narrative that depends on Western Hudson Bay bears showing evidence of harm from reduced sea ice.

WH 18 Sat July 2020 noon PT Cape East fat mother and cub_Wakusp NP explore dot org livecam

Fat mother and cub onshore at Wakusp National Park, Western Hudson Bay 18 July 2020, one of the first of the season.

Continue reading

No early breakup for W Hudson Bay sea ice again this year: polar bears still on the ice

No early breakup of Hudson Bay sea ice again this year: there is still extensive thick first year ice over most of Hudson Bay and all female polar bears fitted with tracking collars in Western Hudson Bay are still on the ice:

W Hudson Bay polar bears still out on the ice that’s packed together by winds. AE Derocher, 12 June 2020

Dercocher June 12 2020 tracking map Hudson Bay

Breakup of Hudson Bay sea ice as it relates to polar bear movement to land has been about the same since 1999 (about 2 weeks earlier than in the 1980s) and this year is shaping up to be no different: there is still no declining trend in date of sea ice breakup in Western Hudson Bay despite repeated predictions of imminent doom. An especially ‘early’ breakup year would have bears ashore before 15 June. Last year (2019) the first WH bear onshore was caught on film 5 July and problem bears were not recorded onshore in Churchill until the 2nd week of July.

Continue reading

Now 20 years with no trend in ice breakup dates for Western Hudson Bay polar bears

Straight from the horse’s mouth: all polar bear females tagged by researchers around Churchill in Western Hudson Bay last year were still on the ice as of 25 June. With plenty of ice still remaining over the bay, spring breakup will be no earlier this year than it has been since 1999. Contrary to predictions of ever-declining ice cover, the lack of a trend in sea ice breakup dates for Western Hudson Bay is now twenty years long (a hiatus, if you will) and yet these bears are repeatedly claimed to have been seriously harmed in recent years by a loss of sea ice.

Derocher 2019 WHB collared females 25 June all bears still on the ice

In fact, WH bears have faced relatively few ‘early’ years of sea ice breakup and breakup has never come before the 15th of June. The earliest recent spring breakup date did not come in 2012 – when sea ice hit a summer record low – but in 1999, when Hudson Bay sea ice suddenly began to melt by late June rather than mid-July (Cherry et al. 2013; Castro de la Guardia et al. 2017; Lunn et al. 2016). And this year, as has been the case since 1999, breakup looks to be about two weeks later (give or take a week or so, at around 1 July), than was the case in the 1980s and early 1990s.

In other words, there has been no escalation of breakup dates since 1999: there has been no declining trend in breakup dates for Western Hudson Bay polar bears for 20 years (and no trend in fall freeze-up dates either).

UPDATE 26 June 2019: Here is the latest sea ice chart for the week of 24 June 2019 from the Canadian Ice Service (all that dark green is thick first year ice >1 m thick):

Hudson Bay weekly stage of development 2019 June 24
Continue reading

Environment Canada maps of polar bear population and status assessments 2018

Just out (6 June 2018) — new population assessment and status maps of the 19 polar bear subpopulations according to Environment Canada. Contrary to the map presented at the Range State meeting in February 2018 (pdf here), these maps show Western Hudson Bay and Southern Hudson Bay (along with the Southern Beaufort) as “likely declined.” A new category has been added for the Barents Sea: it’s considered “data deficient/uncertain,” but a population estimate of 2,001-3,000 has been provided.

No press release or other notice regarding the availability of these new maps was issued, as far as I know: I came across them by accident while looking for something else.

Global pb status and population map EC 2018

Global map above, more below, including a comparative map that shows 2010, 2014, and 2018 together. I will update the two recent posts of mine (here and here) that used the February Range State map with the information that more recently revised maps are now available.

Continue reading

Status of Canadian polar bears updated map from Environment Canada

During a meeting of polar bear range states (Canada, Russia, Greenland, Norway, and the USA) in late January 2018 to discuss conservation issues, Canada — home to ~2/3 of the world’s polar bears — included in its presentation an updated population status and trend map approved by the Polar Bear Technical Committee in its presentation. This 2017 map replaces one from 2014 but is not yet available on the Environment Canada website.

Lunn et al 2016 EA cover image WH bear

UPDATE 11 June 2018: More recent versions of population and status assessment maps, published by Environment Canada 6 June 2018, conclude Southern Hudson Bay and Western Hudson Bay subpopulations have “likely declined.” See 11 June post here for more details and copies of the maps.

Contine reading

W Hudson Bay polar bears won’t have an early breakup year, according to sea ice charts

There is still a huge swath of highly concentrated thick first year ice (>1.2m) over most of Hudson Bay this week (19 June 2017) and even in the NW quadrant (the closest proxy we have for Western Hudson Bay), the weekly graph shows levels are greater than 2016, when WHB bears came off the ice in good condition about mid-July. All of which indicates 2017 won’t be an early sea ice breakup year for WHB polar bears.

Hudson Bay weekly ice stage of development 2017 June 19

There is thick first year ice (>1.2m, dark green) in patches along the west coast in the north and south. Thick first year ice also extends into Hudson Strait and Baffin Bay, with some medium first year ice (0.7-1.2m thick, bright green) along the central and southern coasts of WHB.  Note the red triangles incorporated into the thick ice of Hudson Strait in the chart above: those are icebergs from Greenland and/or Baffin Island glaciers. A similar phenomenon has been noted this year off northern Newfoundland, where very thick glacier ice became mixed with thick first year pack ice and were compacted against the shore by storm winds to create patches of sea ice 5-8 m thick.

Compare the above to what the ice looked like last year at this time (2016 20 June, below). There is more open water in the east this year (where few WHB bears would likely venture anyway) but less open water around Churchill and Wapusk National Park to the south than there was in 2016:

Hudson Bay ice age weekly at 20 June 2016

We won’t know for several more weeks if most WHB bears will come ashore at about the same time as last year (early to mid-July) or whether they will be in as good condition as they were last year (because winter conditions may not have been similar).

But so far, sea ice conditions are not looking as dire as the weekly “departure from normal” chart (below, 19 June 2017) might suggest (all that “less than normal” red and pink, oh no!!):

Hudson Bay weekly departure from normal 2017 June 19 Continue reading

Breakup of sea ice on track in Canada as critical feeding period for polar bears ends

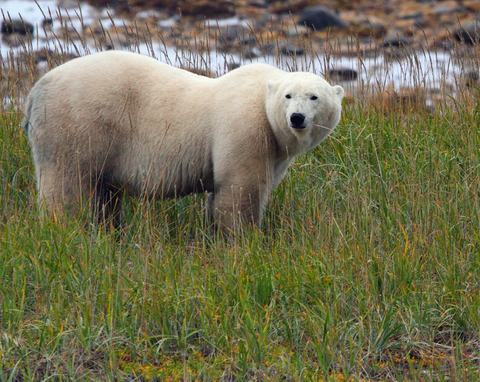
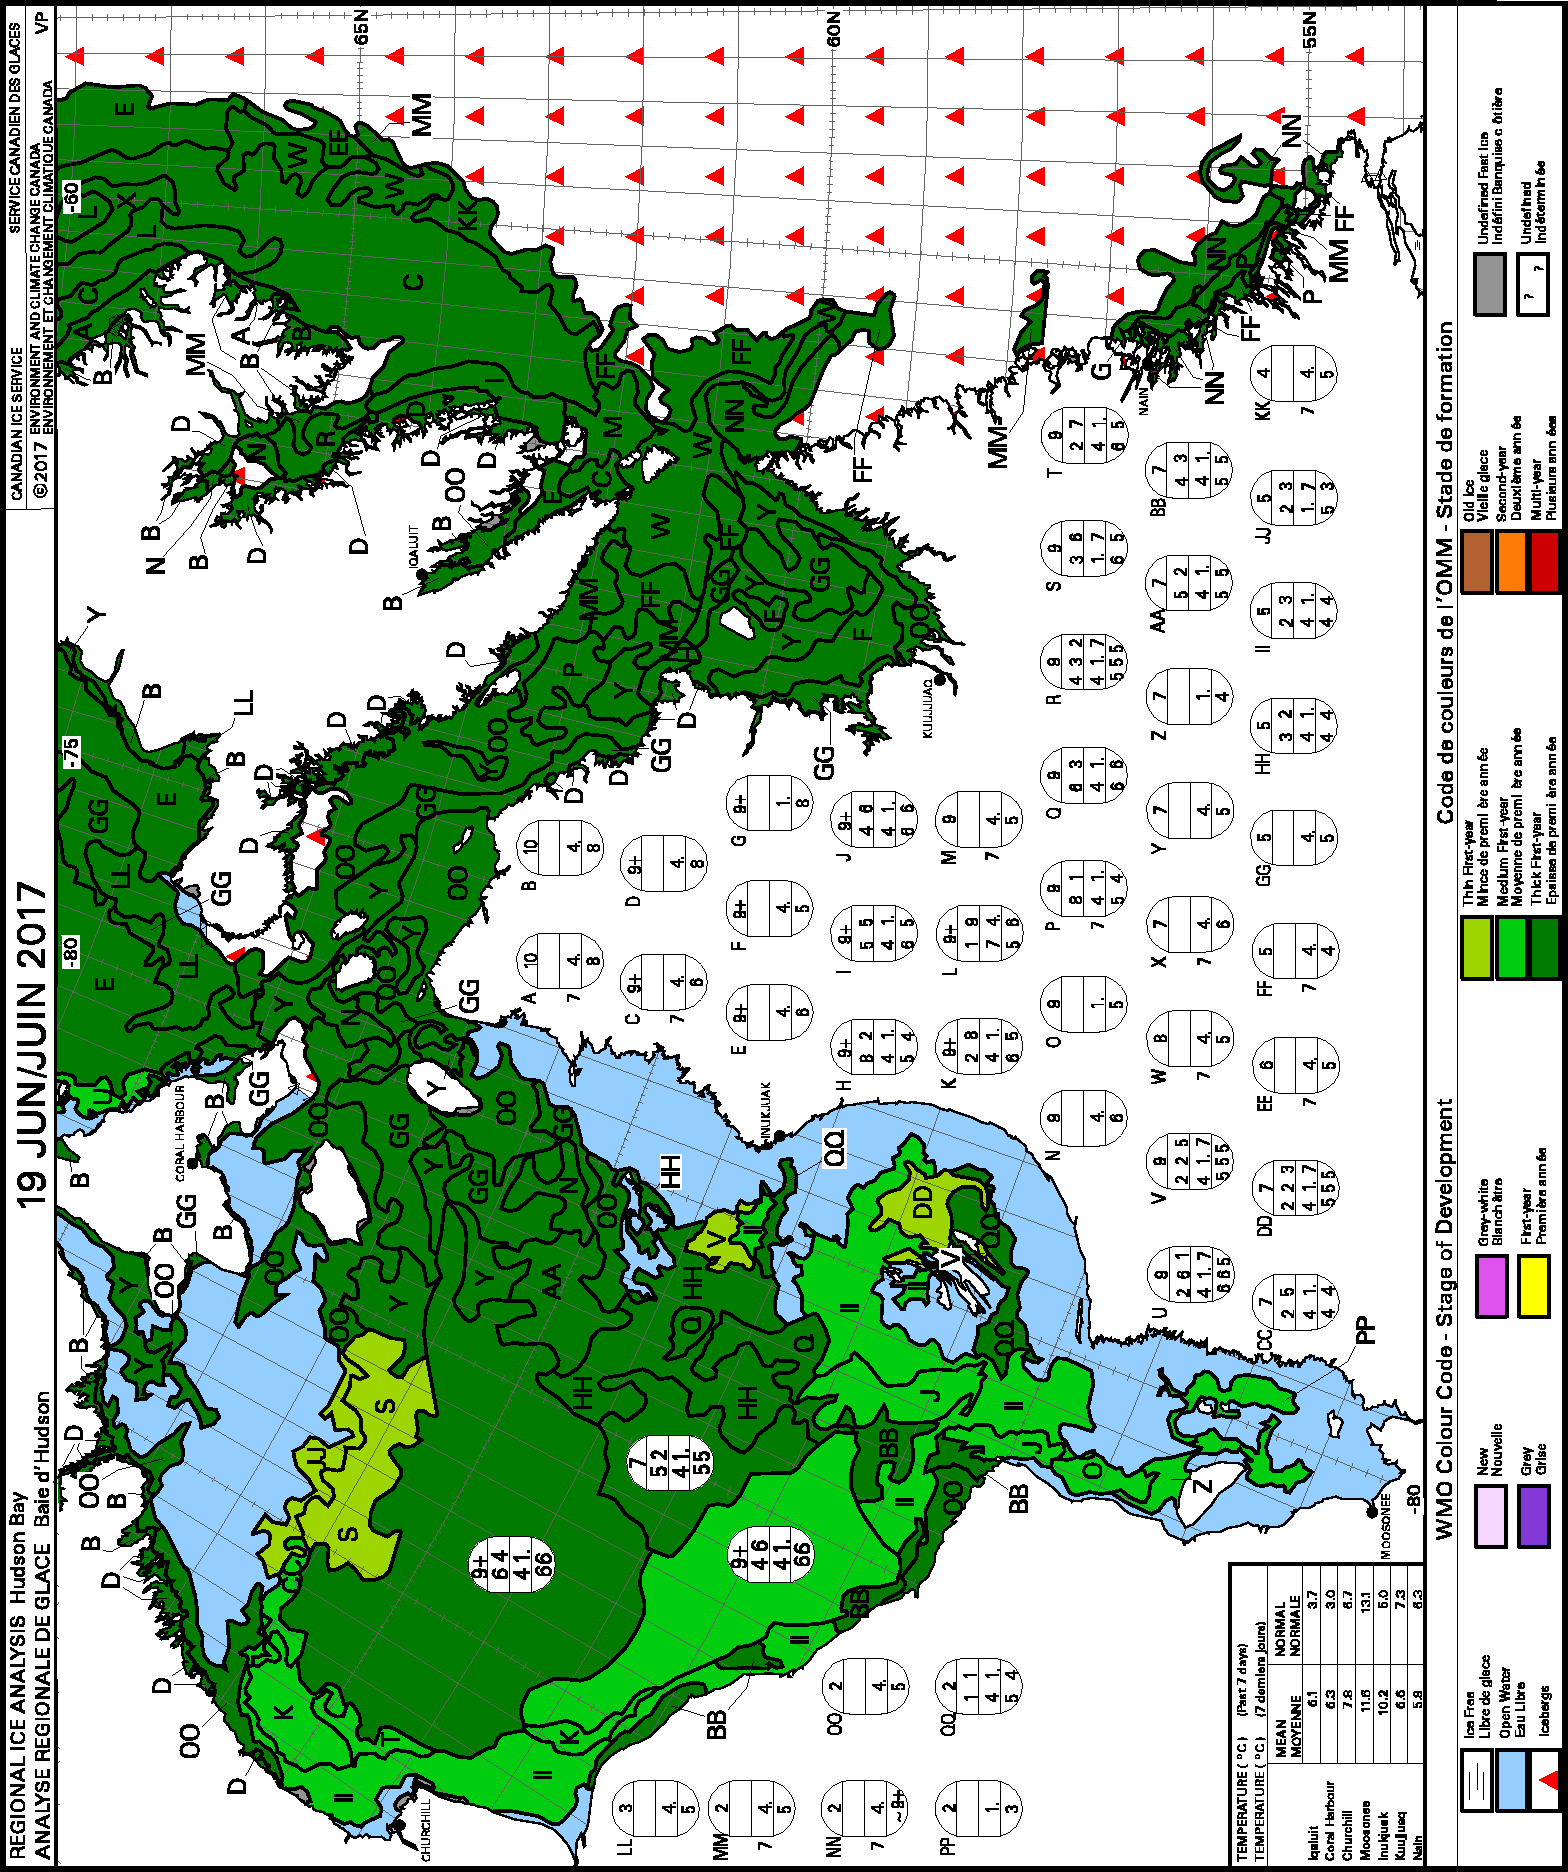
Relative to recent years and potential impacts on polar bear health and survival in Canada, there is nothing alarming in the pattern or speed of sea ice breakup for 2017, either over Hudson Bay, the southern Beaufort, or the eastern high Arctic.

Sea ice Canada 2017 June 8

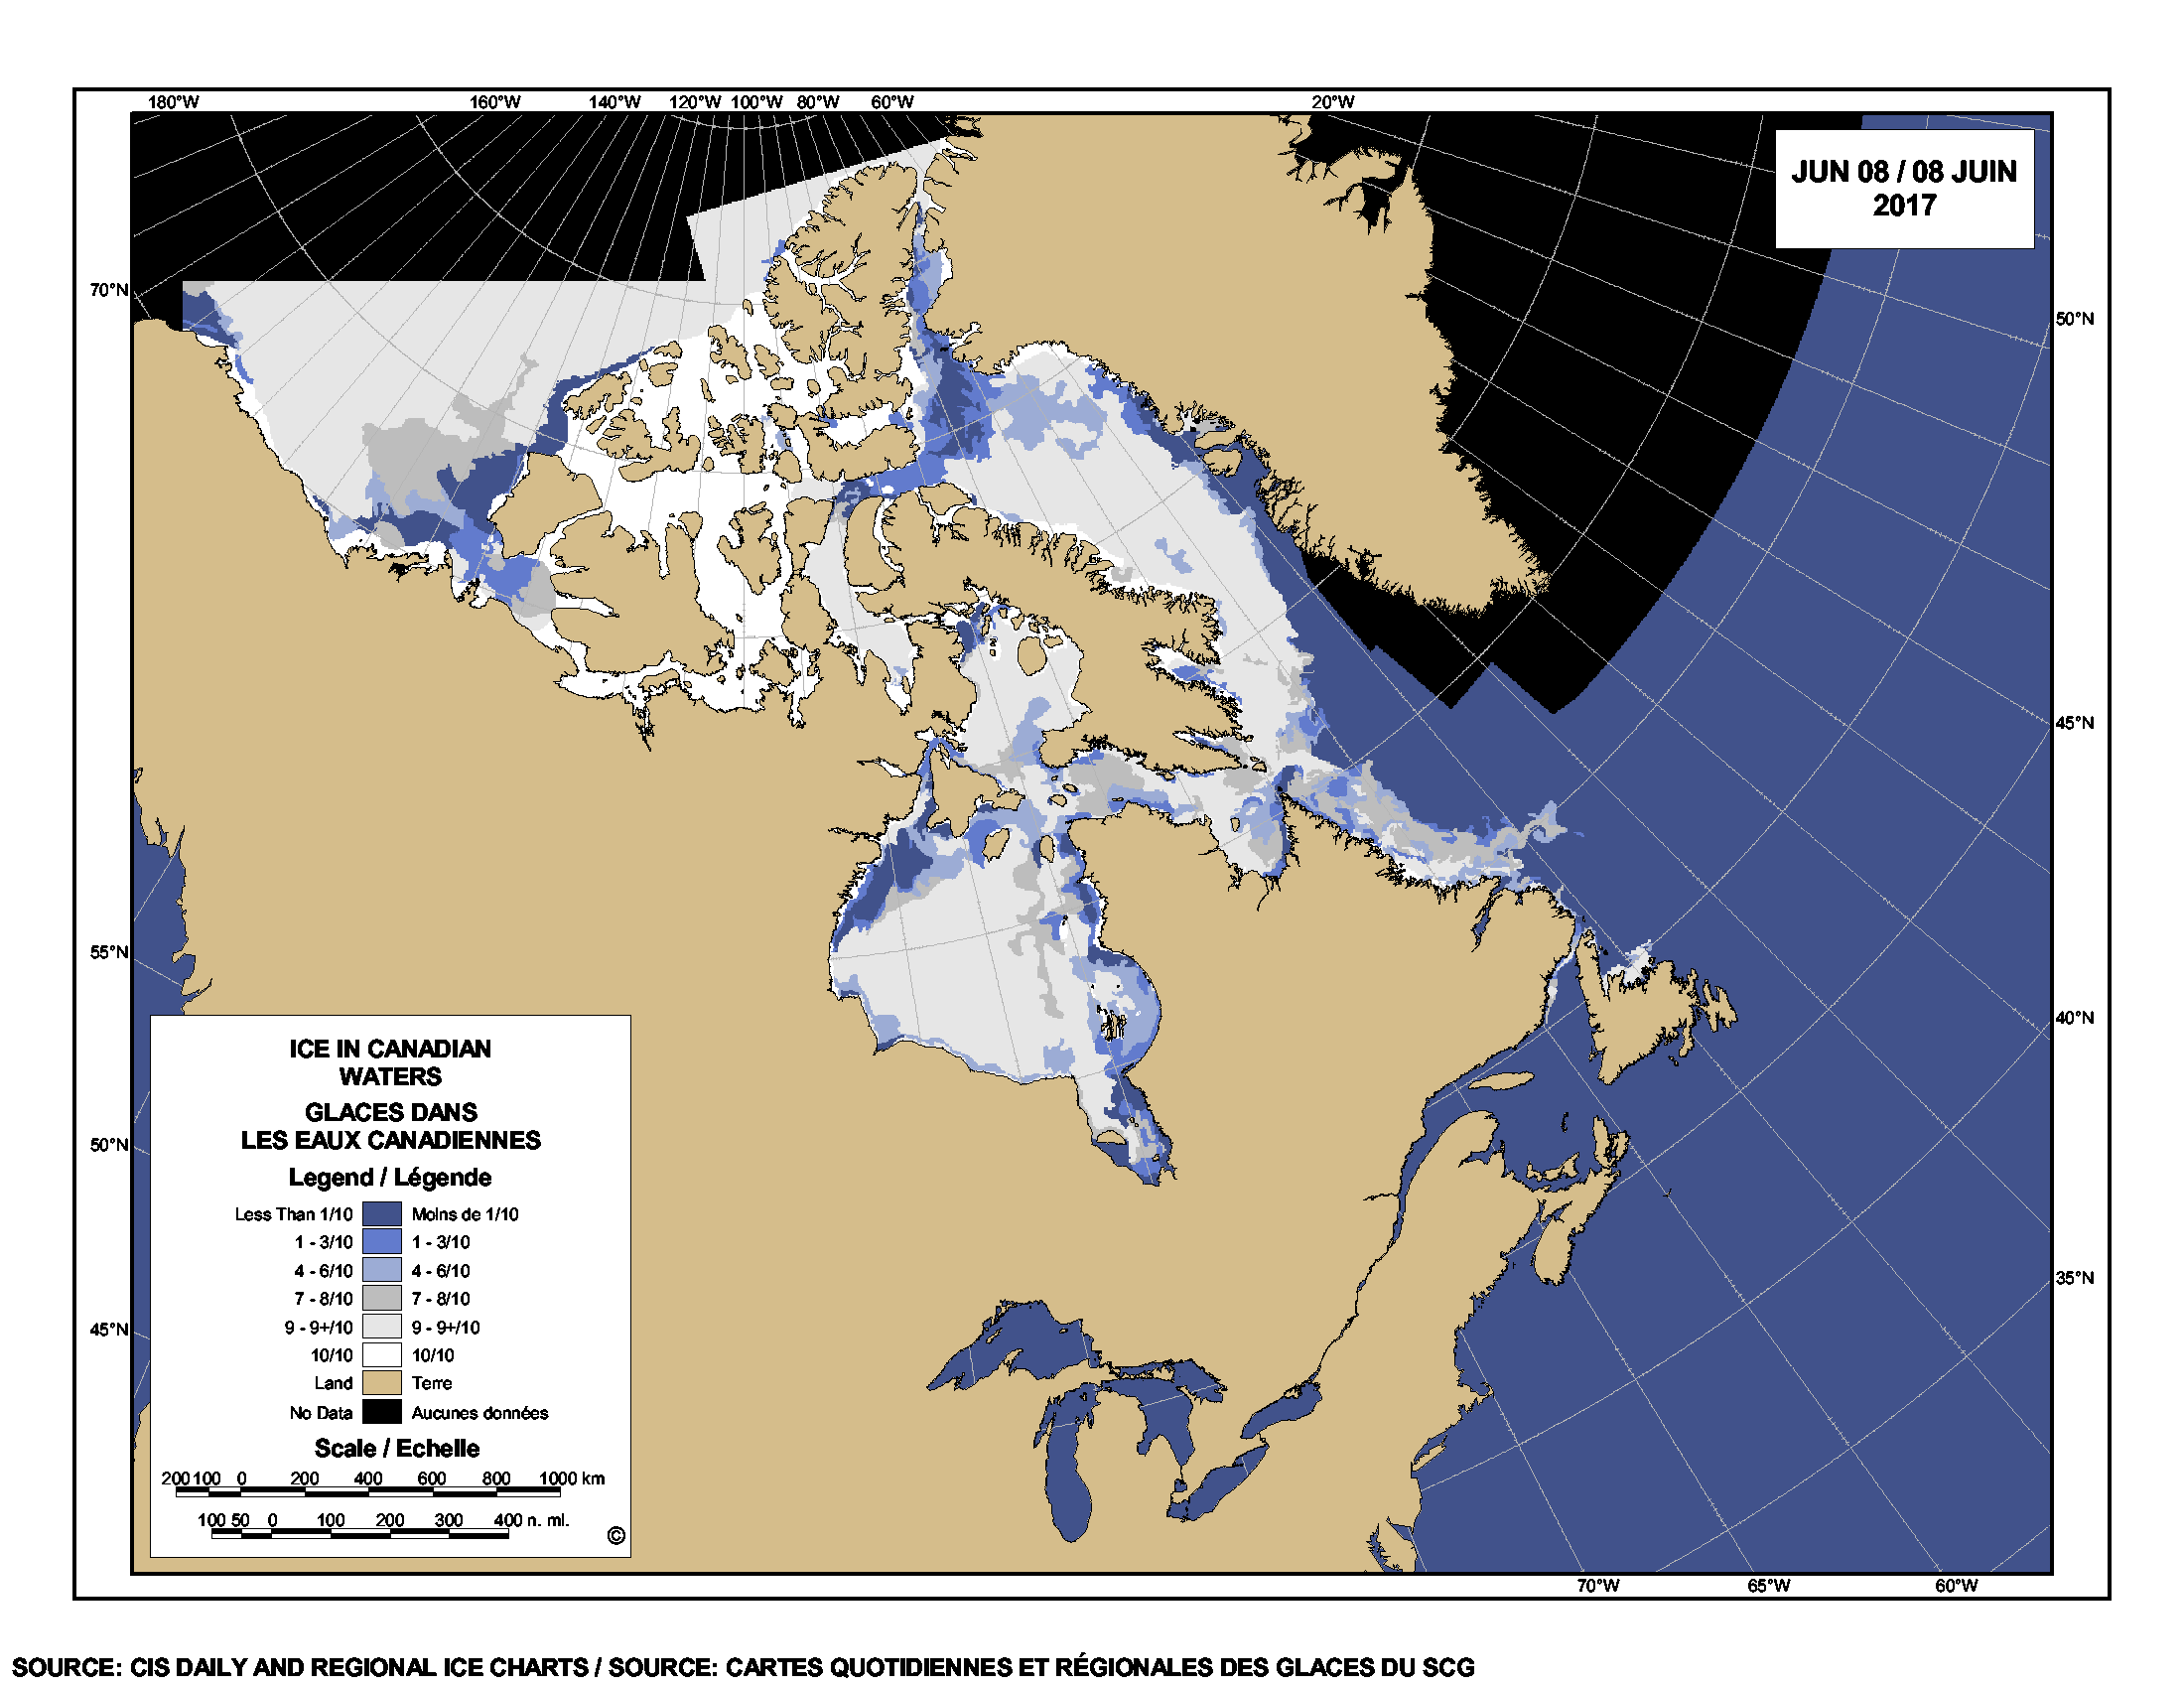
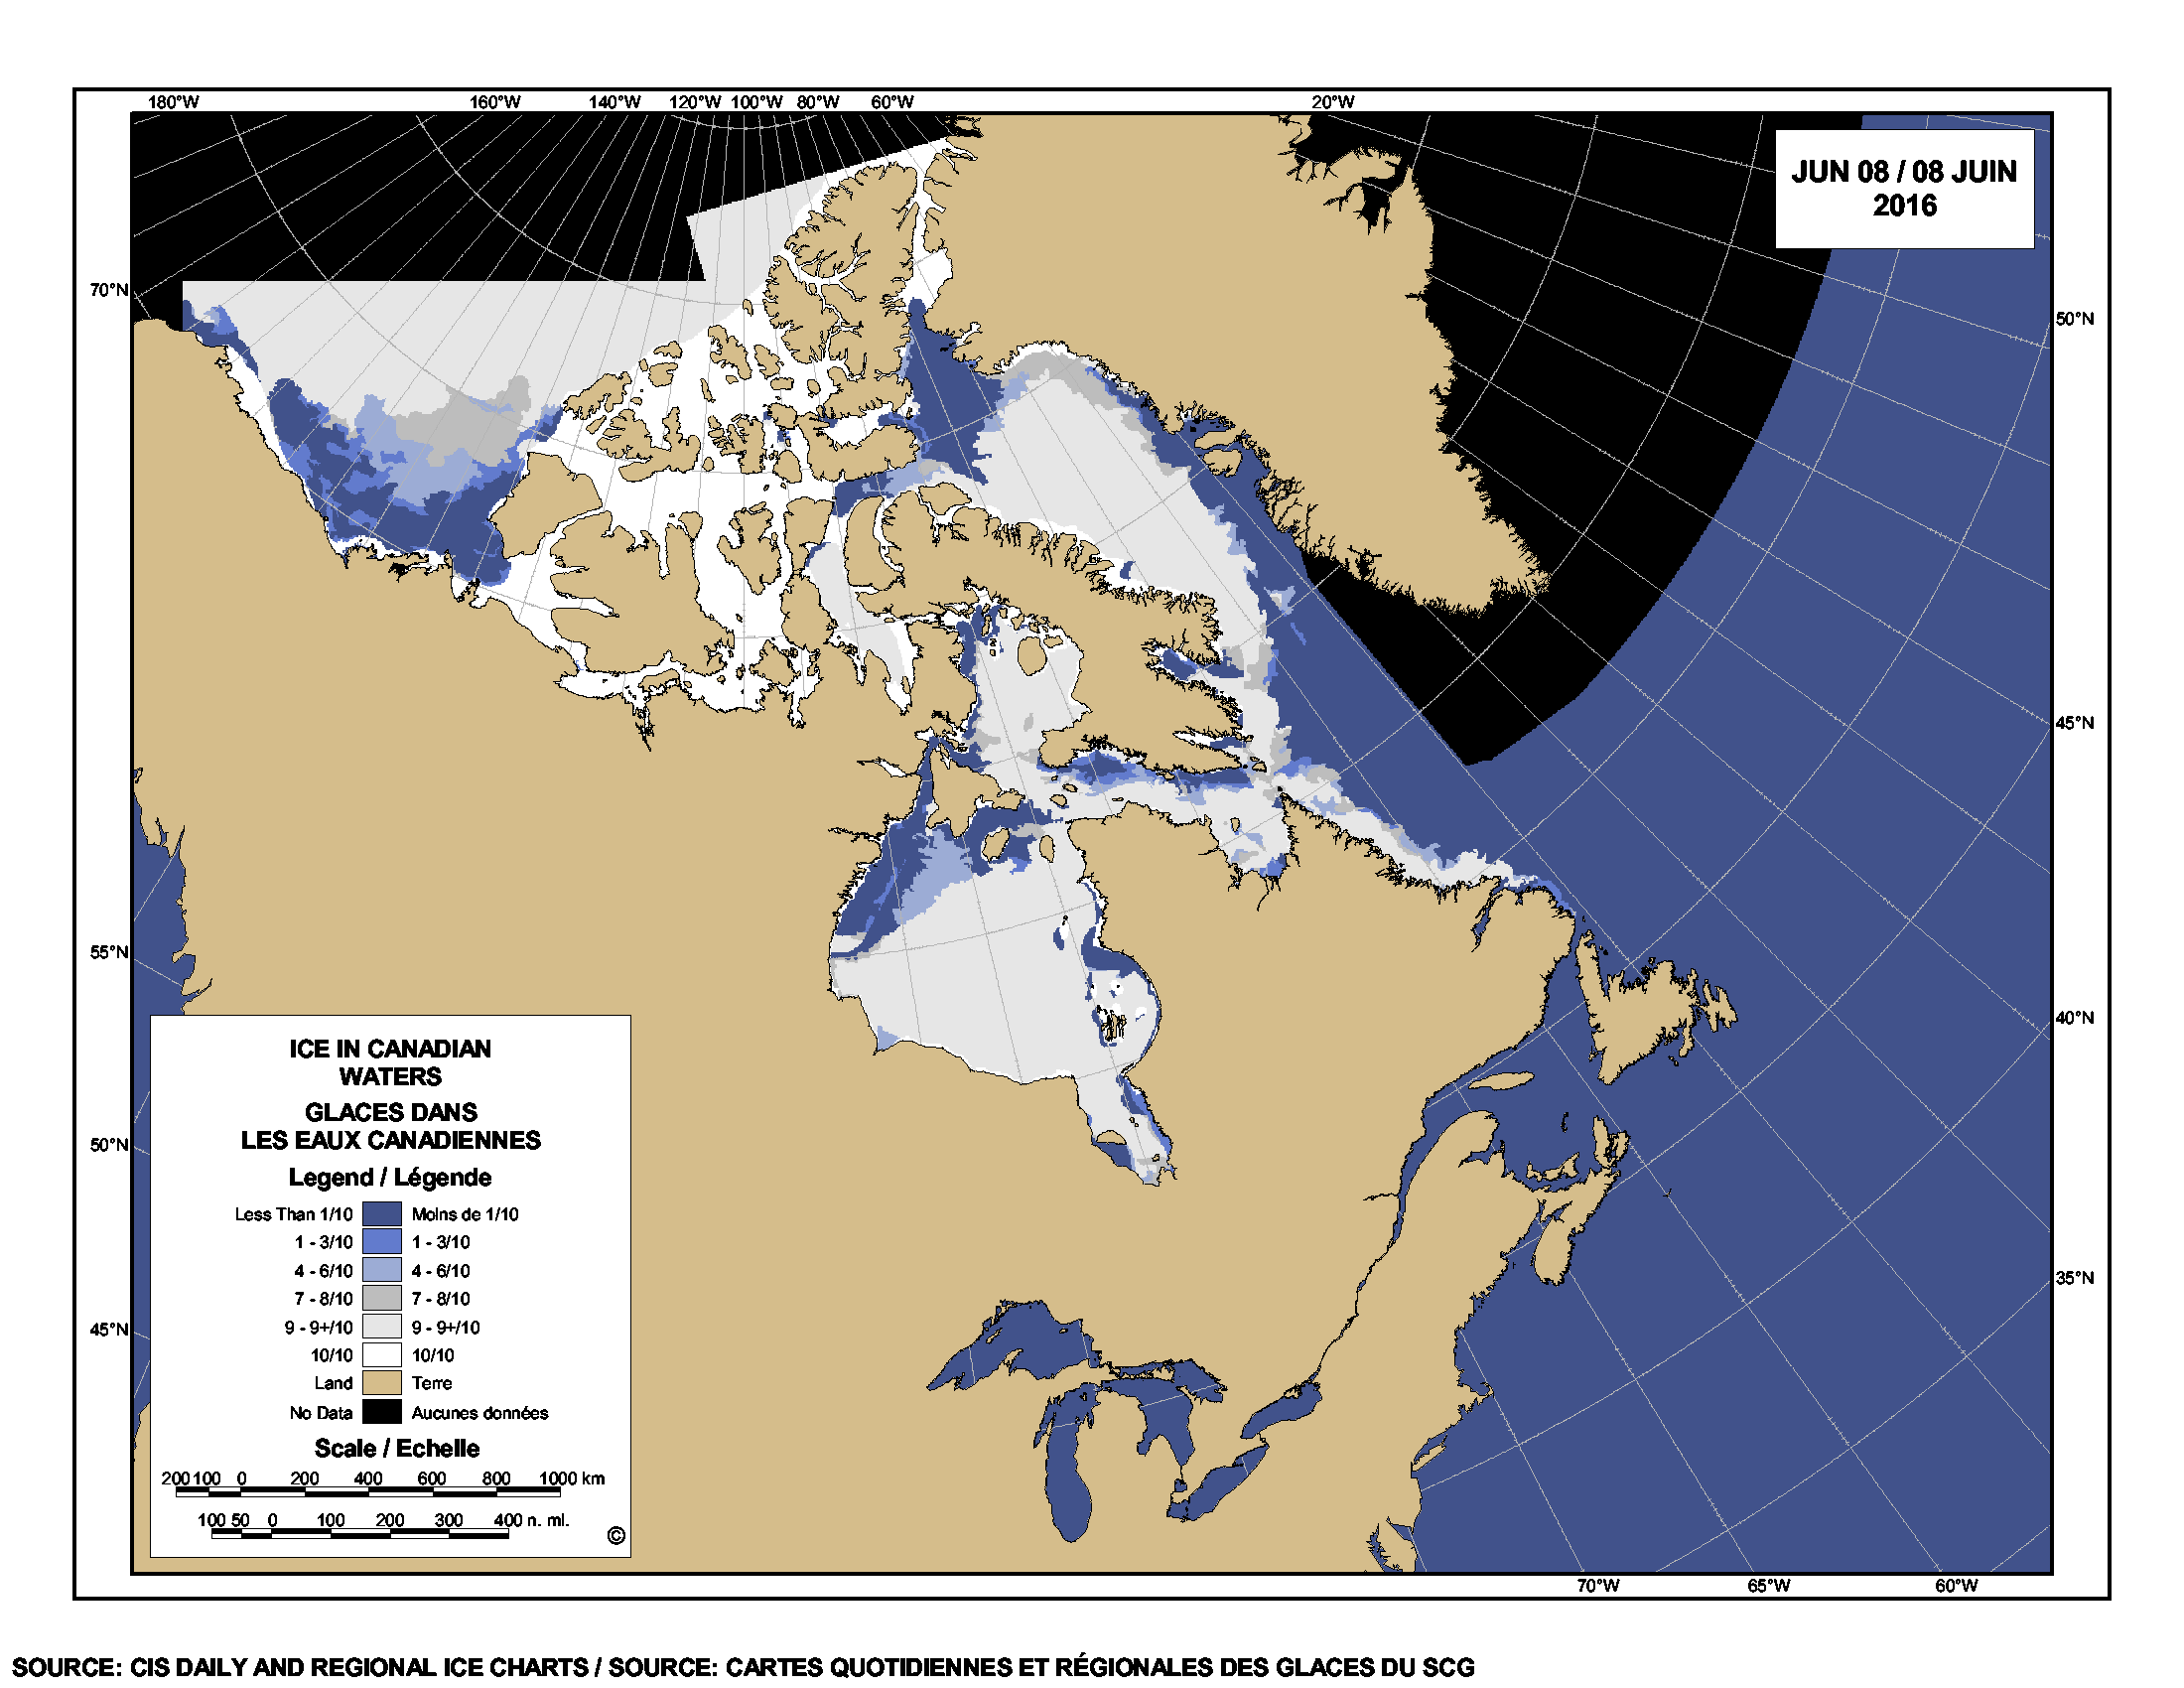
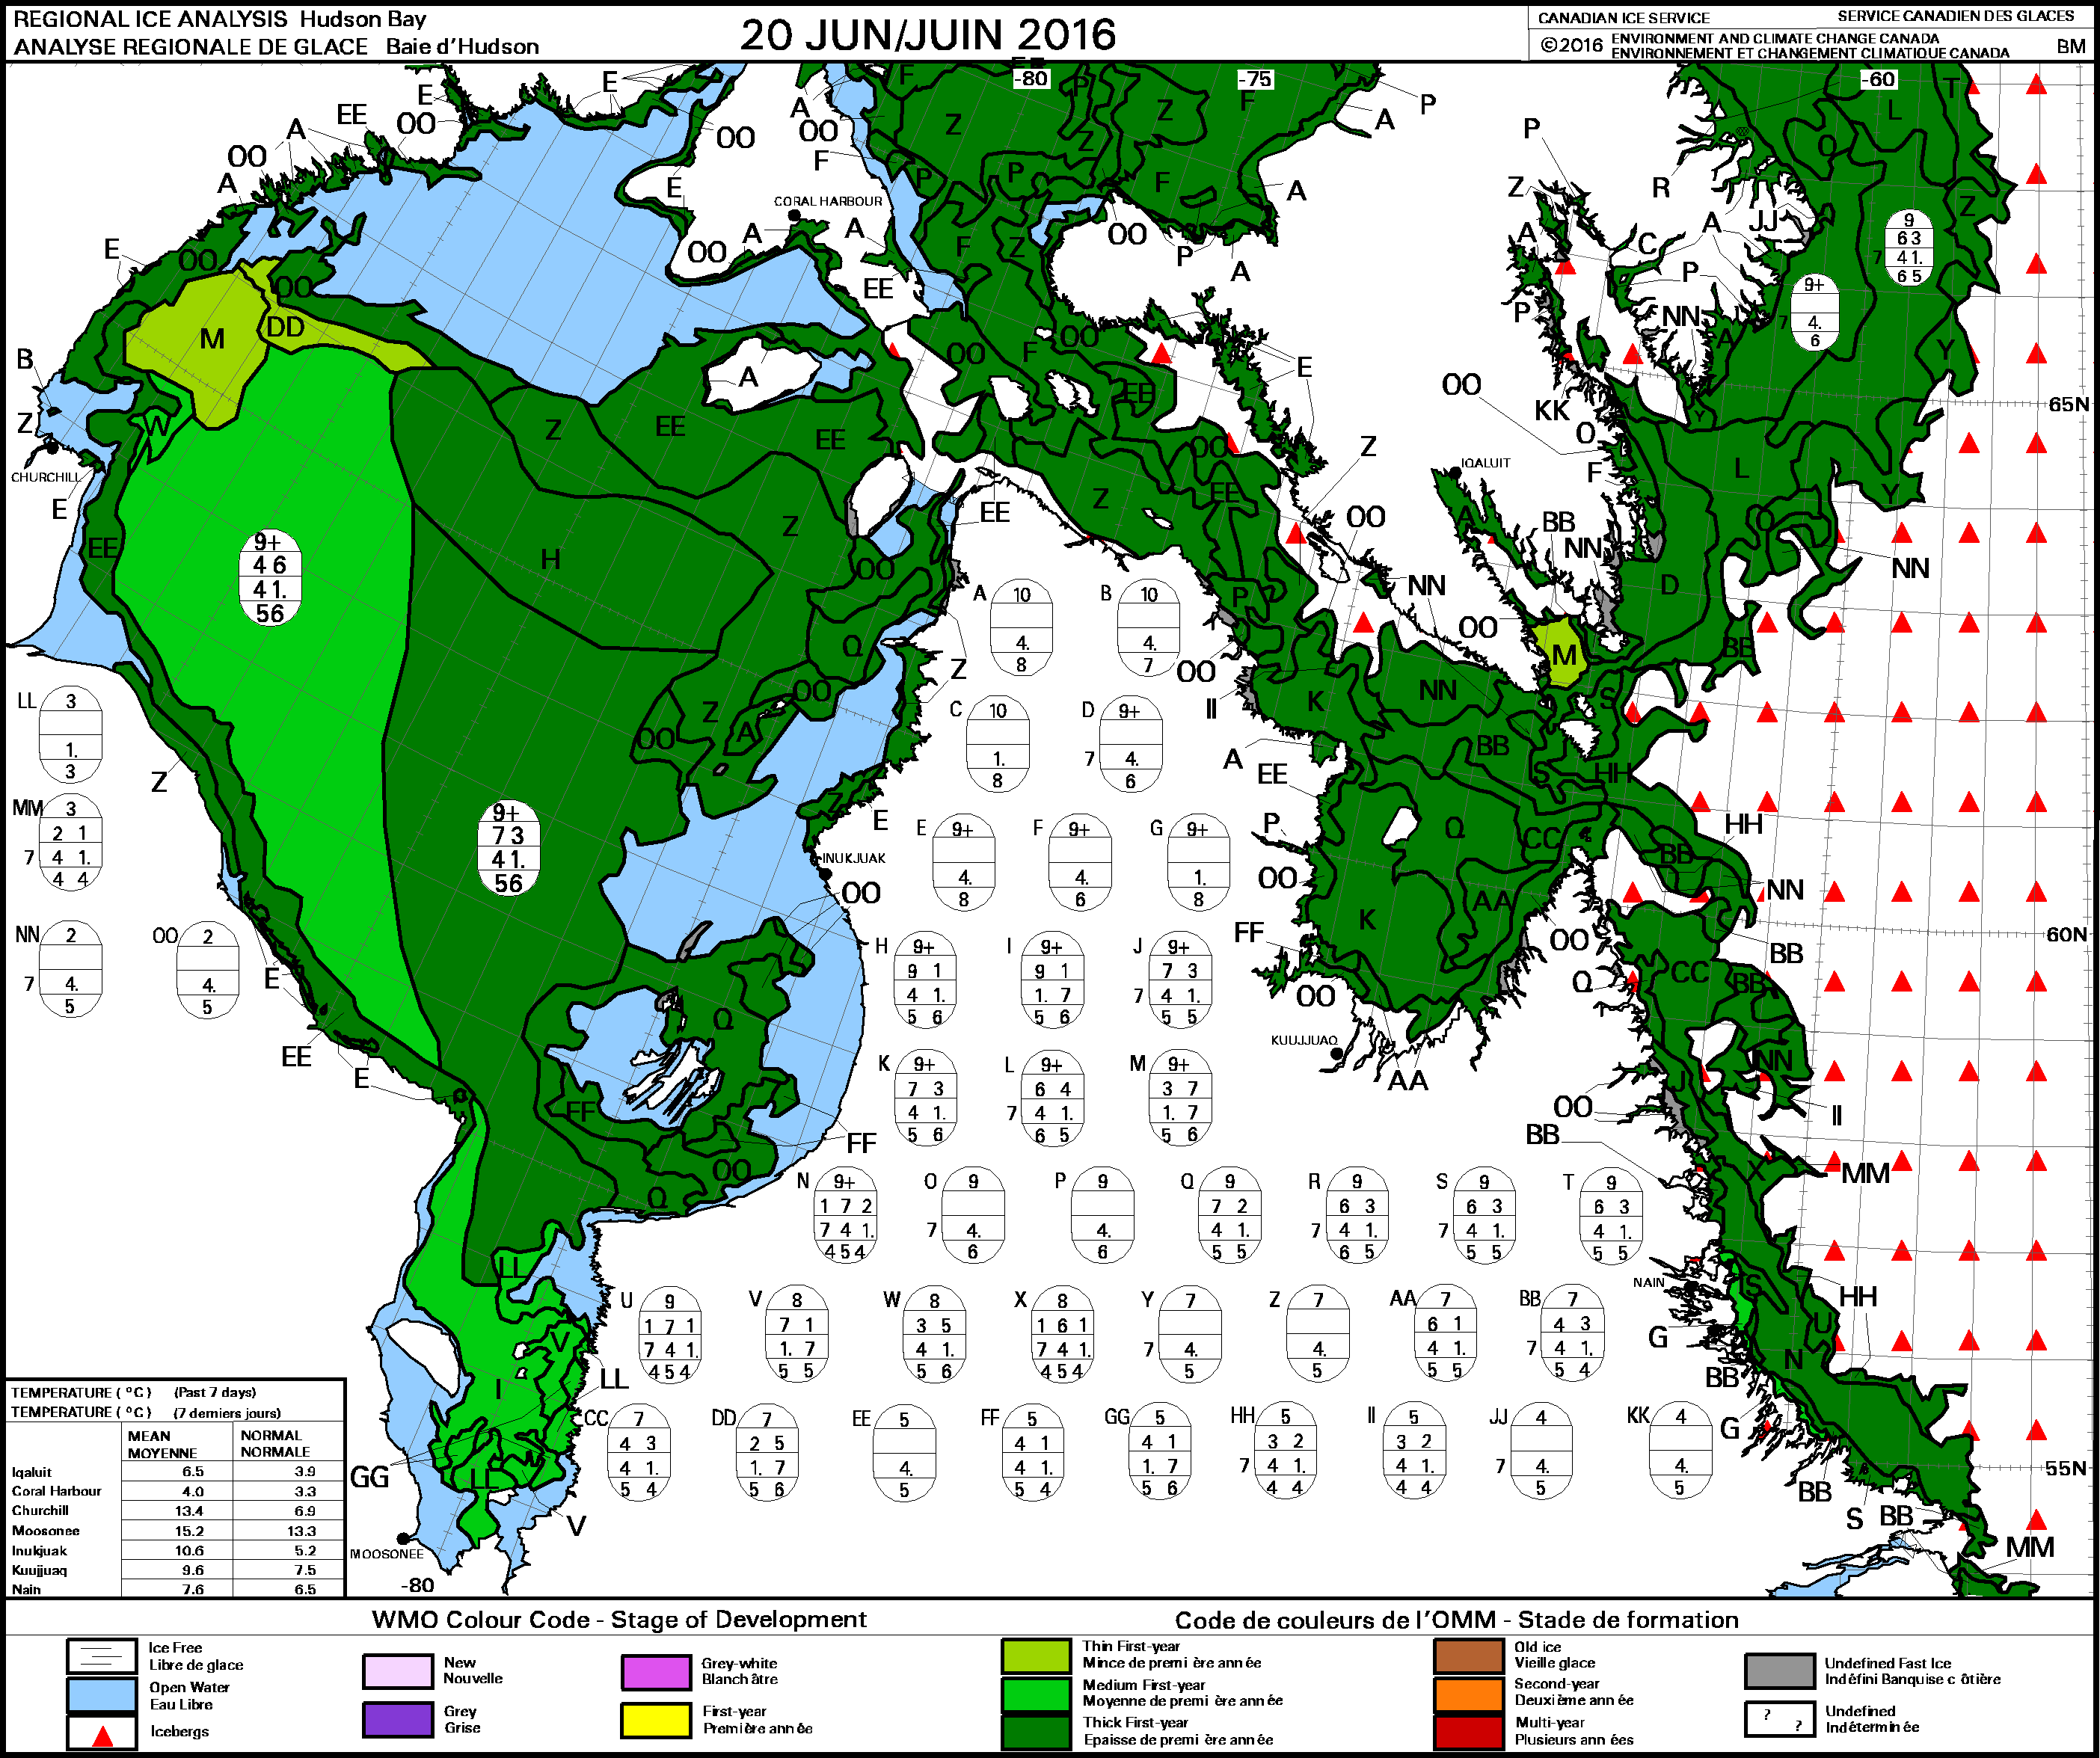
Last year at this time (see map below), there was more open water in Hudson Bay and in the Southern Beaufort yet the polar bears came ashore in fine shape that summer and there was no hue-and-cry of dying bears anywhere. Breakup this year is on track to be about 3 weeks earlier than it was in the 1980s, as it has been since at least 2001, a conclusion reached by polar bear specialists (Castro de la Guardia et al. 2017; Lunn et al. 2016), who examined sea ice breakup to 2015.

Sea ice extent Canada 2016 June 8 CIS

Here are critical words to remember (more details here) from biologist Martin Obbard and colleagues (2016:29) on the relationship between body condition and sea ice for Southern Hudson Bay (SH) polar bears, which apply equally well to bears in other regions:

Date of freeze-up had a stronger influence on subsequent body condition than date of break-up in our study. Though models with date of freeze-up were supported over models with other ice covariates, we acknowledge that lower variability in freeze-up dates than in ice duration or break-up dates could have influenced the model selection process. Nevertheless, we suggest that a stronger effect of date of freeze-up may be because even though break-up has advanced by up to 3-4 weeks in portions of Hudson Bay it still occurs no earlier than late June or early July so does not yet interfere with opportunities to feed on neonate ringed seal pups that are born in March-April in eastern Hudson Bay (Chambellant 2010). Therefore, losing days or weeks of hunting opportunities during June and July deprives polar bears of the opportunity to feed on adult seals, but does not deprive them of the critical spring period (Watts and Hansen 1987) when they are truly hyperphagic. No doubt, the loss of hunting opportunities to kill adult seals has a negative effect on body condition, but it appears that for bears in SH a forced extension of the fast in late fall has a greater negative effect on subsequent body condition.” [my bold]

In other words, by mid-June at least (maybe earlier), polar bears have largely finished their intensive feeding that’s so critical to their survival over the rest of the year.

That’s why the latest count of SH polar bears (Obbard et al. 2015) showed a stable population (and see this recent post on WHB polar population estimates). But freeze-up was late last year and that’s what will make the difference to polar bears over the coming year.

Continue reading

Late winter polar bear habitat 2017 vs. 2006 and 2011 shows no trend

Here is a bit of historical perspective for rational readers trying to make sense of the doom-mongering of others that current sea ice conditions spell trouble for polar bears, given that the winter maximum extent for 2017 reached a new seasonal low (keeping in mind that NSIDC does not publish error bars for these measurements, which helps elevate such pronouncements to “news”).

Ice extent (courtesy NSIDC’s MASIE) at 25 March (Day 84) is below for 2017, 2011 and 2006, almost 3 weeks after the winter maximum was declared at 7 March for 2017, 9 March for  2011, and 12 March for 2006. Extent at the maximum for 2006 was estimated at 14.68 mkm2, 14.42 mkm2 for 2017, and 14.67 mkm2 in 2011 (what tiny differences make headlines these days).

Remember: there are no polar bears in the Sea of Okhotsk or in the Baltic Sea (marked with an * below) yet ice in those regions is included in the Arctic totals used to determine maximum seasonal extent. Much (and sometimes, all) of the “Arctic” variation in extent at this time of year is accounted for by variation in Sea of Okhotsk and Baltic Sea coverage.

Sea ice day 84 March 25 2017_2011_2006 labeled

Bottom line: total winter ice extent for the Arctic ≠ winter polar bear habitat and neither have changed much in a decade.

See close up of the above graphic below.

Continue reading