
In this part of my critique of Stirling and Parkinson (2006), regarding breakup dates in Western Hudson Bay (see Part I here), I will show that these authors also left out critical data.
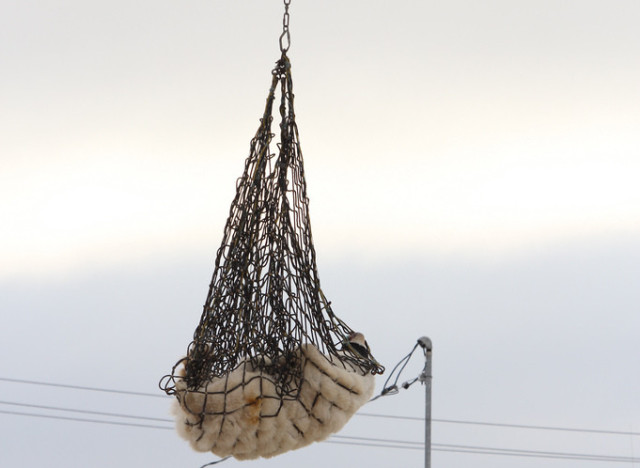
Figure 1. A bear is transported to Churchill’s polar bear holding facility, from a 2011 Huffington Post article “Polar Bear Prison.”
Their correlation between number of problem bears in Churchill and breakup dates for WHB worked because some very inconvenient data were simply left out: problem bear data for 1983 and 2004.
Inclusion of that information would have shown 1983 and 2004 were two of the worst years for polar bear problems in recent history despite being late breakup years (1983 also had the last human fatality from a polar bear attack). They could have explained why they did not use the data but they did not — they simply left it out.
Amazingly, this work is being touted as “evidence” that global warming is harming Western Hudson Bay polar bears.
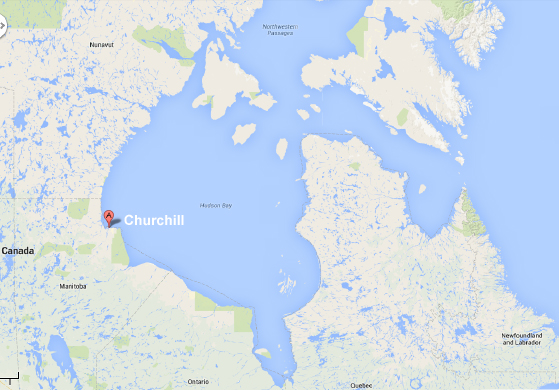
Figure 2. Location of Churchill, Manitoba. Google Maps.
Number of Problem Bears in Churchill, 1984-2003
After attempting to show that declining polar bear weights and earlier breakup dates in Western Hudson Bay between 1980 and 2004 were correlated enough to suggest a causal relationship (even though individual data points did not), the authors then presented another putative metric of polar bear health in this region: the number of problem bears handled by Conservation Officers in Churchill, Manitoba (Fig. 3).
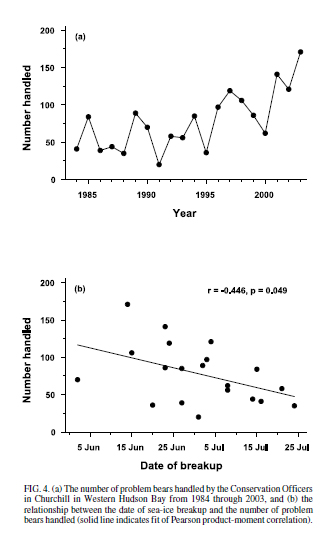
Figure 3. Graph from Stirling and Parkinson (2006:267, Fig. 4a) showing the number of problem bears handled by Conservation Officers in Churchill, Manitoba. Note the graph starts at 1984 and ends in 2003, although the study period for body condition (see Fig. 2) was 1980-2004.
The authors concluded:
“The number of problem bears being handled by Conservation Officers at Churchill in Western Hudson Bay has increased dramatically over the past decade (Fig. 4a), and there is a statistically significant relationship between the date of breakup of the sea ice and the number of bears handled (i.e., the earlier the ice breaks up, the more problem bears there are, and conversely) (Fig. 4b).
…
Since the progressively earlier breakup is also significantly correlated with a decline in the bears’ physical condition (Stirling et al., 1999), it seems clear that many bears, especially subadults, are exhausting their stored body fat before freeze-up when they can return to the ice and hunt seals.” [my bold]
But why does the graph they provided (Fig. 3) not begin until 1984, while their body condition data started in 1980 – and why is 2004 left out?
The table below (Fig. 4), from a summary paper by Stephen Kearney (Kearney 1989:88) on the Polar Bear Alert Program at Churchill, suggests an explanation for the first part: 1983 had one of the highest numbers of bears handled between 1969 and 1986.

Figure 4. From Kearney 1989 (his Table 1), the number of reported occurrences of polar bears and number of bears handled in the Churchill area, 1969 to 1986. 1983 (marked) had the highest numbers of problem bears handled for this period.
Note that the numbers of bears handled in 1984 (18, from Kearney’s table, Fig. 4 above), is less than half the number shown in Fig. 3 (~40) from Stirling and Parkinson’s paper; a similar pattern is true for 1985 and 1986.
This suggests that Stirling and Parkinson included bears not counted by Kearney for 1984-86, and that if problem bears for 1983 had been included in their graph, its dot would be somewhere between 100 and 200 – perhaps even higher than the dot marking the number of problem bears in 2003.
But that’s not the only reason that 1983 was left out.
1983 was a late breakup/late freeze-up year
Apparently, by many measures, 1983 may have been “the worst year ever” for Churchill polar bears but not because it was an early breakup year.
It turns out that 1983 had one of the latest breakup dates in the entire 1979-2004 record (Fig. 5), which also coincided with one of the highest numbers of problem bears in Churchill – 1983 also was the year when the last human fatality caused by a polar bear occurred. There were also a lot of bears in poor condition (Ramsay and Stirling 1988), see Fig 6.
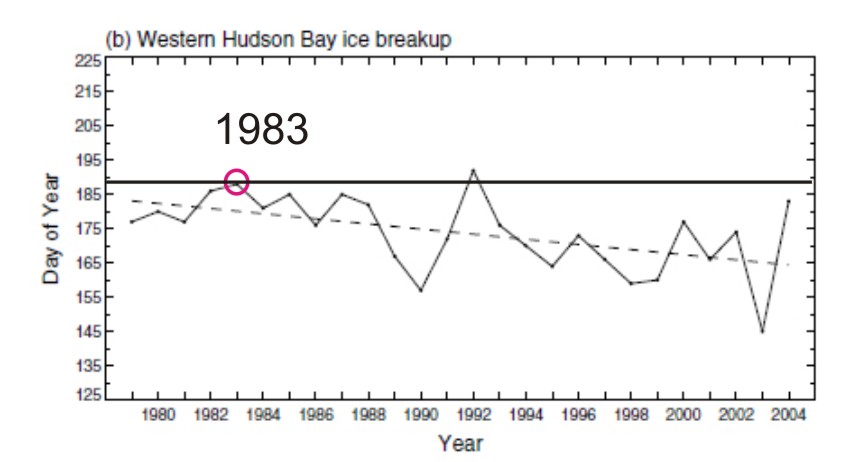
Figure 5. Graph from Stirling and Parkinson (2006:265) depicting breakup dates for Western Hudson Bay from 1979 to 2004, using the old 50% ice cover threshold for “breakup” (30% is now considered the level most pertinent for polar bears). Dashed line is the trend line fit by linear regression. Note that the solid line (added by me) indicates that 1983 had the second-latest breakup date in this period, a fact not mentioned in the paper.
This is what Canadian researchers had to say about that time, reported in the 1985 Polar Bear Specialist Group report (Calvert et al. 1986:19 and 24):
“In 1983, the Polar Bear Control Programme began in late August and continued until early December. Bear numbers in the Churchill area were extremely high during the last three weeks of the period. By December 4, the sea ice had formed and most of the bears had left. [freeze-up date confirmed in Stirling et al. 1999:29]
Nearly 300 man -days were required to respond to 191 calls (76 in 1982) regarding polar bear problems. From November 24 – December I, 84 calls were received. Only three incidents resulted in property damage totalling $1050. However, two incidents resulted in personal injury and death. The arm of a photographer from Wisconsin was severely mangled by a bear during a tour to Cape Churchill. About two weeks later, a Churchill resident was killed by a bear near the burned ruins of the Churchill Hotel.
Problem bears were captured at the garbage dump, in Churchill, and at Camp Nanuk. Of the total 41 problem bears live-captured and placed in D-20, 19 were culvert-trapped (compared to 5 in 1982) and 22 free-ranged (1 in 1982). Nine problem bears were moved north of Churchill by helicopter in order to make more room in D -20.
In 1984, the Polar Bear Control Programme season in Churchill was from 1 September to 2 November, more than a month shorter than the 1983 season. There were 69 reported incidents, and 200 man-days expended. There was one serious encounter – a mauling in which there appeared to be extenuating circumstances.” [my bold]
Below are some quotes from a first-hand account of that time, with some notes on a few inaccuracies.
It comes from an essay by Ian Thorleifson, “1983 – The Worst Year Ever for Western Hudson Bay Polar Bears,” 16 February, 2011, ChurchillWild:
“My knowledge of 1983 is first hand. I was in charge of the Polar Bear Alert Program that year, and I was working as a biologist for Manitoba Wildlife Branch, and with the very capable crew from Ian Stirling’s group of the Canadian Wildlife Service.
…
The winter of 1982-83 saw very heavy snowfall accumulating in SWHB, so heavy one could imagine the bears having a challenge getting through to the seals. When the bears were forced ashore, they were in “ok” condition, but not really fat. But they were early – by the first two weeks of July the ice had broken up and quickly melted completely out of the Bay.
[SJC note: Breakup was not actually early that year but relatively late (see Figure 4 above and this July post), but freeze-up was also late]
…
By November, there were a lot of bears around – and far too many were getting very skinny. …Eight bears were shot by local people in self-defense. On November 29, a man was killed on the main street of Churchill by a young male bear. The Polar Bear Alert crew was handling as many as 15 bears a day. Walking skeletons were seen too often. [my bold, my notes]
Read the entire account here.
The “walking skeletons” comment is corroborated by Ramsay and Stirling (1988) – see Fig. 6 below – although this fact was not mentioned in the PBSG report for that period (Calvert et al. 1986). Note the “fifteen problem” bears a day.”
No wonder the number of bears measured for this study was not given and the graph showing the total number of problem bears handled (Fig. 3) begins at 1984 rather than 1980.
Problem bear numbers for 1983, during a year when breakup was late, would have really put a crimp in their trend lines, so they simply left 1983 and the two previous years out.
And that is perhaps also why problem bear data for 2004 was left out as well, since it was also a relatively late breakup year, as discussed below.

Figure 6. The female above had three cubs-of-the year in November of 1983 and weighed only 99 kg – by the following July she had either weaned those cubs or, more probably, lost them all and was pregnant again. By July 1984, she’d recovered and was weighed at 410 kgs. But as fat as this female was, it was nowhere near the fattest on record for Western Hudson Bay: Derocher et al. (1992) documented one pregnant female that weighed 505 kg on 21 September between 1982 and 1990. From Ramsay and Stirling 1988:614-615).
What about 2004?
A few years later, Towns et al. (2009) undertook a similar study to Stirling and Parkinson but different enough that you can’t compare the two: they compared a revised number of problem bears in Churchill from 1970 to 2004 to freeeze-up dates from 1971 to 2003.
Towns and colleagues said the early problem bear data from Kearney (1989) was “incomplete” for their purposes, so they excluded it. How convenient.
They looked at a specific “core” area of Churchill only – but even then – as Fig. 7 below shows, the number of problem bears documented in 1983 was quite high, although not as high as 2003 (which had highest number of problem bears in the study). Note that 2004 had a higher number of problem bears than 1983, yet according to Stirling and Parkinson, 2004 was a late breakup year.
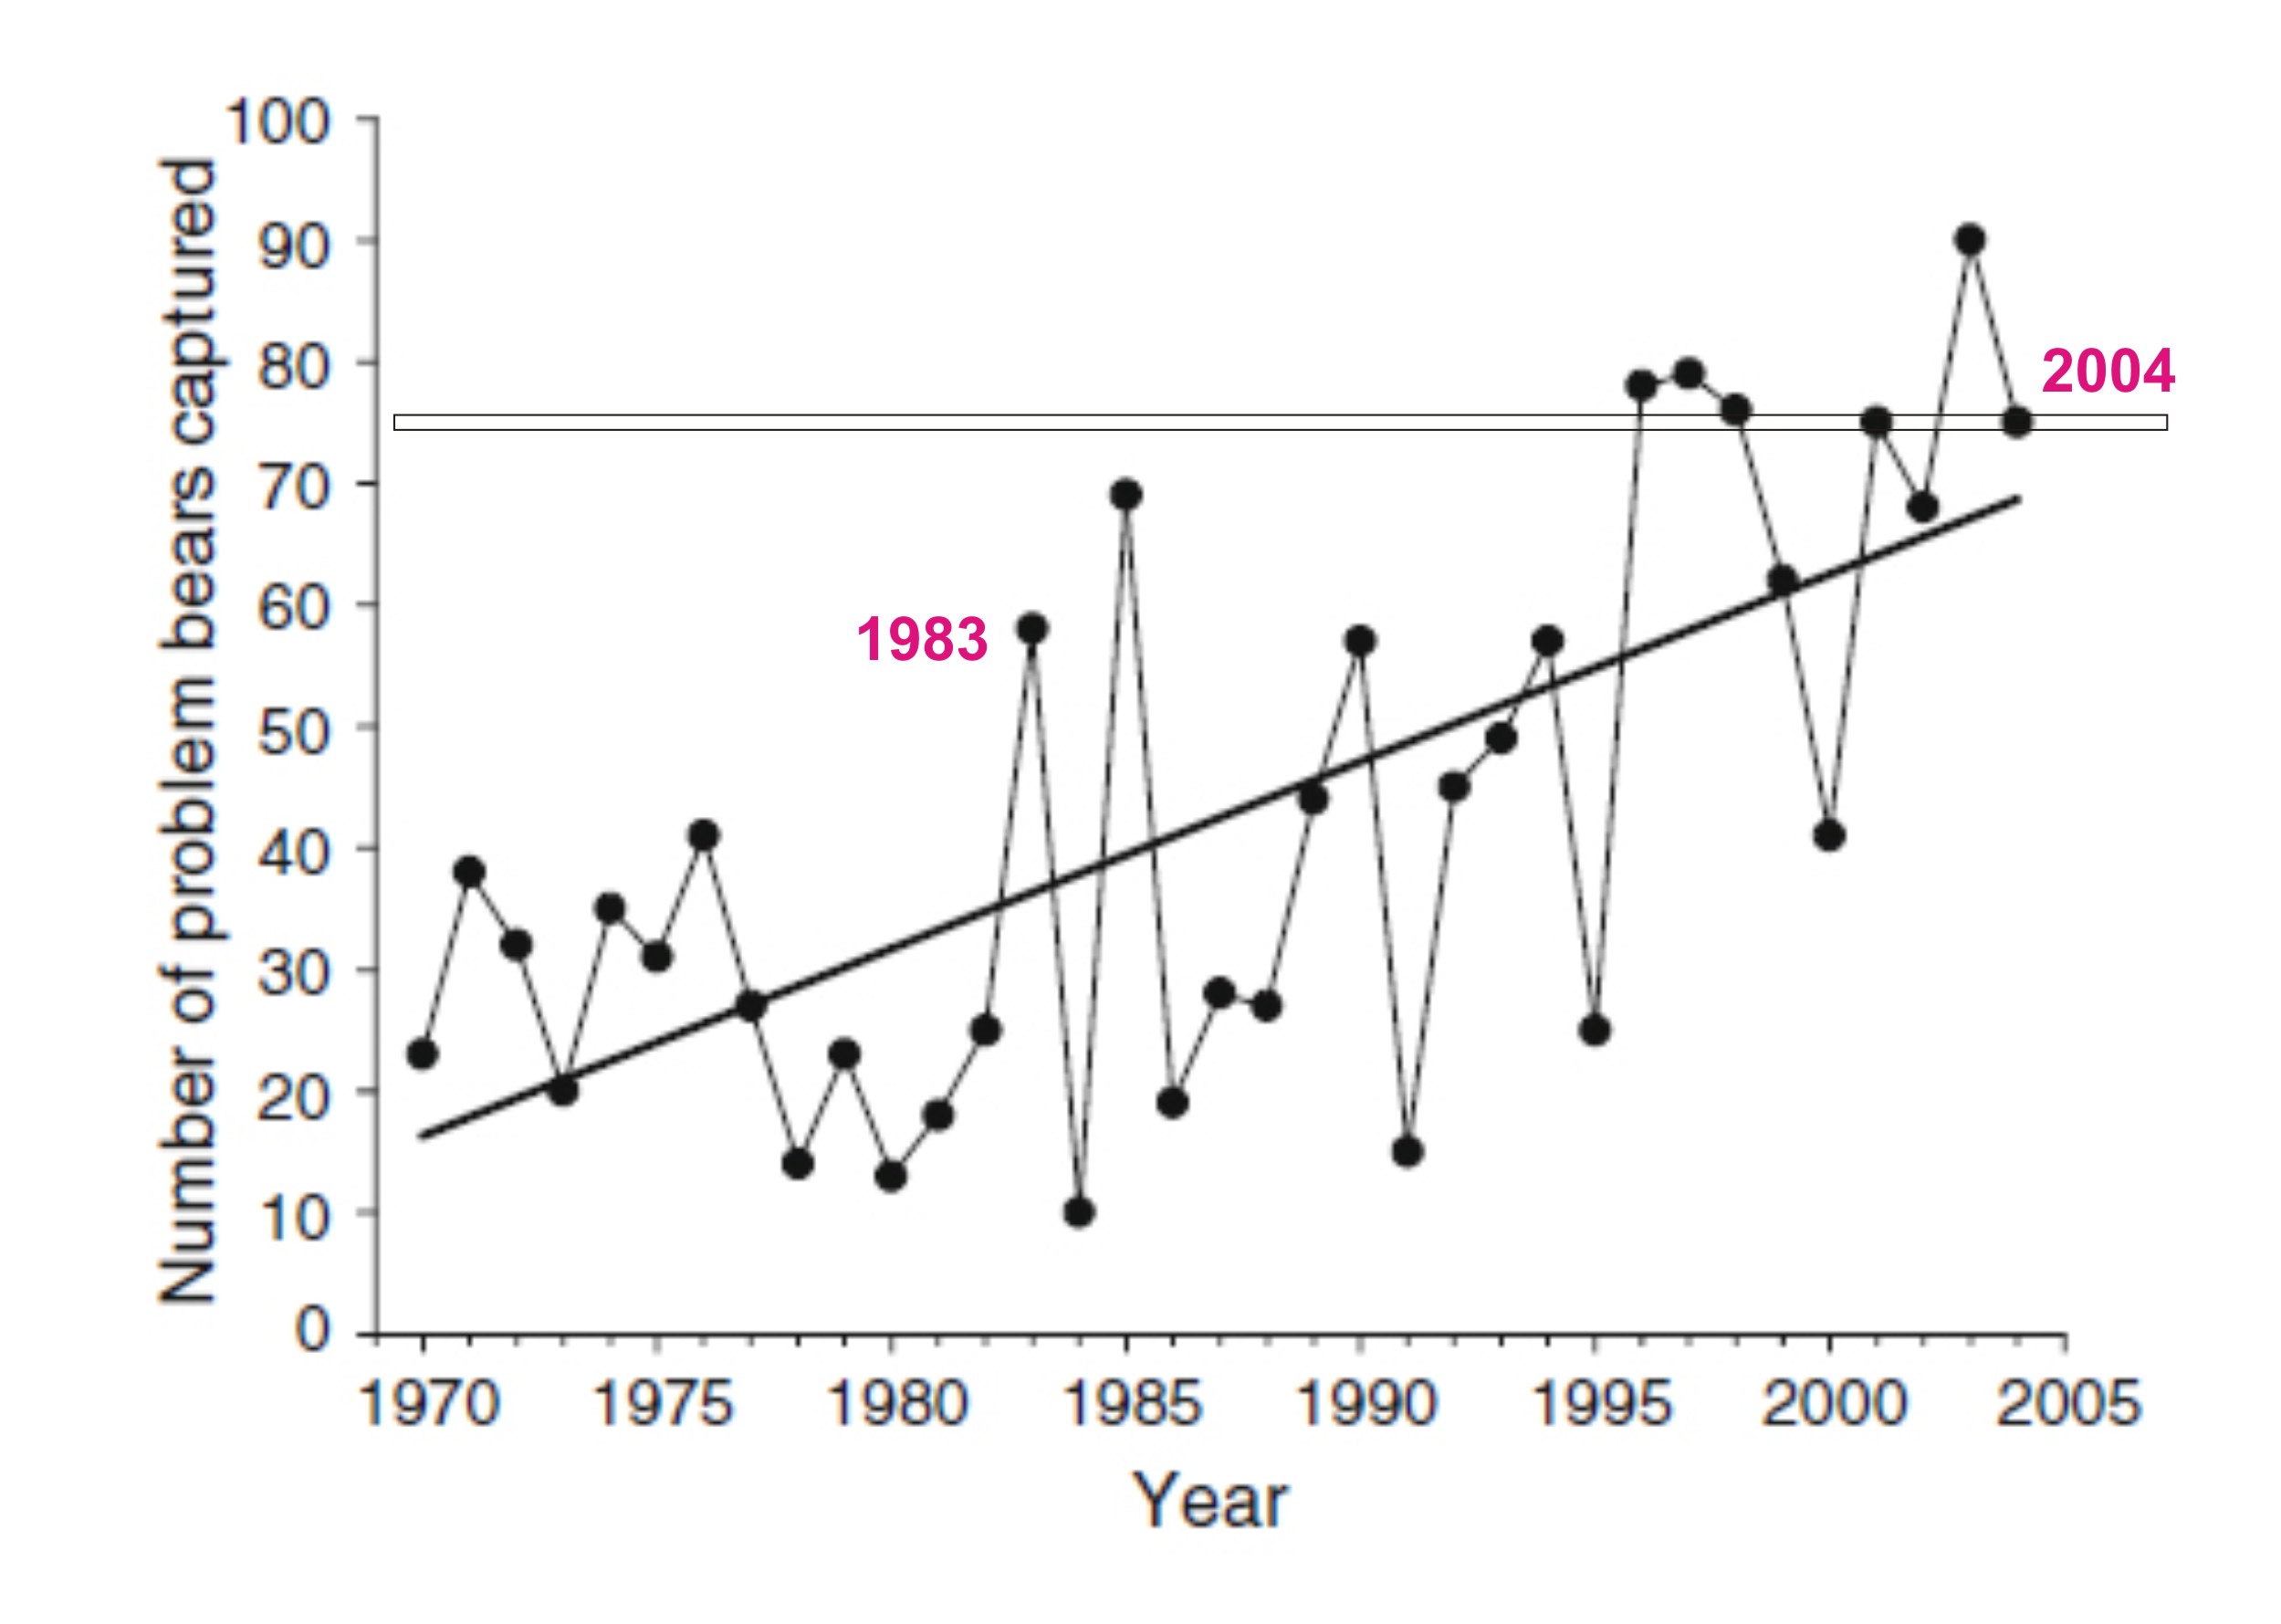
Figure 7. From Towns et al. (2009:1533), number of problem bears in a core area of Churchill from 1970 to 2004. Data from Kearney 1989 is excluded as “incomplete”
Using their “core” area figures gave them different numbers than the earlier study. Compare, for example, these figures for problem bears for the year 2003:
Stirling and Parkinson: ~175 vs.
Towns et al.: ~90.
That looks suspiciously like very careful selection of “core” to ensure that 1983 and 2004 would not interfere with an upward trend line of the graphs over time.
As I said, Towns et al. chose to use freeze-up date, rather than breakup, to correlate with number of problem bears. But as in Stirling and Parkinson, Towns and colleagues left 2004 off their correlation graph, but they were smarter: they did not include a graph of freeze-up dates alone, just a graph showing how problem bears from 1971-2003 were “correlated” with freeze-up dates.
Not surprisingly, they got an upward trend over time.
Conclusion
The number of problem bears in Churchill only correlates with earlier breakup dates if 1983 and 2004 are left out (due to late breakup dates and lots of problem bears). Ockham’s Broom strikes again. [h/t John Slade]
Good science practice would have explained if there were special circumstances necessitated leaving those data out. The lack of such an explanation in Stirling and Parkinson (2006) — cited routinely (e.g. Stirling and Derocher 2012) as providing evidence that Western Hudson Bay polar bears are being harmed by global warming — suggest there are no special circumstances, just inconvenient data. More evidence, it seems, of less than healthy science.
References
Calvert, W., Stirling, I., Schweinsburg, R.E., Lee, L.J., Kolenosky, G.B., Shoesmith, M., Smith, B., Crete, M. and Luttich, S. 1986. Polar bear management in Canada 1982-84. In: Polar Bears: Proceedings of the 9th meeting of the Polar Bear Specialists Group IUCN/SSC, 9-11 August, 1985, Edmonton, Canada. Anonymous (eds). Gland, Switzerland and Cambridge UK, IUCN. http://pbsg.npolar.no/en/meetings/ pg. 19-34.
Kearney, S.R., 1989. The Polar Bear Alert Program at Churchill,Manitoba. In: Bromely, M. (Ed.), Bear–People Conflict: Proceedings of a Symposium on Management Strategies, Yellowknife, Northwest Territories Department of Renewable Resources, pp. 83–92. [courtesy M. Dyck, Gov’t of Nunavut] Pdf here.
Ramsay, M.A. and Stirling, I. 1988. Reproductive biology and ecology of female polar bears (Ursus maritimus). Journal of Zoology London 214:601-624. http://onlinelibrary.wiley.com/doi/10.1111/j.1469-7998.1988.tb03762.x/abstract
Stirling, I. and Derocher, A.E. 2012. Effects of climate warming on polar bears: a review of the evidence. Global Change Biology 18(9):2694-2706. http://onlinelibrary.wiley.com/doi/10.1111/j.1365-2486.2012.02753.x/abstract [paywalled]
Stirling, I., Lunn, N.J. and Iacozza, J. 1999. Long-term trends in the population ecology of polar bears in Western Hudson Bay in relation to climate change. Arctic 52:294-306. http://arctic.synergiesprairies.ca/arctic/index.php/arctic/article/view/935/960 [open access]
Stirling, I. and Parkinson, C.L. 2006. Possible effects of climate warming on selected populations of polar bears (Ursus maritimus) in the Canadian Arctic. Arctic 59:261-275. http://arctic.synergiesprairies.ca/arctic/index.php/arctic/issue/view/16. [open access]
Towns, L., Derocher, A.E., Stirling, I., Lunn, N.J. and Hedman, D. 2009. Spatial and temporal patterns of problem polar bears in Churchill, Manitoba. Polar Biology 32(10):1529-1537. http://link.springer.com/article/10.1007%2Fs00300-009-0653-y [paywalled]


You must be logged in to post a comment.