
I’ve not written much about this subpopulation before but with the flurry of interest over “weakened” penis bones and toxic chemicals, I thought it was time to remedy the situation.
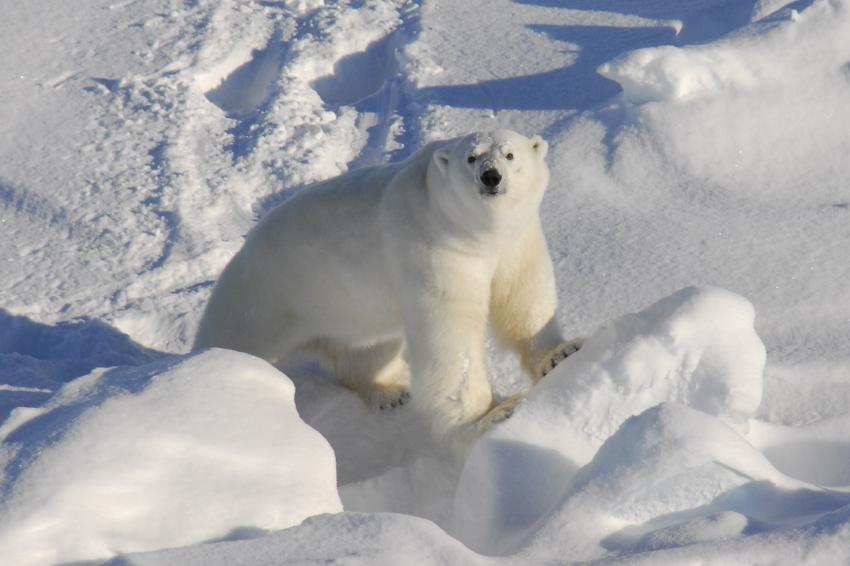
East Greenland Scorsby Sound March 2011 on Kap Tobin, Rune Dietz, press photo

Figure 1. Boundaries of East Greenland (EG) polar bear subpopulation, as defined by the IUCN Polar Bear Specialist Group.
Population size
This is what the IUCN Polar Bear Specialist Group (PBSG) said about East Greenland (EG) bears in their most recent assessment (2013: full entry copied below1):
“No inventories have been conducted to determine the size of the polar bear subpopulation in eastern Greenland.”
However, as recently as 2001, the PBSG gave a rough estimate for this subpopulation of 2,000 bears (in part, based on harvest records that indicated a fairly substantial population must exist, e.g. Larson 1971), but now (according to their math), they credit the region with only about 650 bears, with no reason given for the change in opinion.
In short, it appears the population size of the East Greenland subpopulation remains a mystery, but is probably substantial.
However, while there hasn’t been a population count, there has been research done in the region. In fact, there has been a team of Norwegian biologists working in the north half of East Greenland since the 1990s – it’s just that they had other issues on their minds – movement patterns of bears and influence of toxic organic chemicals.
Movement of polar bears in East Greenland
Studies in the 1990s seemed to show that there was little movement of collared females between East Greenland and the Svalbard region (Barents Sea subpopulation), in contrast to earlier studies from the 1970s and 1980s that suggested somewhat more exchange (Born et al. 1997).
Most recently, Kristen Laidre and colleagues (2012) showed that in contrast to the pattern shown by grizzly bears during the breeding season, East Greenland and Baffin Bay polar bear females moved longer distances than males.
They conclude (pg. 8), however,
“Different male and female movement strategies may be more optimal under different conditions. For example, Amstrup et al. [19] reported movements of 7 male bears tracked in Alaska did not differ greatly from movements of females, however, male bears tended to move in a more linear manner than females. This suggests that movement and breeding strategies may be regionally variable and perhaps related to population density, though more data are needed to explore this hypothesis.” [ref. #19 is Amstrup et al. 2001, see ref. list below; my bold]
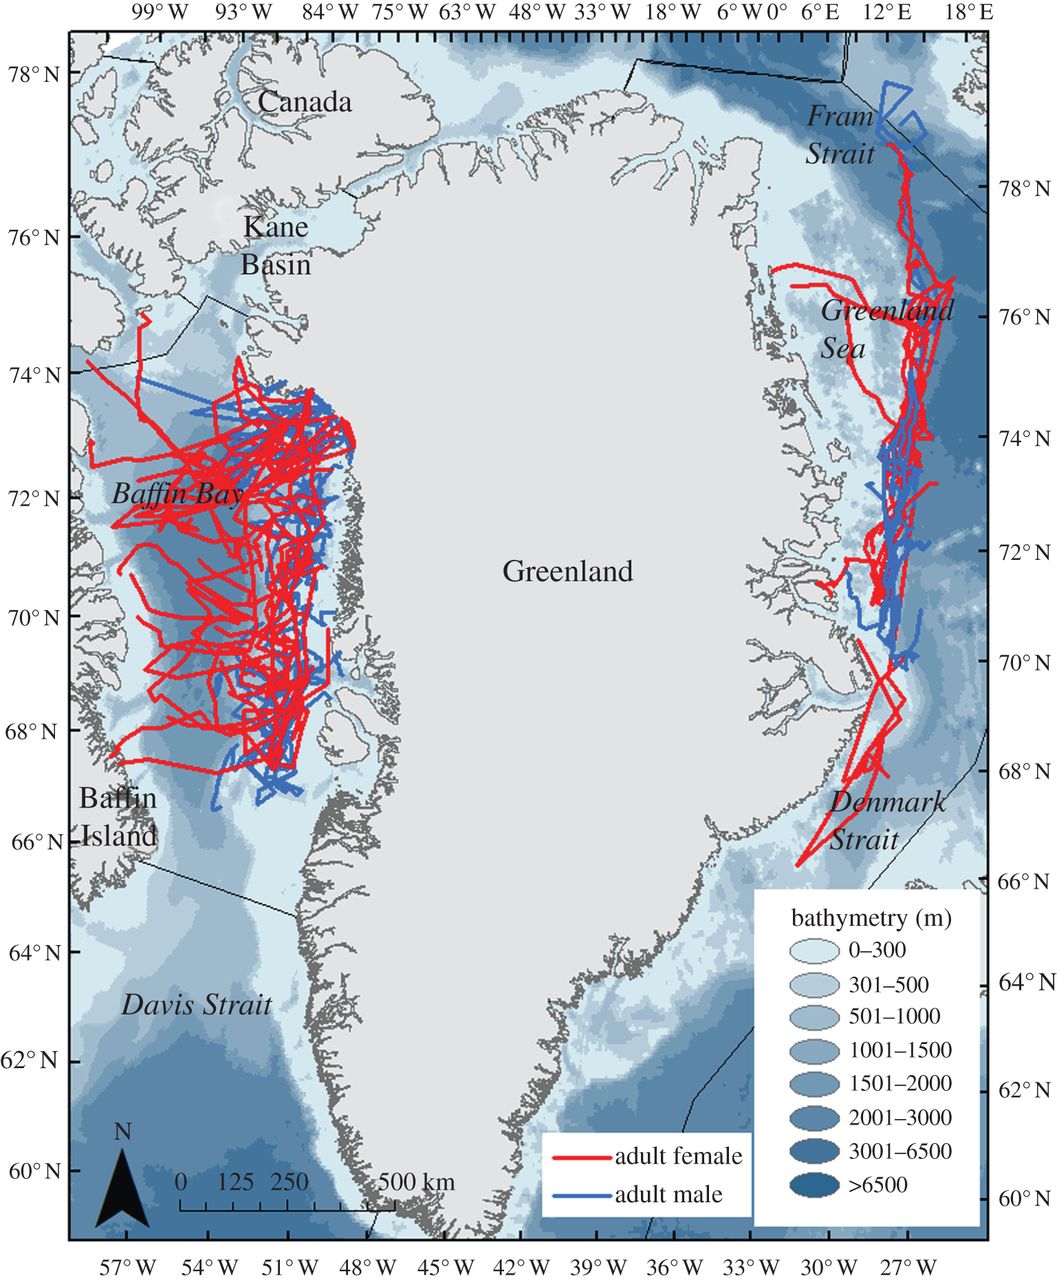
Figure 2. Movements of adult female (red) and adult male (blue) polar bears off East Greenland and in Baffin Bay during the breeding season (April to May) from 2007-2011. This is Fig. 1 from Laidre et al. 2012:2. Note similarities to Fig. 3 below. Click to enlarge.
Some years earlier, Wiig and colleagues (2003:514) had followed two females (between the fall of 1994 and the summer of 1998), and noted that:
“…both bears moved to the areas where harp and hooded seals breed in spring. In addition, Folkow et al. (1996) showed that adult hooded seals preferred the ice-covered areas off the East Greenland coast the whole year round and observed molting hooded seals in June-July 1990 and 1992 close to 73_N 10_W. Polar bear predation on harp and hooded seals at their East Greenland aggregation sites has been reported (Ette 1901; Nansen 1924) and it is likely that the two bears in the present study exploited these food resources during spring.” [my bold]
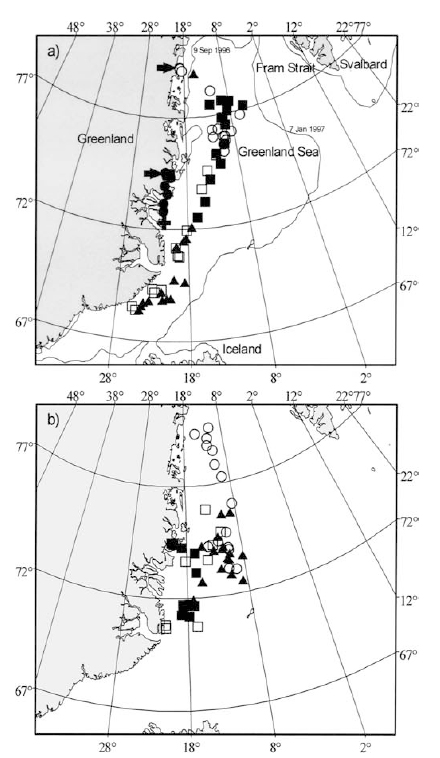
Figure 3. Positions by season of a single female polar bear (D7356, tracked for almost 4 years) over the pack ice: (a) October to March (winter/early spring); (b) April-June (mid-late spring). This is Fig. 1 from Wiig et al. 2003:510. “Filled dots 1994, filled squares 1995, filled triangles 1996, open dots 1997, open squares 1998. Arrows indicate denning positions and cross indicates tagging position. Minimum (9 Sept 1996) and maximum (7 Jan 1997) ice extent in the study period are indicated.” Click to enlarge.
So, it appears that in the Greenland Sea, harp and hooded seal pups are important prey for polar bears, in contrast to other areas of the Arctic where ringed seals are most important. However, recent dietary analysis indicates that ringed seals are still the primary prey of EG bears, with harp seals second and hooded seals third most important, similar to the diet of polar bears in Davis Strait (McKinney et al. 2013, see abstract copied below).
Compare the “West Ice” (Fig. 4), the primary pupping and moulting area for harp and hooded seals, with regions where polar bears are known to move to in the spring (Figs. 2 and 3).

Figure 4. The is Fig. 1. from Stenson 2014, on the conclusions of the working group on harp and hooded seal status. Green spots are pupping and moulting areas, dark blue is the total distribution area. The “West Ice” off East Greenland is used by both species.
According to recent work (Stenson 2014), the current size of the Greenland harp seal (Fig. 5) stock is about three times as high as it was in the 1970s (estimated at more than 600,000 animals, range 470,540-784,280). So, as for polar bears in southern Davis Strait, there are lots of harp seal pups to eat in the spring and early summer.

Figure 5. Harp seal and pup, from 2013 press release, photo by Rune Dietz.
However, for unknown reasons, hooded seals (Fig. 6) in the same area appear to be declining. There are only about half as many hooded seals now than there were in 1997, and much fewer than there were in the 1950s. That’s a huge actual decline, not a predicted one. The hooded seal is therefore listed as ‘vulnerable’ to extinction by the IUCN.
Oddly, the fact that hooded seals are threatened with extinction right now hasn’t been making headlines in newspapers around the world. Perhaps because (as implied by it’s alternate name — the “bladder-nosed seal”), it’s not photogenic enough (photos here and here) to garner sympathy?
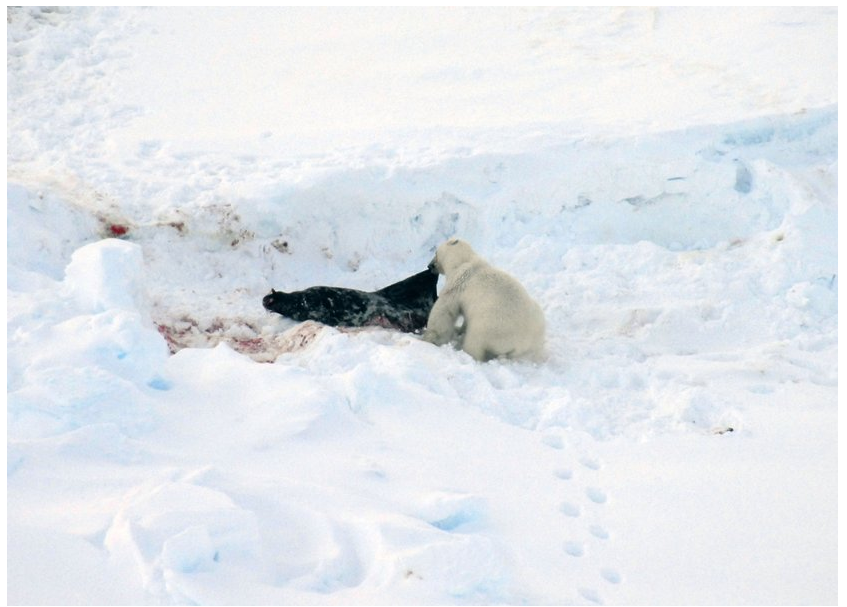
Figure 6. Hooded seal killed by a polar bear in East Greenland, pup, from 2013 press release, photo by Rune Dietz.
Environmental Toxic Chemicals in East Greenland polar bears
Sonne (2010), in a long and extensive review of all the toxicology research done on polar bears to that date, made the following claim in his abstract:
“In conclusion, polar bears seem to be susceptible to contaminant induced stress that may have an overall sub-clinical impact on their health and population status via impacts on their immune and reproductive systems.” [my bold]
However, emphasized in the paper is the critical caveat:
“It is important to note that the published polar bear data included in this review are correlative and descriptive and therefore do not directly demonstrate contaminant mediated cause and effect relationships.” [pg. 468, my bold]
In other words, as I pointed out for the “weakened” penis bone paper, Sonne really has no evidence to support his claim that polar bear health has actually been affected in any significantly negative way.
While it is true that some biological effects have been noted (e.g., sizes of male (but not female) skulls, changes in gene function), it has not been demonstrated that any of the changes documented have negatively affected polar bear health or population size (see excerpt from O’Hara and Becker 2003, in refs, for possible reasons why).
[note that a more recent summary (Dietz et al., 2013 a, b) has the same serious flaw (press release here, one news outlet’s take on it here), as does a new paper on thyroid hormone differences (Gabrielson et al. 2015) — no evidence of actual negative health impacts]
Sonne and others also offer no explanation for why East Greenland bears would accumulate more toxins than bears in other subpopulations. Surely if East Greenland bears are the worst of all, there has to be reason?
In short, all of the so-called “evidence” for negative effects of organic pollutants on East Greenland polar bears is circumstantial and inconclusive. Since we have had no reports of actual health issues with East Greenland bears — and since sea ice coverage has changed very little since 1979 (Fig. 7) and with harp seal numbers perhaps at an all-time high — we can probably assume that, for now at least, this subpopulation is doing just fine, even without a population size estimate.
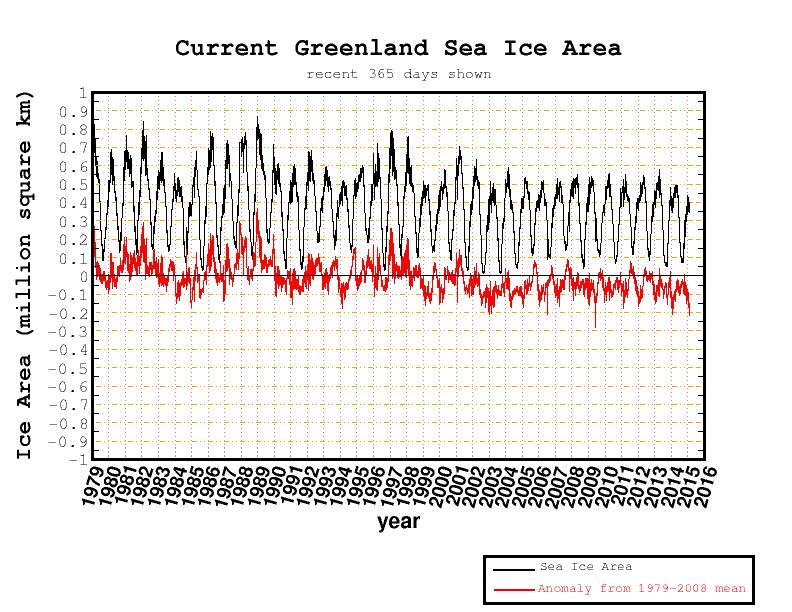
Figure 7. East Greenland sea ice anomaly provided by Cryosphere Today (University of Illinois), at 3 Feb. 2015.
Footnote 1. PBSG 2013 (East Greenland, trend is “data deficient”):
“Although various studies have indicated that more or less resident groups of bears may occur within the range of polar bears in East Greenland (EG; Born 1995, Dietz et al. 2000, Sandell et al. 2001), the EG polar bears are thought to constitute a single subpopulation with only limited exchange with other subpopulations (Wiig 1995, Born et al. 2009). Satellite-telemetry has indicated that polar bears range widely along the coast of eastern Greenland and in the pack ice in the Greenland Sea and Fram Strait (Born et al. 1997, 2009, Wiig et al. 2003; Laidre et al. 2012). Although there is little evidence of genetic difference between subpopulations in the eastern Greenland and Svalbard-Franz Josef Land regions (Paetkau et al. 1999), satellite telemetry and movement of marked animals indicate that the exchange between EG and the Barents Sea subpopulation is minimal (Wiig 1995, Born et al. 1997, 2009, Wiig et al. 2003, Laidre et al. 2012). No inventories have been conducted to determine the size of the polar bear subpopulation in eastern Greenland.”
Reference
Amstrup, S.C., Durner, G.M., McDonald, T.L., Mulcahy, D.M. and Garner, G.W. 2001. Comparing movement patterns of satellite-tagged male and female polar bears. Canadian Journal of Zoology 79:2147-2158. DOI: 10.1139/cjz-79-12-2147 http://www.nrcresearchpress.com/doi/abs/10.1139/z01-174#.VNE7Hy5v_gU [also downloadable here]
Born, E.W., Wiig, Ø. and Thomassen, J. 1997. Seasonal and annual movements of radiocollared polar bears (Ursus maritimus) in northeast Greenland. Journal of Marine Systems 10:67-77. doi:10.1016/S0924-7963(96)00072-3 Open access
http://www.sciencedirect.com/science/article/pii/S0924796396000723
Dietz R., Rigét, F.F., Sonne, C., Born, E.W., Bechshøft, T., McKinney, M.A. and Letcher, R.J. 2013a. Three decades (1983–2010) of contaminant trends in East Greenland polar bears (Ursus maritimus). Part 1: Legacy organochlorine contaminants. Environment International 59:485-493. http://www.sciencedirect.com/science/article/pii/S0160412012002024
Dietz R., Rigét, F.F., Sonne, C., Born, E.W., Bechshøft, T., McKinney, M.A., Drimmie, R.J., Muir, D.C.G., and Letcher, R.J. 2013b. Three decades (1984-2010) of contaminant trends in East Greenland polar bears (Ursus maritimus): Part 2 Brominated flame retardants. Environment International 59: 494-500 http://www.sciencedirect.com/science/article/pii/S0160412012002061
Gabrielson, K.M., Krokstad, J.S., Villanger, G.D., Blair, D.A.D., Obregon, M.-J., Sonne, C., Dietz, R., Letcher, R.J. and Jenssen, B.M. 2015. Thyroid hormones and deiodinase activity in plasma and tissues in relation to high levels of organohalogen contaminants in East Greenland polar bears (Ursus martimus). Environmental Research 136: 413-423.
Laidre, K.L., Born, E.W., Gurarie, E., Wiig, O., Dietz, R. and Stern, H. 2012. Females roam while males patrol: divergence in breeding season movements of pack ice polar bears (Ursus maritimus). Proceedings of the Royal Society B 280: 1-10. DOI: 10.1098/rspb.2012.2371 Open access http://rspb.royalsocietypublishing.org/content/280/1752/20122371
Larson, T. 1971. Norwegian polar bear hunt, management and research. Pg. 159-164 in Bears – Their Biology and Management, Herrero, S. (ed.). IUCN Publication New Series no. 23. Pdf here.
McKinney, M.A., Iverson, A.J., Fisk, A.T., Sonne, C., Rigét, F.F., Letcher, R.J., Arts, M.T., Born, E.W., Rosing-Asvid, A. and Dietz, R. 2013. Global Change Biology 19:2360-2372. http://onlinelibrary.wiley.com/doi/10.1111/gcb.12241/abstract
ABSTRACT
Rapid climate changes are occurring in the Arctic, with substantial repercussions for arctic ecosystems. It is challenging to assess ecosystem changes in remote polar environments, but one successful approach has entailed monitoring the diets of upper trophic level consumers. Quantitative fatty acid signature analysis (QFASA) and fatty acid carbon isotope (d13C-FA) patterns were used to assess diets of East Greenland (EG) polar bears (Ursus maritimus) (n = 310) over the past three decades. QFASA-generated diet estimates indicated that, on average, EG bears mainly consumed arctic ringed seals (47.5 2.1%), migratory subarctic harp (30.6 1.5%) and hooded (16.7 1.3%) seals and rarely, if ever, consumed bearded seals, narwhals or walruses. Ringed seal consumption declined by 14%/decade over 28 years (90.1 2.5% in 1984 to 33.9 11.1% in 2011). Hooded seal consumption increased by 9.5%/decade (0.0 0.0% in 1984 to 25.9 9.1% in 2011). This increase may include harp seal, since hooded and harp seal FA signatures were not as well differentiated relative to other prey species. Declining d13C-FA ratios supported shifts from more nearshore/benthic/ice-associated prey to more offshore/pelagic/open-water-associated prey, consistent with diet estimates. Increased hooded seal and decreased ringed seal consumption occurred during years when the North Atlantic Oscillation (NAO) was lower. Thus, periods with warmer temperatures and less sea ice were associated with more subarctic and less arctic seal species consumption. These changes in the relative abundance, accessibility, or distribution of arctic and subarctic marine mammals may have health consequences for EG polar bears. For example, the diet change resulted in consistently slower temporal declines in adipose levels of legacy persistent organic pollutants, as the subarctic seals have higher contaminant burdens than arctic seals. Overall, considerable changes are occurring in the EG marine ecosystem, with consequences for contaminant dynamics.
O’Hara, T.M. and Becker, P.R. 2003 [ebook version]. POCs in Arctic marine mammals. In Toxicology of Marine Mammals Volume 3, Vos, J.G., Bossart, G., Fournier, M. and O’Shea, T. (eds). CRC Press ISBN 9780203165577 – CAT# TFE354 pg. 168-205. Google books url http://tinyurl.com/pa4xvgx
[Except from this book on polar bear POCs (“Persistent Organohalogen Contaminants”, also known as POPs (“Persistent Organic Pollutants”) here.
Sonne C. 2010. Health effects fromlong-range transported contaminants in Arctic top predators: an integrated review based on studies of polar bears and relevant model species. Environment International 36:461–91. http://www.sciencedirect.com/science/article/pii/S0160412010000358 Paywalled.
Sonne, C., Dyck, M., Rigét, F.F., Jens-Erik Beck Jensen, J.-E.B., Hyldstrup, L., Letcher, R.J., Gustavson, K., Gilbert, M.T.P., Dietz, R. 2015. Penile density and globally used chemicals in Canadian and Greenland polar bears. Environmental Research 137:287–291. http://www.sciencedirect.com/science/article/pii/S0013935114004770
Stenson, G.B. 2014. The Status of Harp and Hooded Seals in the North Atlantic. Northwest Atlantic Fisheries Organization. Serial No. N6321, NAFO SCR Doc. 14/016, dated June 2014. [Results of the the Joint NAFO/ICES Working Group on Harp and Hooded Seals (WGHARP)] Pdf here.
Wiig. Ø., Born, E.W. and Pedersen, L.T. 2003. Movements of female polar bears (Ursus maritimus) in the East Greenland pack ice. Polar Biology 26:509-516.


You must be logged in to post a comment.