
Polar bear habitat in the Arctic Basin this year appears to have reached its apex days earlier than average. As of 12 September, freeze-up of Arctic sea ice had begun. Unless something dramatic happens over the next few days, this will make 2015 the earliest September minimum since at least 2007, using NSIDC data.1
The two lowest September ice extents (2007 and 2012) were also both later than average; this year’s minimum is the fourth lowest (see chart below).
Of course, all this fuss about how low the September minimum gets is irrelevant to polar bears: they are either on land or in the Arctic Basin, and virtually all are living off stored fat no matter where they are (see Arctic Basin bear here). What matters is when the refrozen ice reaches pregnant females that have preferred denning spots onshore (like in Svalbard) or for bears onshore waiting to return to the ice to hunt (like Davis Strait, and Western and Southern Hudson Bay bears). We won’t know that until October (for Svalbard) or November (for E. Canada).
Again, no sea ice death spiral or polar bears in peril because of it.
UPDATE 15 September 2015, 11:00 am PDT: Just published at the NSIDC website, 2015 minimum has been (tentatively) called at 4.41 mkm2, confirming my figure taken from their interactive graph (see below). However, despite the fact that their own data show that sea ice extent stayed at that value for three days, NSIDC has chosen the last day of that 3-day period rather than the first to represent the 2015 minimum. Go figure. That makes 2015 tied with 2011 for the earliest date for their official records, which seems more than a little self-serving and means I’m not changing the title of my post. NSIDC have also modified slightly some of the official extent figures for past minimums (added below) but it doesn’t really change anything.
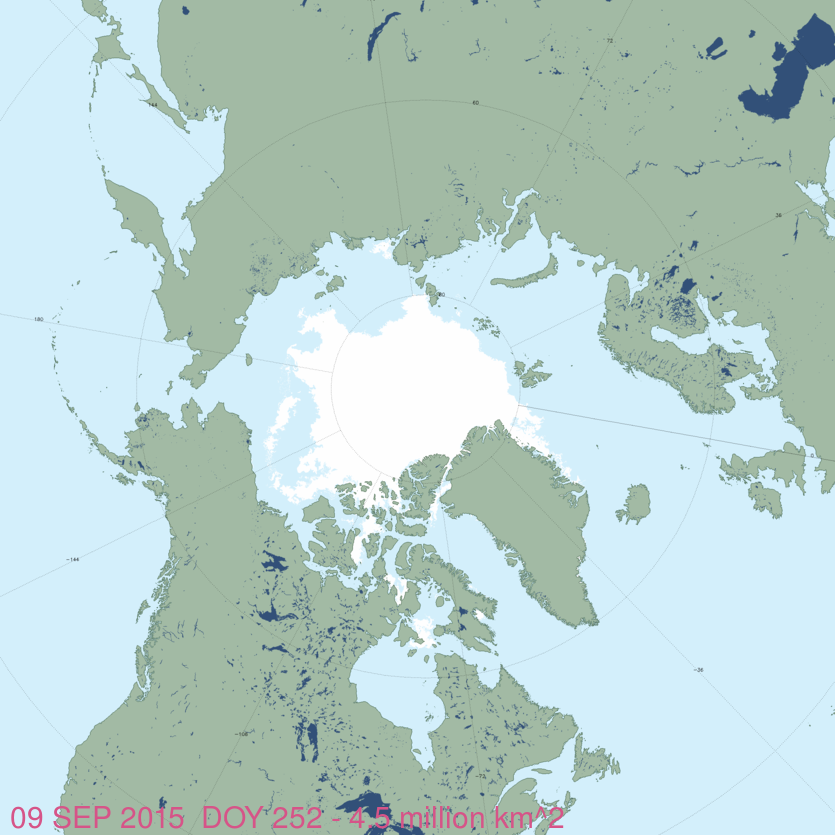
The NSIDC interactive sea ice extent graph (which appears to use the same values as their standard extent maps with averages) showed 4.41 mkm2 for 9-11 September), compared to 4.33 mkm2 in 2011 (see graph copied below). In contrast NSIDC’s MASIE product (see map above) shows extent for 9 September as 4.5 mkm2, and 4.3 mkm2 for 11 September 2011. See previous discussion here about differences between the two satellite estimates (NSIDC has some deficiencies not totally resolved by MASIE). NSIDC uses their standard figures (not MASIE) when discussing and declaring yearly minimums and maximums.
I’ve updated NSIDC’s old chart comparing extents and dates for the September minimum back to 2007 (I’ll correct this later if it happens to change but for now, I’m using 4.41 mkm2 for 2015, taken from the NSIDC interactive graph shown further down):
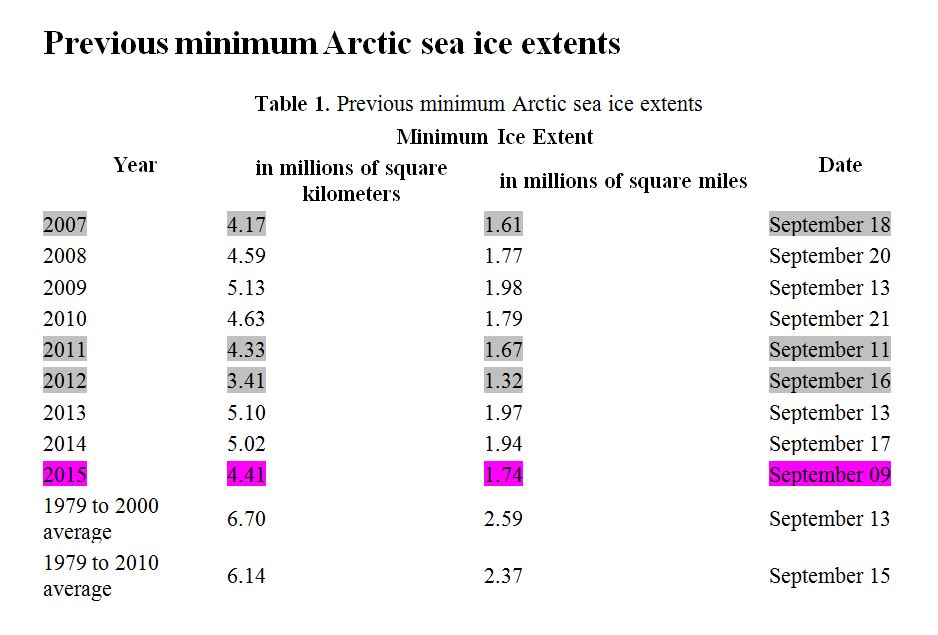
UPDATE: Below is NSIDC’s new official list of past/present sea ice minimums back to 2006 (published 15 September 2015) – click to enlarge:

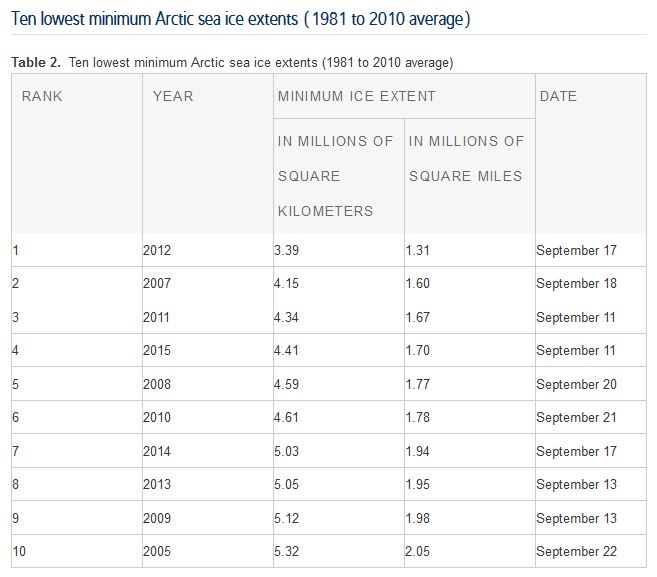
UPDATE: Below is NSIDC’s new official list of ten lowest sea ice minimums back to 1981 (published 15 September 2015):
MASIE map below showing an increase to 4.6 mkm2 12 September 2015 after 3 days of static extent at 4.5 mkm2: [Archives]

Compare above to NSIDC standard map below for 12 September 2015 (which is presumably 4.43 mkm2):
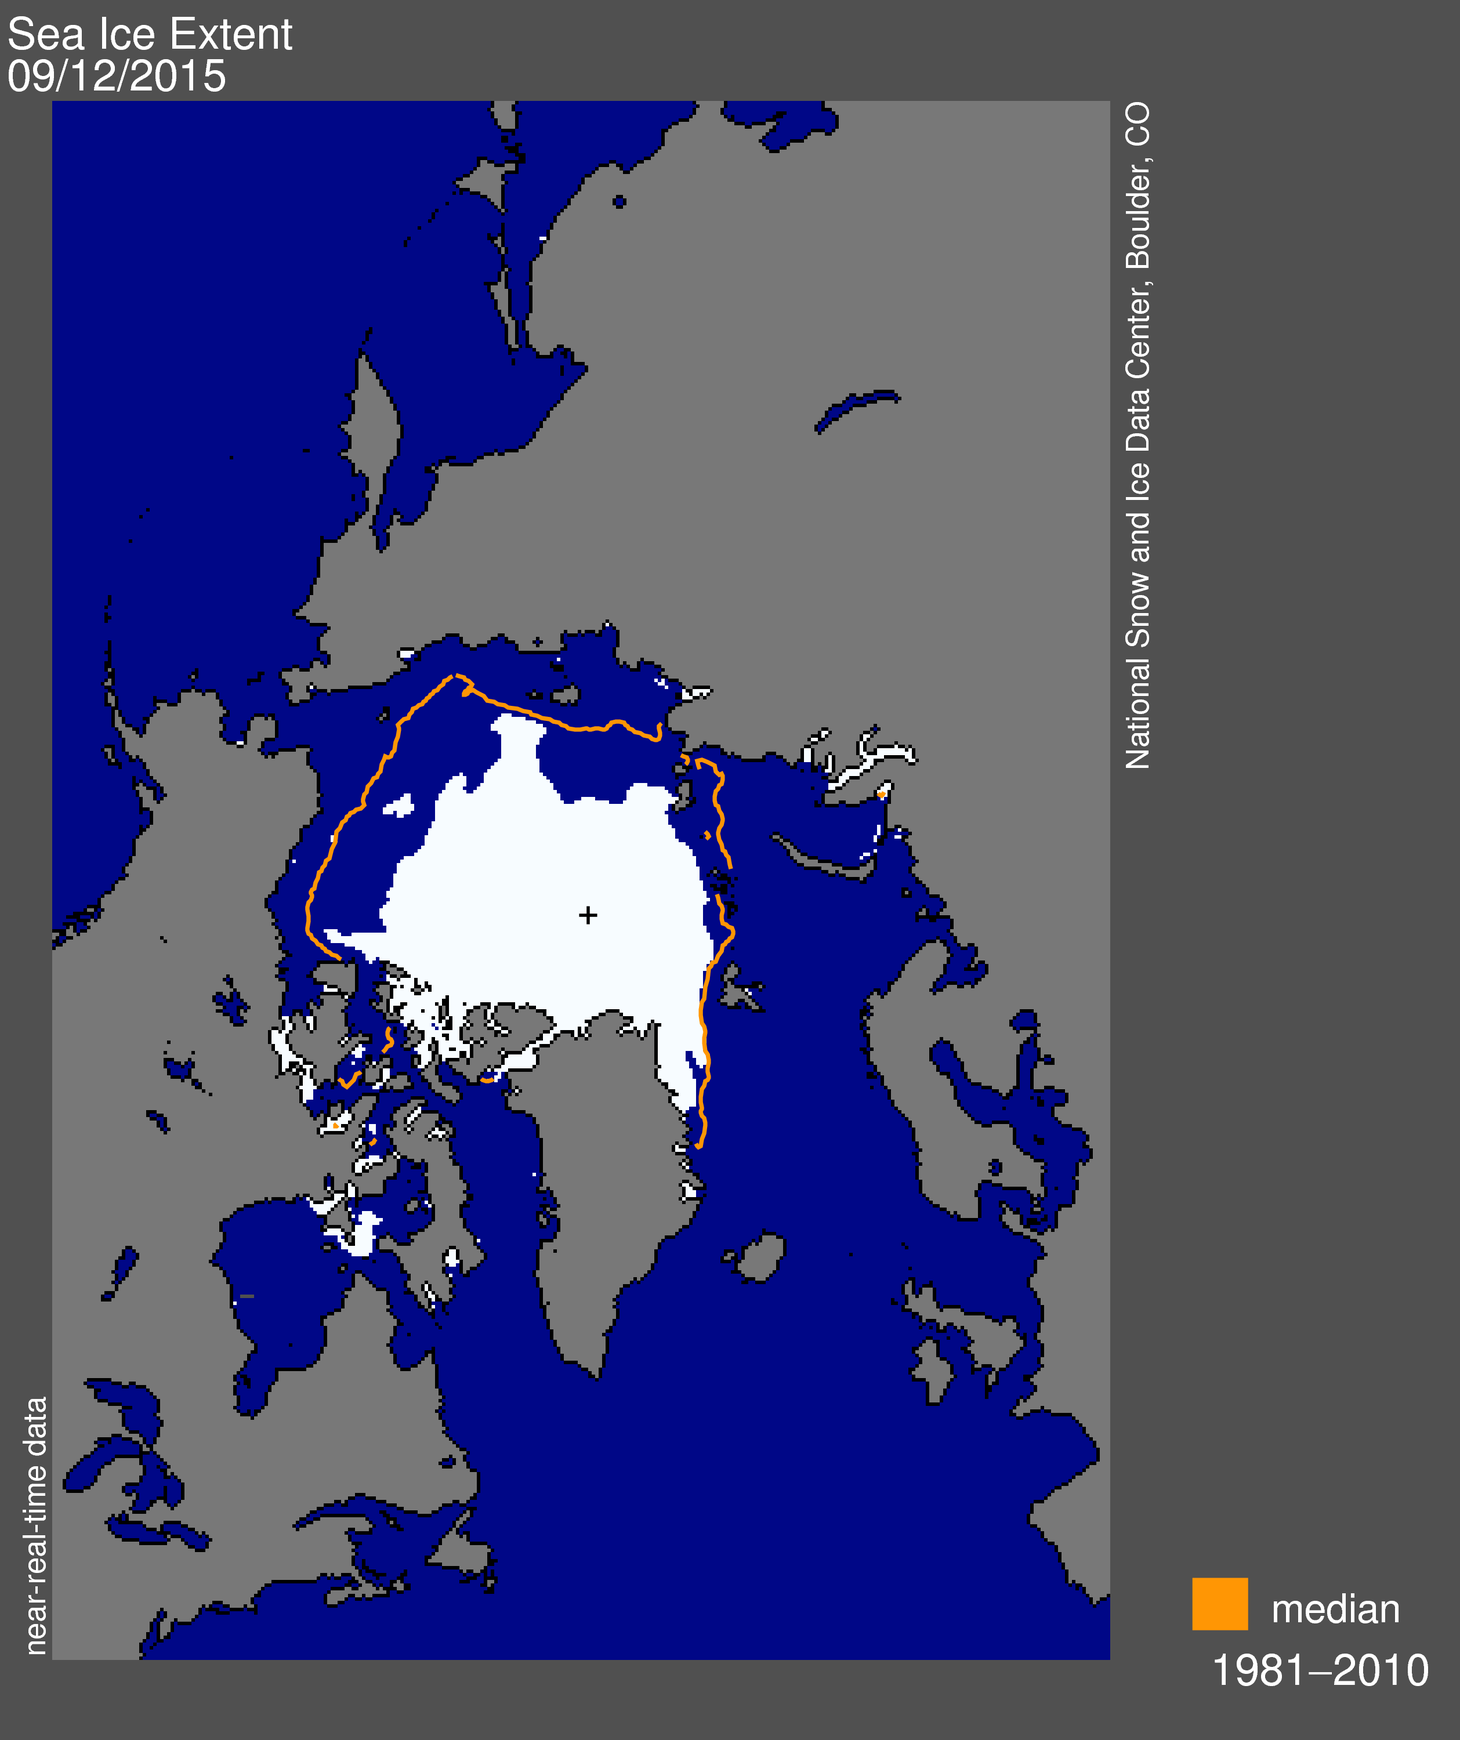
NSIDC interactive graph below shows 4.431 mkm2 for 12 September, vs. 4.413 mkm2 the previous three days (9-11 September).

Footnote 1. As of 13 September, NSIDC has not yet declared an official minimum value; it could go down again and if so, I’ll update this post.
Note that other organizations calculate sea ice extent differently, which means you have to know which one you are dealing with before you compare one year to another. NSIDC uses a cutoff of 15% sea ice concentration for it’s calculations, others use 30%. Links below discuss other versions:
Watts Up With That? (WUWT), Arctic sea ice melt may have turned the corner 11 September 2015
Sunshine Hours, chart of minimums going back to 1979


You must be logged in to post a comment.