Tag Archives: melt

Polar bear habitat in Canada at the first week of June sees widening of critical polynyas

Winds primarily cause the apparent sea ice ‘breakup’ in late spring through the widening of persistent polynyas and shore leads. This year the development of critical open water areas in Canada (which are important feeding areas for polar bears) is on track with previous years in most areas, although there is a lot of year-to-year variability.

Several prominent polynas also opened up along the Russian coast and Northeast Greenland: see the entire Arctic condition at 7 June 2021 below, courtesy NSIDC:

Continue reading

Polar bear habitat in Canada and eastern Alaska compared at end of June 2012-2020

Here is a quick compare and contrast of sea ice habitat for polar bears in Canada and the Southern Beaufort region of eastern Alaska near the end of June, 2012-2020.

Baffin Island Bylot Sound bear_smaller_shutterstock_1144169858

Similarities between Hudson Bay ice/open water in the sea ice charts below are striking. Ice cover at the end of June shown in these charts since 2012 reinforces the fact, documented in the peer-reviewed literature, that there has been no continued declining trend in dates of sea ice breakup for Western and Southern Hudson Bay since 1998 at least (Castro de la Guardia et al. 2017; Lunn et al. 2016). WH bears are still on the ice.

As a consequence, recent declarations of impending doom for Hudson Bay polar bears, based on claims of reduced population size and health of these subpopulations – which in any case are statistically insignificant for WH and SH (Obbard et al. 2018; Dyck et al. 2017) – must be due to some other cause (Crockford 2020).

In all areas, winds rather than melt due to increased temperatures drive much of the expansion of open water at this time of year.

Continue reading

Polar bear habitat update: open water primarily due to winds pushing pack ice

Here is a look at what polar bear habitat looks like this year at the end of May compared to previous years. It helps put any predictions of impending doom into perspective.

Polar_bear Bering Sea 2007 USFWS lg

This is the time year when declining sea ice gets some people all worked up. However, declining ice is normal at this time of year and there is always variation in where the most open water appears first. At this time of year, there isn’t much ice ‘melt’ going on. Rather, what we are seeing is the opening up of shore leads and polynyas by winds.

Continue reading

Hudson Bay ice update: more thick first year ice habitat for polar bears in 2018 than 2004

Despite pronouncements from one polar bear specialist that “ice in Hudson Bay is in rapid retreat” a look back in time shows that there is more thick first year ice over the Bay this year for the week of the summer solstice than there was in 2004 – and much less open water than 1998.

Lunn et al 2016 EA cover image WH bear

Below, 2018, June 18 (the week of the summer solstice):

Hudson Bay weekly stage of development 2018 June 18

Compare the above to the same week coverage chart for 2004, below:
Hudson Bay weekly stage of development 2004_June 21

Ice coverage for some other recent years are shown below compared to 1998, the year the ice breakup pattern on Hudson Bay changed. Speed and melt sequences vary according to the amount of thick first year ice present, discussed previously here.

PS. If you’re wearing white today, flaunt it! Tell your friends and colleagues that you’re celebrating the success of polar bears despite such low summer sea ice since 2007 that 2/3 of them were predicted to disappear.
Continue reading

Polynya refresher: open water in spring is due to winds & currents, not ice melt

Arctic sea ice begins to open up in spring at predictable locations due to currents and prevailing winds and this was as true in the 1970s as it is today. Polynyas and widening shore leads that most often get mistaken for early sea ice melt are those in the Beaufort and Chukchi Seas and in Hudson Bay.

Beaufort Sea male polar bear USGS_2005 Amstrup photo

But contrary to concerns expressed about possible negative implications of these early patches of open water, these areas have always been critical congregation areas for Arctic seals and are therefore important feeding areas for polar bears.

Seal habitat frozen open lead_Beaufort 2008_Miller

Seals hauled out beside a lightly frozen over lead in Beaufort Sea ice, 2008. USFWS.

Continue reading

September minimum 2015 looks like the earliest end of Arctic melt season since 2007

Polar bear habitat in the Arctic Basin this year appears to have reached its apex days earlier than average. As of 12 September, freeze-up of Arctic sea ice had begun. Unless something dramatic happens over the next few days, this will make 2015 the earliest September minimum since at least 2007, using NSIDC data.1

masie_all_zoom_v01_2015252_4km

The two lowest September ice extents (2007 and 2012) were also both later than average; this year’s minimum is the fourth lowest (see chart below).

Of course, all this fuss about how low the September minimum gets is irrelevant to polar bears: they are either on land or in the Arctic Basin, and virtually all are living off stored fat no matter where they are (see Arctic Basin bear here). What matters is when the refrozen ice reaches pregnant females that have preferred denning spots onshore (like in Svalbard) or for bears onshore waiting to return to the ice to hunt (like Davis Strait, and Western and Southern Hudson Bay bears). We won’t know that until October (for Svalbard) or November (for E. Canada).

Again, no sea ice death spiral or polar bears in peril because of it.

UPDATE 15 September 2015, 11:00 am PDT: Just published at the NSIDC website, 2015 minimum has been (tentatively) called at 4.41 mkm2, confirming my figure taken from their interactive graph (see below). However, despite the fact that their own data show that sea ice extent stayed at that value for three days, NSIDC has chosen the last day of that 3-day period rather than the first to represent the 2015 minimum. Go figure. That makes 2015 tied with 2011 for the earliest date for their official records, which seems more than a little self-serving and means I’m not changing the title of my post. NSIDC have also modified slightly some of the official extent figures for past minimums (added below) but it doesn’t really change anything.
Continue reading

Summer polar bear habitat then & now – little impact from 2007 record-breaking sea ice low

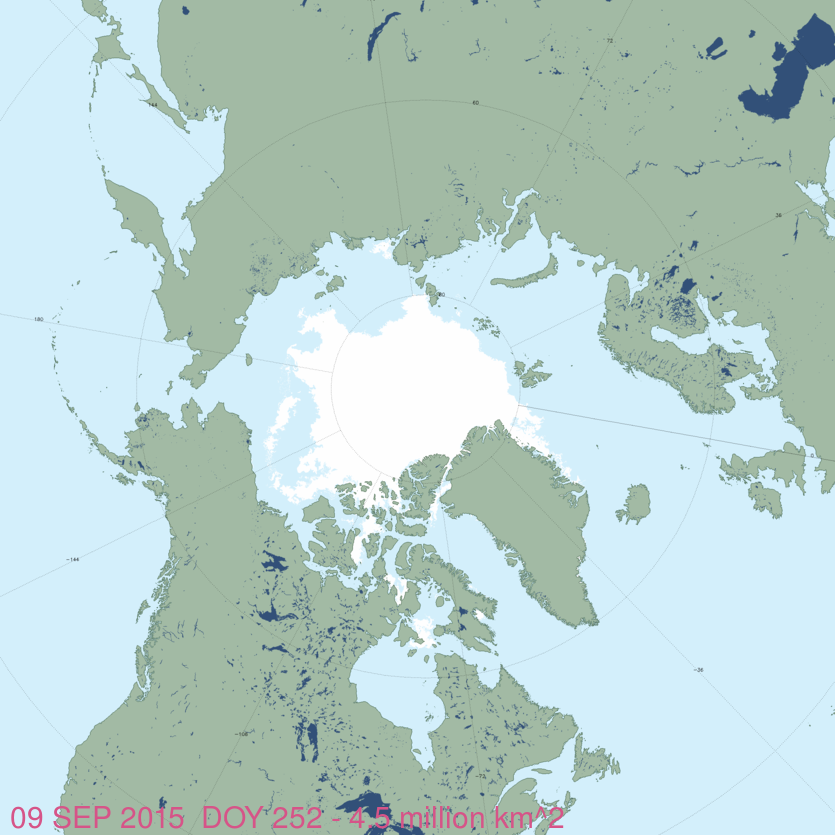
Sea ice looks low for this time of year but how does it compare to 2007, when summer ice habitat for polar bears hit a record-breaking low?  What can the impact of 2007 ice levels on polar bears tell us about what to expect this year?

Sea ice at 2015 Aug 8 vs pb status map_Aug 9 2015 sm

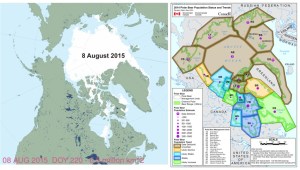
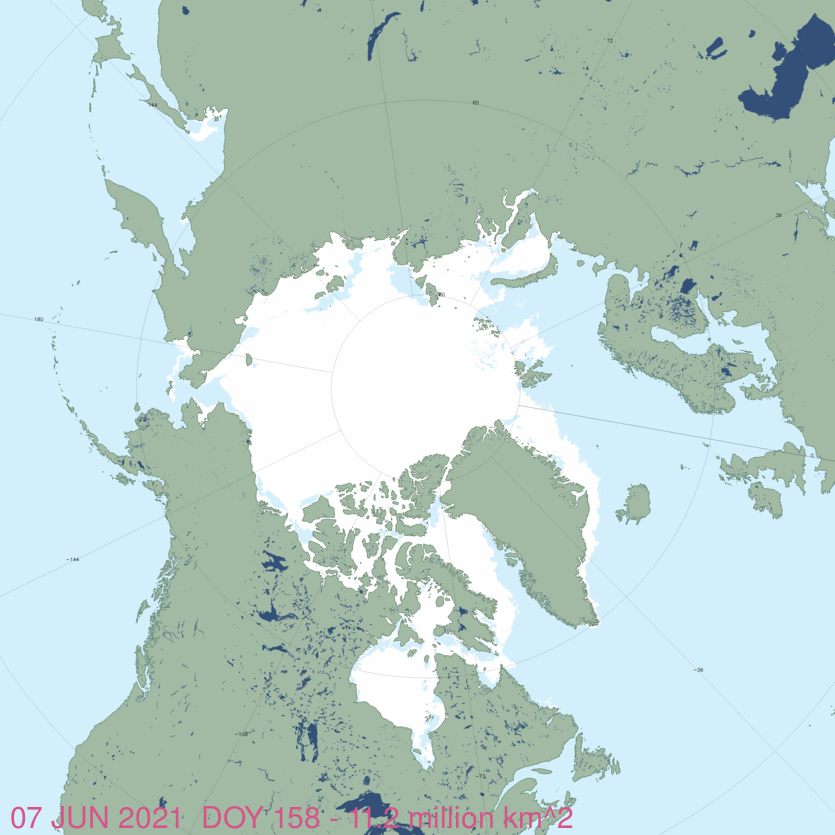
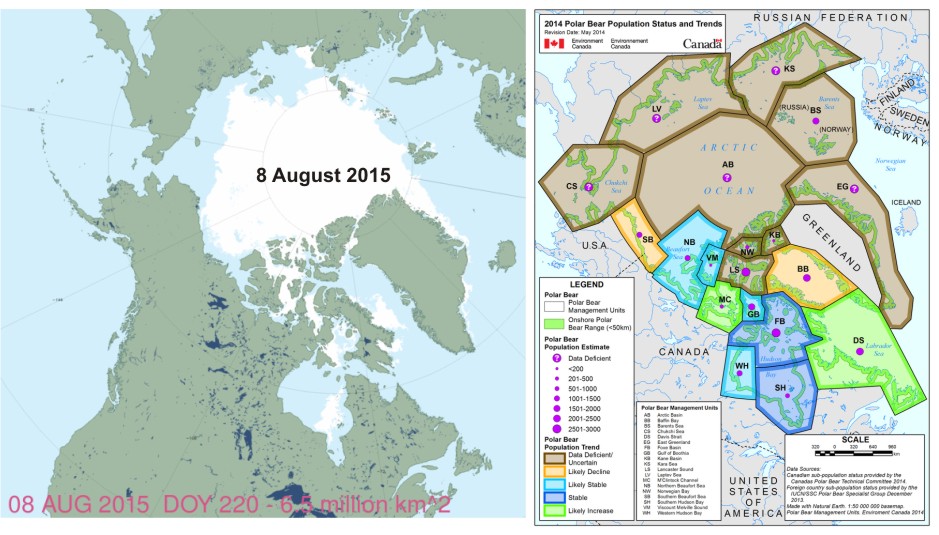
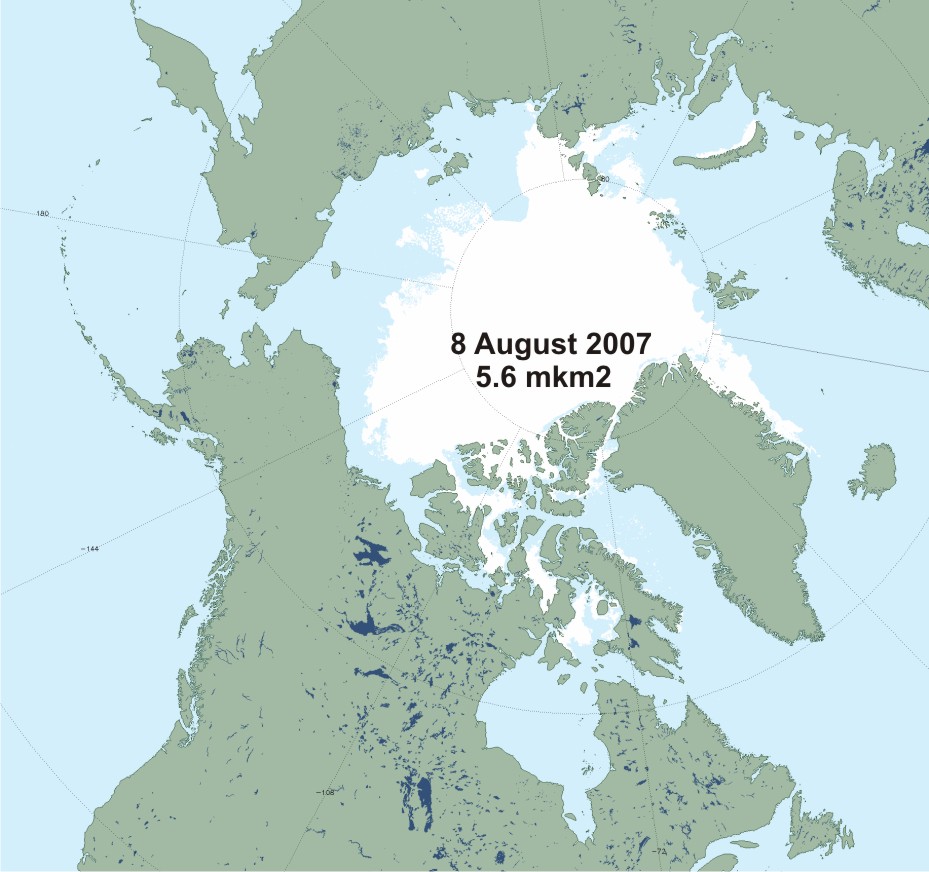
By this date in 2007 (8 August, Day 220, NSIDC Masie map below), there was almost 1 million km2 less ice than there is this year (map above). However, look which polar bear subpopulations not only survived, but thrived, through the 2007 low ice summer: Chukchi Sea, Southern Beaufort, Barents Sea, Davis Strait, Foxe Basin, Western Hudson Bay, and Southern Hudson Bay. That’s all of the subpopulations for which we have recent data.

There is more than a month left in the melt season, of course. However, while 2012 finished with a lower minimum ice extent due to a massive mid-August storm that broke up a lot of ice (Simmonds and Rudeva 2012), by the end of the first week of August (i.e, the 8th), there was more  ice in 2012 than in 2007 and a bit less than this year (2012, 6.3 mkm2; 2007, 5.6 mkm2; 2015, 6.5 mkm2).

This means if less summer ice for a longer period of time impacts polar bear health and survival, conditions in 2007 should have had a noticeable impact on polar bears around the world. They didn’t. That suggests even if this September sea ice minimum is as low as 2007, it won’t have any negative impact on polar bear health or survival. The most profoundly negative documented impacts have come from thick sea ice in spring or  suboptimal spring snow levels (Crockford 2015) and the evidence shows that variation in the extent of summer ice is simply irrelevant to polar bears.

Sea ice at 2007 Aug 8_polarbearscience
Continue reading

Polar bear habitat update: Eastern Canada well above normal, lots of sea ice worldwide

Sea ice in at least three Eastern Canadian polar bear subpopulations is well above normal for this time of year, which means many bears are likely not ashore yet. The same is true in the Beaufort and Barents Seas – ice is melting but there is still a fair amount of sea ice close to popular shores. Cause for cheering, not raising alarms.

Stirling 01 no date_sm

Southern Hudson Bay, Foxe Basin, and Davis Strait, all have above average sea ice coverage, according to the Canadian Ice Service (see charts below).

Sea ice concentration in Canadian waters at 23 July 2015. Canadian Ice Service. Click to enlarge.

Sea ice concentration in Canadian waters at 23 July 2015. Canadian Ice Service. Click to enlarge.

Hudson Bay ice levels are particularly striking: the anomaly map below (“departure from normal”) is almost entirely blue (positive), showing how far it is above average. No wonder supply ships needed icebreaker help yesterday to get into Inukjuak on the eastern shore. Most of the ice is technically in the Southern Hudson Bay polar bear subpopulation region, which has a stable population.

Continue reading