
What a difference a bit of historical perspective can make to one’s attitude on the annual Arctic sea ice breakup.

The usual recent pattern (since 1979) has been for breakup to begin on the east side. However, this year and last (below), it has begun in the NW (as it did in 1990 and a few other years).
Not all of the open water is due to melt, of course. As I discussed last week in relation to the Southern Beaufort Sea, winds and prevailing currents at this time of year start to fracture the ice and move it around well before much significant melt has begun.
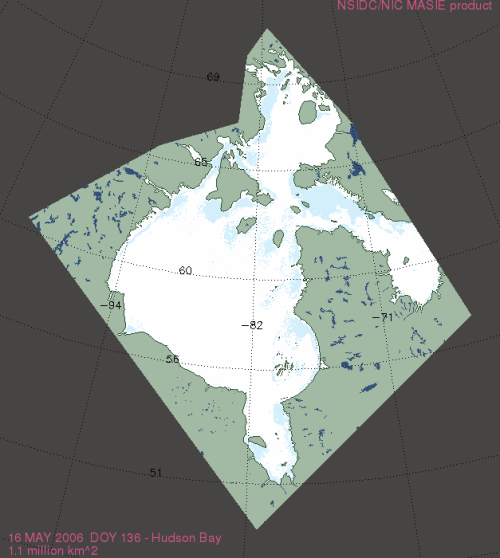
Compare 2016 (above) to 2006 (below), when there was 0.1 mkm2 less overall – with much less ice in Hudson Strait and in the east of Hudson Bay than this year:
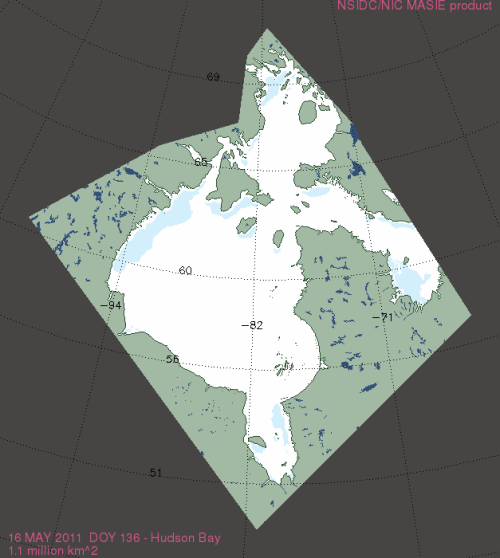
Compare to 2011, when there was also 0.1 mkm2 less overall than this year:
It’s important to keep in mind that the intensive feeding season for polar bears is drawing to a close – within another two weeks, most young-of-the-year seals will be in the water feeding and inaccessible to bears.
The only seals on the ice during June and July are predator-savvy adults and subadults that have hauled out to moult and for these seals the rapidly disintegrating ice creates many escape routes. That means that as long as the ice breakup sequence allows polar bears to get their fill of young seals before the end of May, even during early breakup years most bears should be fat enough to survive the coming summer and winter fasts (see more here). So we should expect to see some bears coming ashore within the next two weeks.
Last year? Rather like this year – certainly the same overall total:

Not all of this newly-opened water is melt, of course. Strong winds and prevailing currents also have an impact, and this year the sea ice is being driven away from the NW coast.
Here’s what the Canadian Ice Service map looks like for 17 May 2016:


You must be logged in to post a comment.