
This is a follow-up to my last post and this time, I’ll address the implied correlation between freeze-up dates for Hudson Bay and Churchill temperatures in November that is being made by folks who should know better .
Monday, 14 November 2016 a.m, over at Polar Bears International [my bold]:
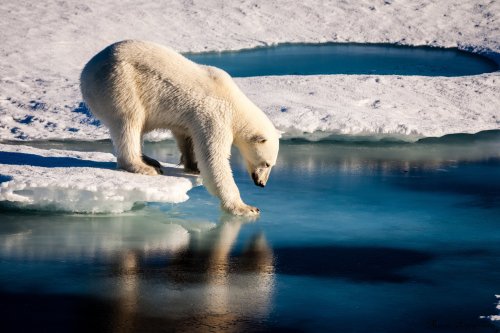
“As a new week starts in Churchill, the weather is the warmest we’ve ever seen at this time of year. The tundra is muddy, with remnant patches of snow, and the bay is ice-free.” PBI Blog (no author designated)
Well, that may be true for the last few years – the high on 14 November 2016 (-1.20C) was the highest since 2012.
Andrew Derocher made a similar statement on the 4th (my bold):
“There’s no sea ice anywhere in Hudson Bay yet—not even in the northern part of the Bay where ice should be forming. It’s above freezing today and if the forecast holds, it will be a record high for this date. It was 10 degrees colder last year at this time.”
Derocher is being unscientifically vague here and also misleadingly cites highs and lows as if they were the same. In fact, according to weather records kept by Environment Canada, for 4 November 2016 at Churchill, the daily high was +1.50C (compared to –1.50C in 2015). The daily low in 2015 was -15.30C, a 10 degree difference. The next-highest temp. for that date since 2012 was +0.70C in 2014 – hardly an earth-shattering difference.
However, if you are trying to draw conclusions about climate, you should go back at least 60 years (two climate periods of 30 years each). Temperature records for Churchill go back to 1943, which can be used to assess the claim for the 14th of November made by PBI.
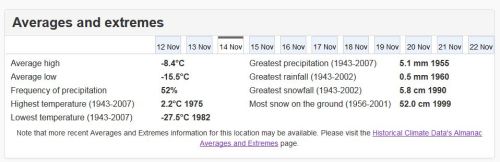
According to weather records kept by Environment Canada, for 14 November at Churchill, the year with the highest temperature was 1975 (+2.20C):
That was Monday. But as of yesterday, the weather recorded – and the forecast for the following week (17-23 November) was quite different, as the screencap below shows:
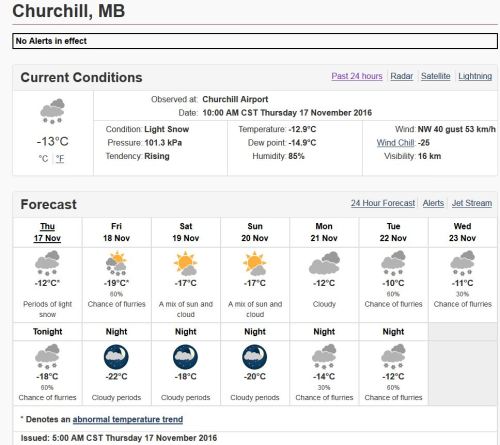
The final recorded max. for yesterday (Thurs. 17 Nov) was -9.70C vs. a min. of -17.70C. So, a bit warmer during the day than predicted but as cold as expected overnight.
And for today, the current temperature in Churchill, as I write this is, is -190C (-310C with the wind chill) and the year with the highest temperature recorded for 18 November was 1944 (0.00C) – which was also the highest temperature for the 19th, recorded in 1943.
Ice maps and historical background below. See last post for recent multi-year comparison.
Canadian Ice Service map for 18 November 2016:

Stage of development ice chart for 17 November 2016:
Years ago, Gough and Gough (2005) presented evidence showing an increasing trend in temperature at Churchill was correlated with a trend in earlier breakup dates for Western Hudson Bay (but not freeze-up dates) for Western Hudson Bay – a conclusion which Scott and Marshall (2009) later showed came down to a 12-day step change at 1988-1989 with no trends either side. Stirling and Parkinson (2006) pushed the temperature/breakup date correlation for polar bears, however, and that’s what most folks see.
Freeze-up in the past
While there appear to be no detailed records of freeze-up dates for Western Hudson Bay going back to the 1940s, Hare and Montgomery (1949:160) had this to say [my bold]:
There have as yet been no aerial reconnaissances in the late fall and early winter to observe the time of freeze-up. It is therefore possible only to repeat what has already been said by travellers and explorers in the region. There seems to be general agreement that along the coast the ice may form in the shallow bays early in November and in the mouths of rivers by the end of the month. In his journey to the Nastapoka Islands in 1910 R. J. Flaherty records that he was forced to wait at Fort George on the mainland until December before the Bay ice was solid enough for safe travel. … In the far northern part [based on experiences of the Thule expedition of 1921-1924] the small bays freeze over early in October23 or early in November.
Bottom Line: There are no published data suggesting that later than average WHB freeze-up dates are correlated with above-average temperatures at Churchill. Freeze-up of WHB in the last weeks of November is not out of the ordinary, historically speaking.
Be skeptical and verify. At today’s and tomorrow’s date, Churchill was warmest in 1943 and 1944 (based on records back to 1943) – but as far as I know, no records exist for what freeze-up dates were like in those years.
References
Gagnon, A.S. and Gough, W.A. 2005. Trends in the dates of ice freeze-up and breakup over Hudson Bay, Canada. Arctic 58: 370-382. http://arctic.synergiesprairies.ca/arctic/index.php/arctic/article/view/451
Hare, F.K. and Montgomery, M. R. 1949. Ice, open water, and winter climate in the eastern Arctic of North America: Part II. Arctic 2(3):149-165. Open access: http://arctic.journalhosting.ucalgary.ca/arctic/index.php/arctic/article/view/3985
Scott, J.B.T. and Marshall, G.J. 2010. A step-change in the date of sea-ice breakup in western Hudson Bay. Arctic 63:155-164. Available here (open access) http://arctic.synergiesprairies.ca/arctic/index.php/arctic/issue/view/55
Stirling, I. and Parkinson, C.L. 2006. Possible effects of climate warming on selected populations of polar bears (Ursus maritimus) in the Canadian Arctic. Arctic 59:261-275. http://arctic.synergiesprairies.ca/arctic/index.php/arctic/issue/view/16.


You must be logged in to post a comment.