
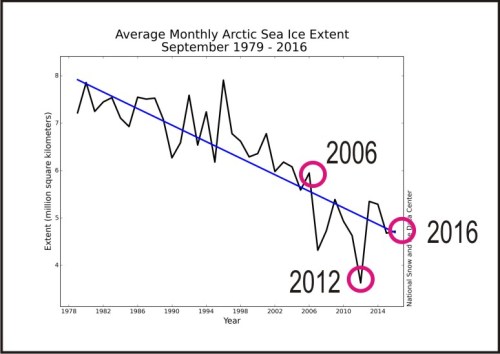
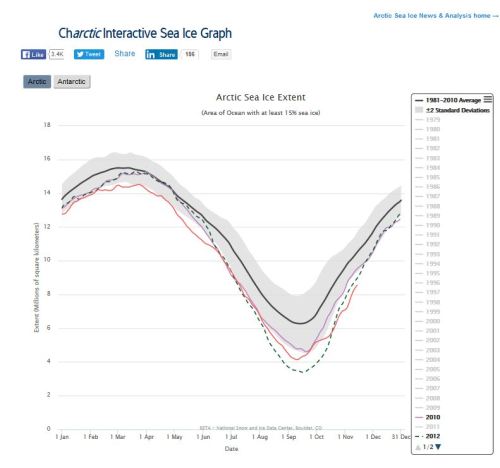
Guess which year between 2006 and 2016 had the latest start to freeze-up on Hudson Bay, given that 2012 had the lowest September average and 2007 and 2016 tied for second-lowest (see graph below, from NSIDC), and that sea ice in the Arctic right now is the lowest it’s been for this date since 1979?
If you guessed anything other than 2010, you guessed wrong – in addition, 2006 (not 2016) was second latest.
There is no correlation between Arctic sea ice coverage and freeze-up dates for Western Hudson Bay.
Yet, Polar Bears International (“Save Our Sea Ice”) – who were surely in and around Churchill in 2010 and 2006 watching polar bears – just posted an alarming statement about local conditions, implying that slow freeze-up of Hudson Bay this year is a reflection of the fact that “sea ice is at a record low across the Arctic.”
They also claim that “…the weather is the warmest we’ve ever seen at this time of year.” That may be true, but if so, it is also meaningless with respect to the progress of freeze-up.
Does no one at PBI remember the very late freeze-up of 2010 or 2006? Odd, that.
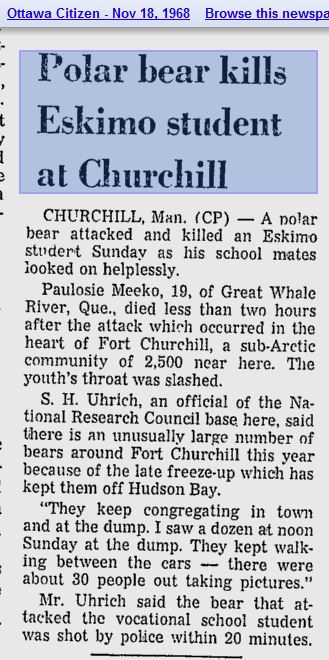
And how about 1983, when very late freeze-up resulted in the last known human fatality from a polar bear attack – or, 1968 (see below) when exactly the same thing happened!
Back to the ice records, have a look at the facts. Freeze-up is a bit late this year, without a doubt but it’s in no way shaping up to be the latest on record.
Freeze-up dates for Western Hudson Bay are actually quite variable, as you’ll see.
I’ve copied maps for 12 November (but the situation is not much different for 14 November).
Here is the 14 November coverage of sea ice for 2016, 2012 and 2010 (see NSIDC original here, where you can choose to see 2006 Arctic coverage as well): no question about it, Arctic sea ice is the lowest it’s been at this date since 1979.
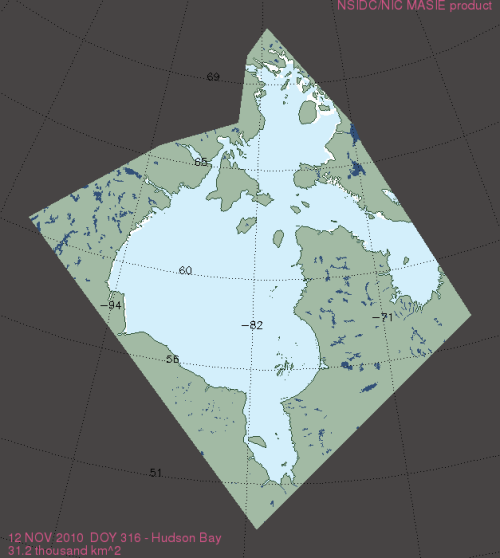
However, the daily NSIDC MASIE ice charts (maps for the Arctic, and for parts of it, rather than graphs of ice totals) go back to 2006 – and guess what? In 2010 at this date, there was much less ice in Hudson Bay than there is this year, which was also true in 2006.
2010: 31.3 mkm2;
2016: 153.2 mkm2
[2006: 47.0 mkm2]
The evidence is below: there is zero correlation between total Arctic sea ice (or the seasonal minimum) and freeze-up date for western Hudson Bay. Polar bear numbers in Western Hudson Bay are not declining, as some still claim against all evidence.
[As recently as 4 November 2016, in another post at PBI, polar bear specialist Andrew Derocher not only implied the same ‘low Arctic ice = late WHB freeze-up’ discussed in this post, he also made the following misleading statement about WHB polar bear population size [see the facts here]: “A low cub survival rate is one of the reasons the core of the western Hudson Bay population has declined about 30%.” ]
Compare the following.
Published freeze-up dates for Western Hudson Bay (1979-2010)

THIS YEAR – Tied with 2007 for 2nd lowest Arctic minimum
At 12 November 2016, there was just a skim of ice north of Churchill in western Hudson Bay, there was no ice in Hudson Strait, and Foxe Basin was only half filled with ice (a total of 153.2 mkm2 of ice):

LAST YEAR (2015)
At 12 November 2015, while there was no sign of ice on the shores of western Hudson Bay, Foxe Basin was filled with ice and already blocking off the entrance to Hudson Strait (which created a potential problem for killer whales that had entered the Bay to feed over the summer but had not yet departed). Yet, virtually all polar bears were on the ice by the 20th or 21st of November. On the 12th, there was a total of 372.7 mkm2 of sea ice – the greatest amount of all years shown here:

2006 – Highest Arctic September ice coverage since 2002
At 12 November 2006, there was only a skim of shorefast ice in northern Foxe Basin – the rest of Hudson Bay and Hudson Strait were ice-free (with a total of 47.0 mkm2 of sea ice):

2010 – Highest Arctic September ice coverage since 2006
At 12 November 2010, there was even less shorefast ice in northern Foxe Basin – the rest of Hudson Bay and Hudson Strait were ice-free (with a total of 31.3 mkm2 of sea ice):
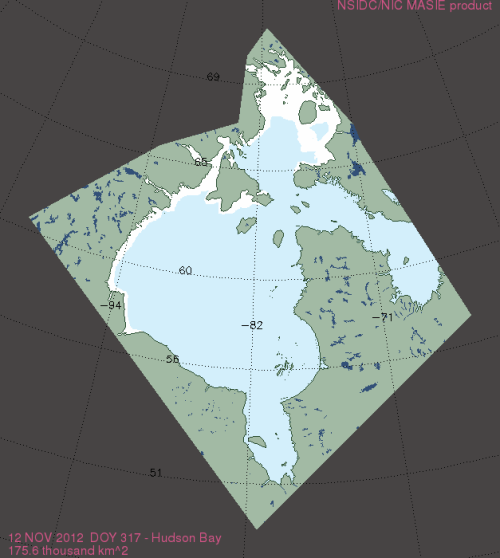
2012 Lowest September ice (and lowest Arctic minimum) since 1979
At 12 November 2012, there was a good deal of shorefast ice formed along the west coast to south of Churchill (which lies just north of the “-94” marked on this chart), northern Foxe Basin was almost filled with ice but Hudson Strait was ice-free (for a total of 175.6 mkm2 of sea ice):
2007 – Tied with 2016 for 2nd lowest Arctic minimum
At 12 November 2007, there was a skim of shorefast ice formed along the west coast to south of Churchill (less than in 2012) but more ice in Foxe Basin; Hudson Strait was ice-free (for a total of 198.6 mkm2 of sea ice):

References
Lunn, N.J., Servanty, S., Regehr, E.V., Converse, S.J., Richardson, E. and Stirling, I. 2016. Demography of an apex predator at the edge of its range – impacts of changing sea ice on polar bears in Hudson Bay. Ecological Applications, in press. DOI: 10.1890/15-1256


You must be logged in to post a comment.