
It’s just an observation but NSIDC Masie ice charts show 14.7 mkm2 of sea ice for 2017 at 19 February (Day 50) but only 14.3 mkm2 for 2006 (see them copied below).
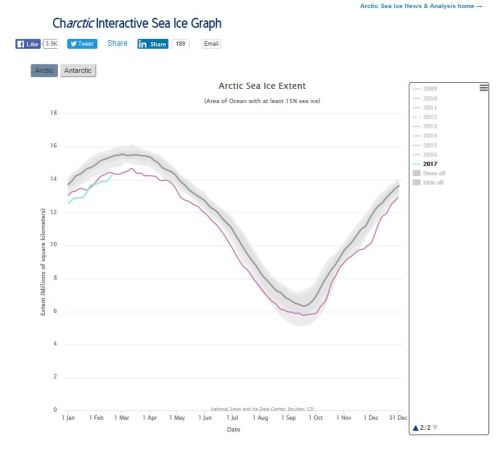
In contrast, the NSIDC interactive graph shows almost the opposite: 14.3 mkm2 for 2017 and 14.4 mkm2 for 2006 (but with both below 2 standard deviations of average).


You must be logged in to post a comment.