
Last week, the Norwegian Polar Institute updated their online data collected for the Svalbard area to include 2017 and 2018 — fall sea ice data and spring polar bear data. Older data for comparison go back to 1993 for polar bears and 1979 for sea ice, showing little to no impact of the reduced ice present since 2016 in late spring through fall.
Here’s what the introduction says, in part [my bold]:
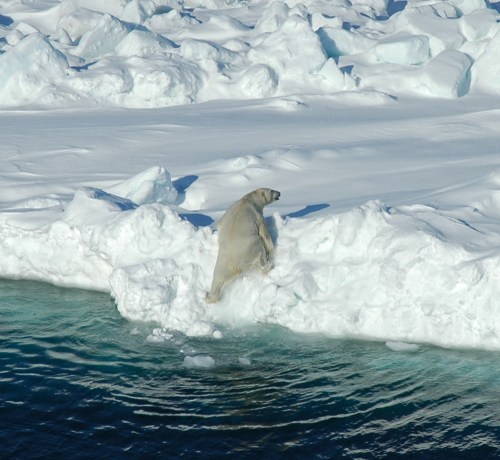
“…The polar bear habitat is changing rapidly, and the Polar Basin could be ice-free in summer within a few years. Gaining access to preferred denning areas and their favourite prey, ringed seals, depends on good sea ice conditions at the right time and place. The population probably increased considerably during the years after hunting was banned in 1973, and new knowledge indicates that the population hasn’t been reduced the last 10-15 years, in spite of a large reduction in available sea ice in the same period.”
See Aars et al. 2017 for details on the 2015 Svalbard polar bear population count, keeping in mind that the subpopulation region is called “Barents Sea” for a reason: only a few hundred individuals currently stick close to Svalbard year round while most Barents Sea bears inhabit the pack ice around Franz Josef Land to the east (Aars et al. 2009; Crockford 2017, 2018).
Below: Sea ice surrounding important denning areas for polar bears in Svalbard, original caption [my bold],
“The figure shows the number of days between 1 October and 31 December that had a sea ice cover exceeding 60% (within four 25×25 km pixels) in and around 5 major denning areas in Svalbard (Hopen, Kongsøya, Storfjorden, Sjuøyane and Nordaustlandet). The annual median value is represented by a line within each box, while box segments and lines over and under the median show the other data points for each year. There has been a decrease in the number of days with the given sea ice cover for all 5 areas over time (all p-values < 0.01). Fewer than 30 days with a 60% sea ice cover or more means that pregnant females will struggle to get to the denning area in time to breed, especially to the more distant islands such as Hopen, Kongsøya and Sjuøyane.”
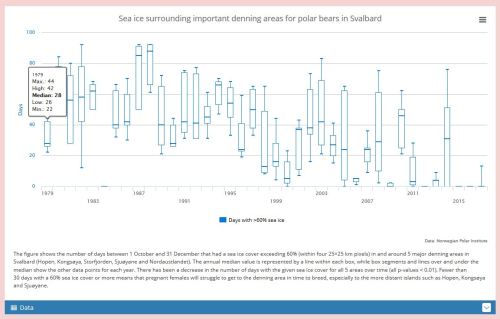
So, the last time there was enough ice around Svalbard for polar bears to den in the archipelago was the fall of 2014, just prior to the last population count. Since that time, females have had to make their dens on the sea ice or in the archipelago of Franz Josef Land to the east (Crockford 2018).
Andrew Derocher has been issuing twitter announcement this spring every time Svalbard area mobile pack ice dipped a bit in extent, voicing concerns about potential “trouble” or “challenges” ahead for polar bears (see below, from late May and mid-June) but the data collected for polar bears over the low ice years of 2016 to 2018 don’t support his pessimistic attitude.
https://twitter.com/AEDerocher/status/999674784953729024
https://twitter.com/AEDerocher/status/1007312204801060864
https://twitter.com/AEDerocher/status/1007684689526599681
15 June 2018 Derocher states:
“Before deniers protest, it’s the trend that matters for
#polarbears & it’s downward. Cherry picking isn’t science.”
Well, there may be an overall trend in declining ice around Svalbard at various times of year but there is little to no trend in measured aspects of polar bear life history (body condition, litter size, or number of females with cubs of various ages) to suggest polar bears have been negatively impacted by that sea ice trend (see data below).
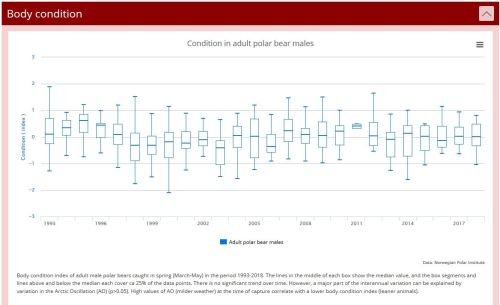
Below: Body condition of adult male polar bears, original caption,
“Body condition index of adult male polar bears caught in spring (March-May) in the period 1993-2018. The lines in the middle of each box show the median value, and the box segments and lines above and below the median each cover ca 25% of the data points. There is no significant trend over time. However, a major part of the interannual variation can be explained by variation in the Arctic Oscillation (AO) (p>0.05). High values of AO (milder weather) at the time of capture correlate with a lower body condition index (leaner animals).“
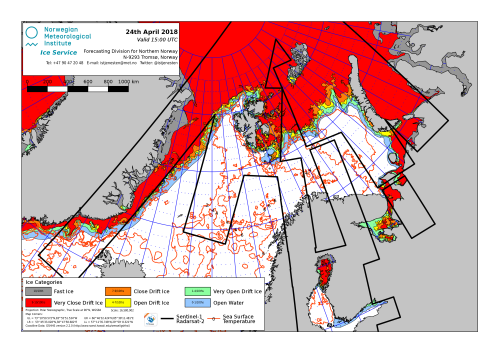
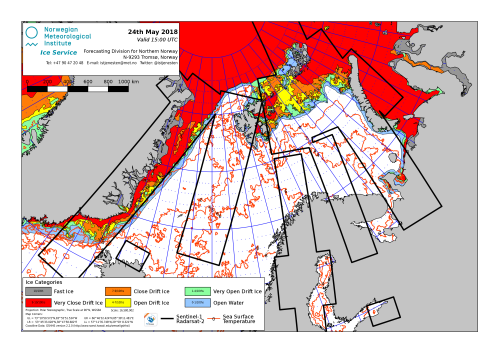
Below, sea ice extent for the Barents Sea at 24 April 2018, about the middle of the collection period for the data presented above:
Below, sea ice extent for the Barents Sea at 24 May 2018, at the end of the collection period for the data presented above:
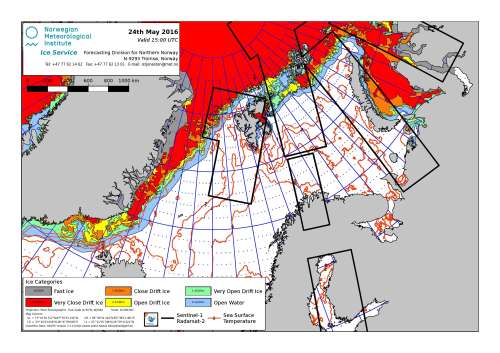
Below, sea ice extent for the Barents Sea at 24 May 2016 for comparison:
Below: Number of polar bear cubs per litter, original caption, collected in spring,
“Average litter size (cubs of the year); data from the annual capture-recapture program 1993-2018. There is a statistically significant (p=0.04) weak trend of decreasing litter size over time (red line). There is no significant effect on litter size from the Arctic Oscillation (p=0.339).”

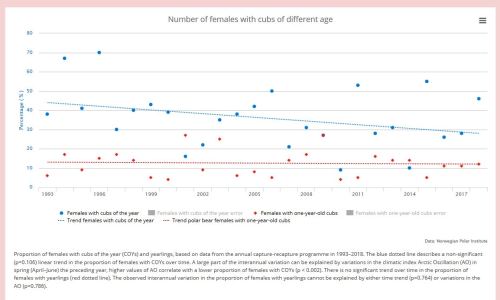
Below: Number of polar bear females with cubs of different ages, orginal caption, collected in spring,
“Proportion of females with cubs of the year (COYs) and yearlings, based on data from the annual capture-recapture programme in 1993–2018. The blue dotted line describes a non-significant (p=0.106) linear trend in the proportion of females with COYs over time. A large part of the interannual variation can be explained by variations in the climatic index Arctic Oscillation (AO) in spring (April–June) the preceding year, higher values of AO correlate with a lower proportion of females with COYs (p < 0.002). There is no significant trend over time in the proportion of females with yearlings (red dotted line). The observed interannual variation in the proportion of females with yearlings cannot be explained by either time trend (p=0.764) or variations in the AO (p=0.786).“
PDF of above (Aars et al. 2018), website link with raw data here.
Concluding remarks on status and trend
“The number of days with sea ice around all the five most important denning areas has experienced a dramatic negative trend since 1979. In some years, the ice has come late in all the areas the same year, and such years can prove challenging for females who have spent the summer in the pack ice to reach one of the relevant areas.
Data from the annual tagging programme shows a weak declining trend in litter size over years, but there is no significant decrease statistically significant correlation between litter size and the Arctic Oscillation (AO) index. There is no significant change over time in the number of cubs per adult female, or in the proportion of females with yearlings, but there is a significant correlation between AO-values in spring and these parameters. The results indicate that in years following mild spring seasons, often correlated with less sea ice, fewer cubs are born, compared to years after cold spring seasons. Mild winters typically have less sea ice than warmer winters. Polar bears feed intensely on ringed seals in the fast ice habitat in spring.
Production of one-year-olds may be a better parameter to judge reproduction because they have survived their first year and are more likely to reach weaning age. There was no trend over time or connection with the AO which succeeded in showing effects on the production of one-year-olds.
The links between the AO and body fitness in males show that milder weather in spring corresponds with poorer fitness, but there is no clear time trend.”
…
The most important human-induced pressure factor for polar bears is the loss of sea ice due to changes in climate. To be able to detect the effects of this as quickly as possible, the population monitoring of the polar bear is focusing on reproduction and body condition.
An aerial survey to estimate the size of the shared Norwegian-Russian Barents Sea subpopulation was carried out in 2004, and the resulting estimate was 2650 bears +/- ca 30%. A new survey of the Norwegian part of the population was conducted in August 2015, and the results do not show any sign of a reduction in population size. [my bold]
My conclusion
Recently reduced sea ice in the Svalbard region from late spring to fall has not had a measurably negative impact on polar bear health or survival. The is almost certainly due to the presence of more stable sea ice habitat surrounding Franz Josef Land within the Barents Sea subpopulation region.
References
Aars, J., Marques, T.A., Buckland, S.T., Andersen, M., Belikov, S., Boltunov, A., et al. 2009. Estimating the Barents Sea polar bear subpopulation. Marine Mammal Science 25: 35-52.
Aars, J., Marques,T.A, Lone, K., Anderson, M., Wiig, Ø., Fløystad, I.M.B., Hagen, S.B. and Buckland, S.T. 2017. The number and distribution of polar bears in the western Barents Sea. Polar Research 36:1. 1374125. doi:10.1080/17518369.2017.1374125
Crockford, S. 2017. Testing the hypothesis that routine sea ice coverage of 3-5 mkm2 results in a greater than 30% decline in population size of polar bears (Ursus maritimus). PeerJ Preprints 2 March 2017. https://doi.org/10.7287/peerj.preprints.2737v3
Crockford, S.J. 2018. State of the Polar Bear Report 2017. Global Warming Policy Foundation Report #29. London. pdf here.


You must be logged in to post a comment.