
Beaufort Sea ice coverage is about average for this time of year, again failing to decline in lock-step with other Arctic regions. Will there be lots of fat bears onshore like there was in 2019? Only time will tell.
Ice breakup on Hudson Bay ice has been faster than average this year even though last year and the year before were as slow as the 1980s, but the Beaufort Sea has shown a different pattern. What they had in common was 1998, which was a low point for both regions, as the graph for the Western Canadian Arctic shows below:

Here’s the ice chart for all of Canada and the Beaufort Sea in Alaska at 16 July 2021, which has retreated a bit beyond that recorded in weekly charts:

Below is what this year’s Beaufort Sea ice coverage looks like on the CIS chart showing ice stage of development (i.e. thickness) for the week of 12 July 2021, showing how much thick, multiyear ice is still present (brown), and where dark green is thick first year ice >1m:

Compare the above weekly ‘stage of development’ chart to the one from 2019 below, when sea ice retreat was more advanced; only in 1998 was the ice further offhsore at mid-July (according to the graph above):

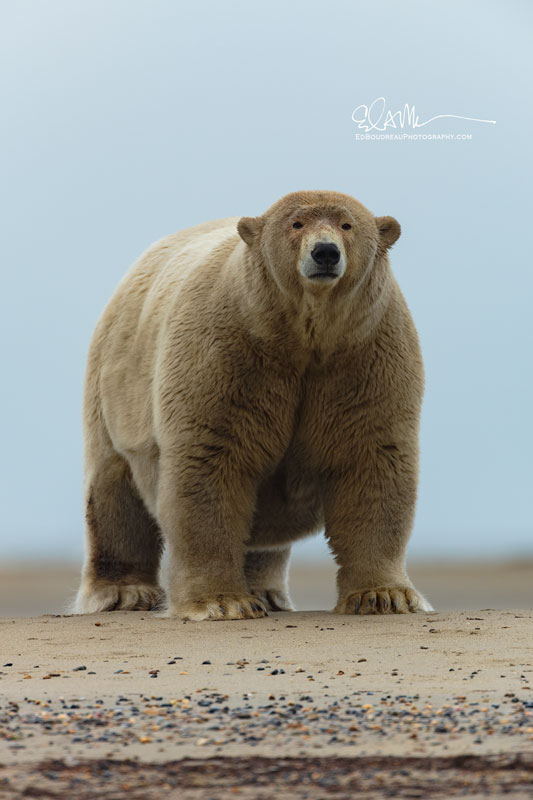
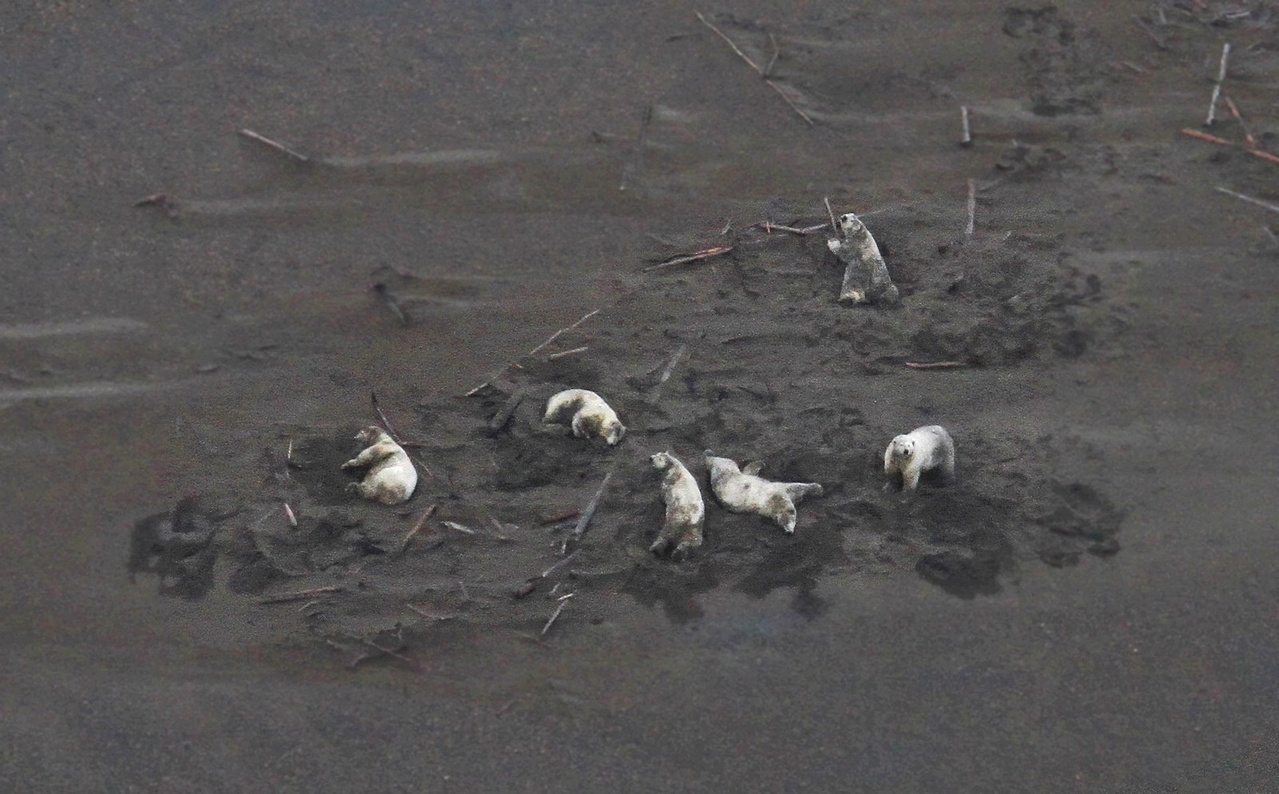
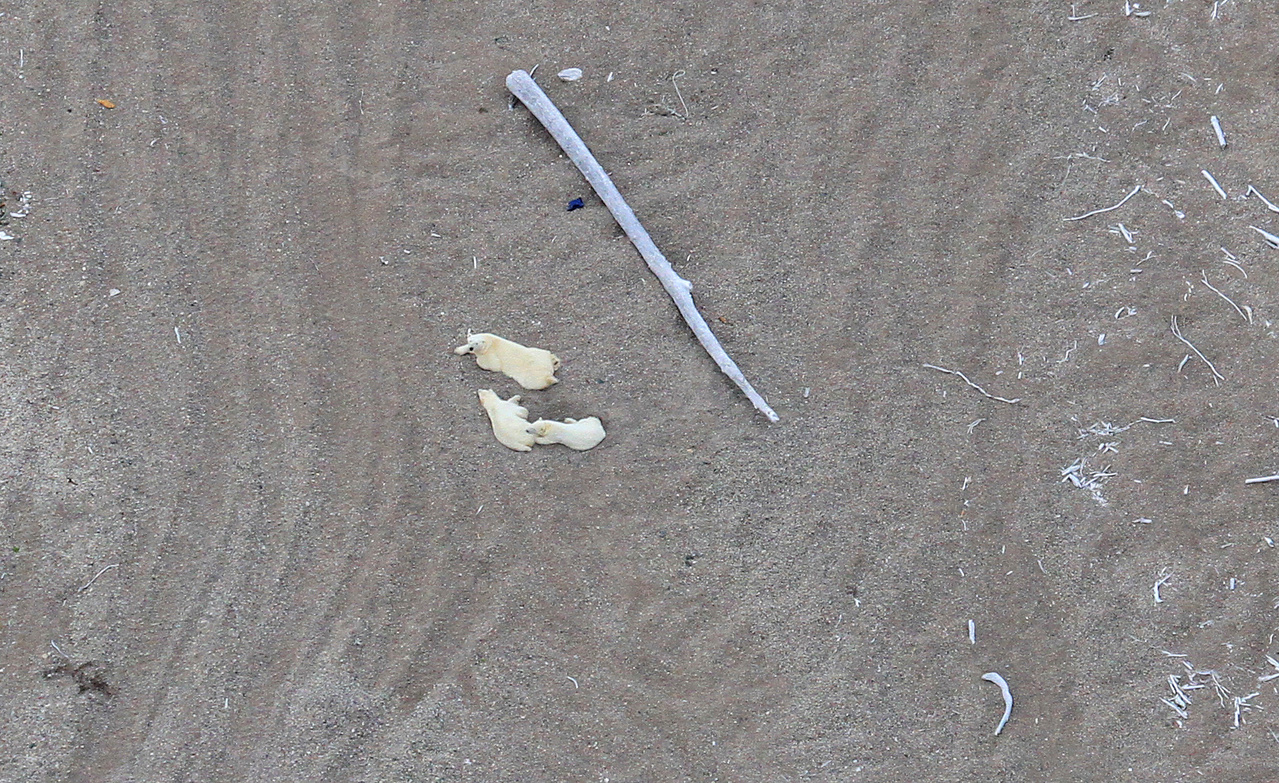
However, recall that the summer of 2019 was also the year when a survey of the Alaska coast in July showed more bears onshore (31) than in 2017 (3) when sea ice retreat was similar (and compared to 2012, when none were spotted) but all of those photographed in 2019 were fat and healthy:
So much for the ‘less summer sea ice = polar bears starved into extinction‘ meme.
Lets try ‘less summer sea ice=more food for polar bears‘.
PS. The last Southern Beaufort population survey showing no further decline in numbers since 2010 but it only went up to 2015.


You must be logged in to post a comment.