
Freeze-up in the Arctic (~October-November) is important to polar bears because for those animals that have spent the ice-free period on shore (not all do), it marks the end of their summer fast — they can finally resume seal hunting.
Polar bears in the most southern regions, like Southern Hudson Bay, Western Hudson Bay, and Davis Strait (see Fig. 1), routinely experience the longest ice-free period. As these bears all spend the summer on shore, they appreciate a timely return of the ice.

Figure 1. Polar bear subpopulations defined by the IUCN Polar Bear Specialist Group (PBSG), with a few extra labels added. I’ve rotated the original map 90 degrees (right) to make it easier to relate to the ice maps below. WH is Western Hudson Bay; SB is Southern Beaufort. Courtesy PBSG. Click to enlarge.
Southern Hudson Bay bear populations routinely experience an ice-free season that is just as long as it is for Western Hudson Bay bears. However, Southern Hudson Bay polar bears numbers have remained stable over the last 30 years. Some folks insist that Western Hudson Bay bear numbers are shrinking to a worrisome degree, despite indications that the recent decline could be nothing more than a return to sustainable levels after a rapid population increase in the late 20th century (similar to changes documented for the Davis Strait and Barents Sea subpopulations).
Have a look at how sea ice – essential polar bear hunting habitat – has developed within these regions over the last 10 days or so (end of November 2013) and how November 2013 compares to November 1979. The ice maps tell the freeze-up story.
Canadian Ice Service maps for November 20 and November 30 below; an animated map of ice development over the last 10 days is available here. Click to enlarge.
Globally, similar changes have been evident. See the MASIE sea ice maps for November 18 and November 29 below: ice extent grew by 1.2 mkm2 and finally reached Svalbard. Click to enlarge.

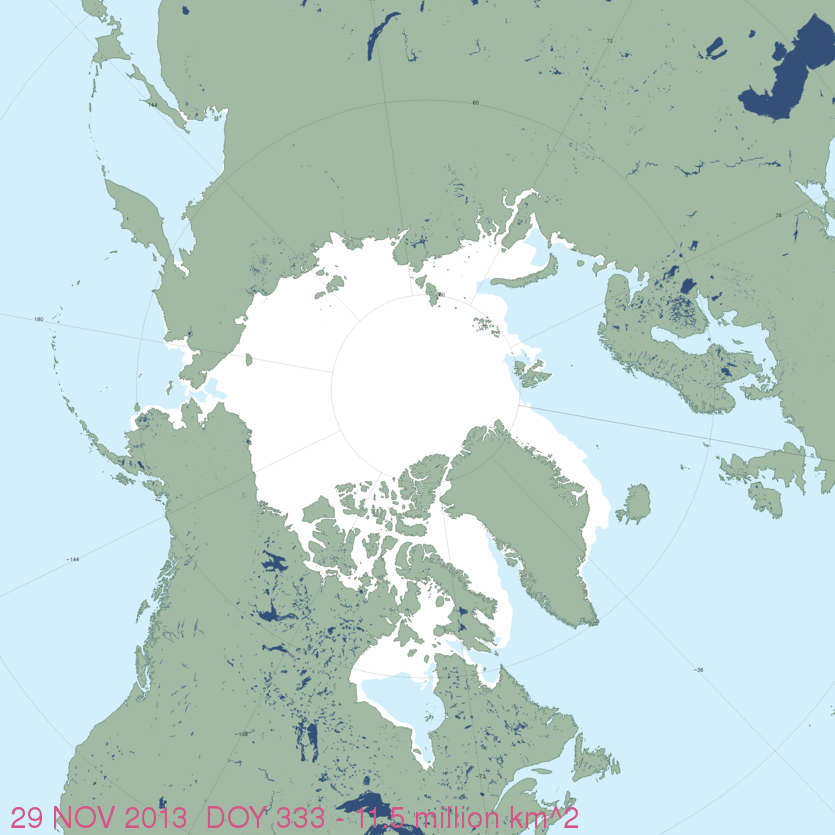
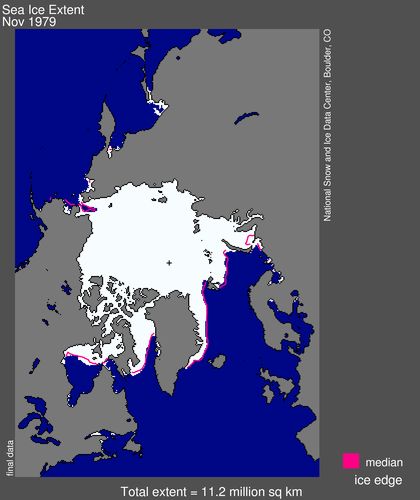
Below are the US National Snow and Ice Data Center (NSIDC) ice extent maps for November 29 2013 and for the end of November 1979 – the start of the satellite sea ice mapping record (more archived maps):


You must be logged in to post a comment.