Tag Archives: Southern Hudson Bay

Hudson Bay polar bear habitat is highest in more than two decades for this time of year

More ice in Hudson Bay and adjacent regions than we’ve seen at this time of year for more than two decades: not since 1993 has there been as much polar bear habitat in the 2nd-last week of November.

Sea ice Canada 2018 Nov 22

The anomaly chart for this week is almost all blue:

Hudson Bay weekly departure from normal 2018 Nov 19

Other years back to 1994 had much less ice for the 2nd-last week in November, as the charts below show. Colour charts are only available from 2004.

Continue reading

Environment Canada maps of polar bear population and status assessments 2018

Just out (6 June 2018) — new population assessment and status maps of the 19 polar bear subpopulations according to Environment Canada. Contrary to the map presented at the Range State meeting in February 2018 (pdf here), these maps show Western Hudson Bay and Southern Hudson Bay (along with the Southern Beaufort) as “likely declined.” A new category has been added for the Barents Sea: it’s considered “data deficient/uncertain,” but a population estimate of 2,001-3,000 has been provided.

No press release or other notice regarding the availability of these new maps was issued, as far as I know: I came across them by accident while looking for something else.

Global pb status and population map EC 2018

Global map above, more below, including a comparative map that shows 2010, 2014, and 2018 together. I will update the two recent posts of mine (here and here) that used the February Range State map with the information that more recently revised maps are now available.

Continue reading

Southern Hudson Bay polar bear region shows slight decline after decades of low sea ice

A newly-published paper by Martyn Obbard and colleagues in the journal Arctic Science claims a 17% decline in abundance of polar bears in the Southern Hudson Bay region after years of reduced sea ice and declining body condition (Obbard et al. 2018). The decline in numbers was not statistically significant but an additional statistical analysis (“Monte Carlo simulation”) not applied to any other estimate in recent years suggested the decline could be real, so a real decline is what was reported to the press.

James Bay polar bear_ministry of Ontario_Walton photo

Only one Canadian Press story has so far been circulated amongst outlets in the media (published hours after the paper appeared online, not at the same time), suggesting there was no press release issued for this study. Odd, that — especially if the decline is as real and significant as the authors suggest.

While no evidence was provided for a correlation of this decline in numbers to recent (2012-2016) sea ice decline, previous evidence from the region (Obbard et al. 2016) showed a decline in body condition was correlated only with much later than usual freeze-up, a situation that did not occur from 2012 to 2015 (freeze-up was late in the fall of 2016 but occurred months after the Obbard et al. (2018) survey was completed).

Moreover, the paper reports that a decline in survival of yearling cubs (from 12% of the population in 2011 to 5% in 2016) was not associated with especially poor sea ice conditions in spring. We are likely to see a follow-up paper next year reporting the body condition and sea ice data from this study (as for the previous survey: Obbard et al. 2015, 2016), but there is no suggestion in this paper that body condition declined further from 2011/2012 levels or that sea ice conditions deteriorated markedly enough after 2012 to precipitate a population decline.

UPDATE 11 June 2018: See below, more recent versions of population and status assessment maps has been issued by Environment Canada that conclude Southern Hudson Bay is “likely declined.”

Continue reading

Recent studies show Sept ice of 3-5 mkm2 did not kill polar bears off as predicted

The annual Arctic sea ice minimum for 2016 is imminent and the hand-wringing about polar bear survival has already begun. While this year is shaping up to be another very low sea ice minimum in the Arctic – not as low as 2012 but lower than as low as 2007 (previously the 2nd lowest since 1979) – contrary to predictions, several recent studies show that such low sea ice coverage in summer has had no (or very limited) negative effects on polar bear health and survival. In fact, for polar bears in some areas low summer sea ice has been quite beneficial (although these are not the populations that polar bear specialists predicted would do better).

polar_thin_ice Jessica Robertson_USGS

Since low summer extents of recent magnitude (3.0 – 5.0 mkm2) are clearly not any sort of threat to polar bears, it seems improbable that even an ice-free (≤ 1.0 mkm2) summer (e.g. Wang and Overland 2015) would be devastating to the species [don’t forget Cronin and Cronin 2016: they’ve survived such conditions before] – as long as conditions in spring allow for the necessary concentrated feeding on young seals.

sea-ice-mins_2007_2012_2015_polarbearscience
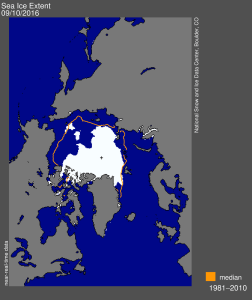
Above: Top, minimum at 2012 (16 Sept, 3.41 mkm2, lowest since 1979); Center, 2007 (18 Sept, 4.17 mkm2); Bottom, 2015 (9 Sept, 4.50 mkm2), from NSIDC. Below: sea ice at 10 Sept 2016, 4.137 mkm2 – minimum not yet called).

sea-ice-extent-2016-sept-10_nsidc

Recall that in 2006, the IUCN Polar Bear Specialist Group based their conservation status of ‘vulnerable’ (likely to become threatened within the next 45 years due to reduced habitat) on the predictions of sea ice specialists (see 2008 update here).

Sea ice experts in 2005 predicted such low summer sea ice extents as polar bears have endured since 2007 (3.0 – 5.0 mkm2) would not happen until 2040-2070, at which time PBSG biologists said that >30% of the world’s bears would be gone.

Evidence to the contrary comes from polar bear specialists working in the Chukchi, Beaufort, and Barents Seas – and in Southern Hudson Bay – since 2007. Overall, the latest IUCN Red Book assessment (2015) put the global population size at 22,000-31,000 (or about 26,500).

All of this means that those polar bear experts were wrong: polar bears are more resilient to low summer sea ice conditions than they assumed.

UPDATE 2 January 2017: I’ve added some quotes from the original USGS reports that explicitly state their dire predictions for 2050 that differ from the predictions made by the IUCN Polar Bear Specialist Group.
Continue reading

Polar bears and W. Hudson Bay sea ice breakup 2016

Breakup for Western Hudson Bay (WHB) is looking to be later than usual this year, given that the average breakup date since 1991 has been July 1 (using a 30% threshold) – only a few days from now – and the ice in WHB is nowhere near 50% coverage, let alone 30%.

Churchill_Polar_Bear_2004-11-15 Wikipedia

Note that few WHB bears come off the ice around Churchill – most come ashore along the southwest coast of Hudson Bay (almost into SHB) and make their way north over the course of the summer to meet the ice as it reforms in the fall north around Churchill – that’s why it’s called a “migration.”

map-WesternHudsonBay

There’s still a lot of ice left in Hudson Bay, as the Canadian Ice Service map for 29 June 2016 (below) shows: Sea ice extent Canada 2016 June 29 CIS

It seems to me that breakup for WHB this year is looking rather like 2014, which was something like a week later than the average since 1991, but time will tell. See below for comparison to 2009 (a late breakup year), 2015, and 2013 (lots of variability!), as well as a discussion of when bears come ashore in relation to this sea ice breakup benchmark.

Continue reading

Southern Hudson Bay polar bears are not starving to death

Reposted from 23 March 2016: Despite the fact that the polar bears of Southern Hudson Bay (SHB) live further south year round than any others, a recent study found their average body weight has declined relatively little since the 1980s. There has been no decline in the size of the population over that time either.

James Bay female and cub_Ontaro Govt

Remarkably – despite what we are told about how critical breakup dates are to polar bear health and survival in Hudson Bay – this study found that for SHB bears, the small decline in body condition index correlated only with freeze-up dates, not breakup dates or length of the ice-free season. They also found that regional breakup and freeze-up dates relevant to polar bears in this area was the day when ice cover reached 5% (not 50%).

In other words, SHB polar bears left the ice (or returned to it) when the average ice cover near the coast was about 5%. This finding is yet more evidence that the meteorological definition of “breakup” (date of 50% ice cover) used by many researchers (see discussion here) is not appropriate for describing the seasonal movements of polar bears on and off shore.

The news (two weeks after this post originally went up, see also here), however, is about the bit of weight decline, hyped to the maximum.

Continue reading

Condition of S Hudson Bay polar bears varies with freeze-up only says new study

Despite the fact that the polar bears of Southern Hudson Bay (SHB) live further south year round than any others, a recent study found their average body weight has declined relatively little since the 1980s. There has been no decline in the size of the population over that time either. Perhaps that’s why there was neither a press release nor a massive media blitz when this paper came out earlier this month.

James Bay female and cub_Ontaro Govt

Remarkably – despite what we are told about how critical breakup dates are to polar bear health and survival in Hudson Bay – this study found that for SHB bears, the small decline in body condition index correlated only with freeze-up dates, not breakup dates or length of the ice-free season. They also found that regional breakup and freeze-up dates relevant to polar bears in this area was the day when ice cover reached 5% (not 50%).

In other words, SHB polar bears left the ice (or returned to it) when the average ice  cover near the coast was about 5%. This finding is yet more evidence that the meteorological definition of “breakup” (date of 50% ice cover) used by many researchers (see discussion here) is not appropriate for describing the seasonal movements of polar bears on and off shore.

Continue reading

Some polar bears make poor choices, like this one in James Bay

CBC reported this morning that a polar bear was shot last Friday (18 December) at the dump in Moose Factory, Ontario – long past the date when bears in Southern Hudson Bay are usually out on the ice. But a single bear in trouble does not spell catastrophe for the species or the local population: how many times does this need to be said?

Moose Factory_Wikipedia

Claims of “almost no ice” seem a bit disingenuous, since this seems to be the only bear caught in this situation (if there are others, no one has reported it): other bears appear to have either made use of the ice that was present (see map below) or walked north until they found more ice. This bear (picture below) seems to have decided that the fare on land might do for a while longer, which suggests he’s either a subadult bear (with little experience) or an old one – looks like the former to me in the picture below but the report doesn’t say.

Moose Factory_polar-bear-in-dump_CBC Dec 22 2015

Continue reading

Hudson Bay, Davis Strait and Foxe Basin sea ice highest since 1992

We are seeing one of the extremes in Hudson Bay sea ice variability this year, not only in extent but in distribution of ice. Ice coverage on Hudson Bay this year at 28 July was twice what it was in 2009, the last “late” ice breakup year for which detailed ice maps are available (409 vs. 204 thousand km2), according to NSIDC MASIE ice maps. Canadian Ice Service data show 2015 coverage for the week of 30 July was the highest since 1992.

Churchill_Polar_Bear_2004-11-15 Wikipedia

The odd pattern of ice distribution presents a conundrum. Have a look at the maps and graphs below.

Continue reading

Polar bear habitat update: Eastern Canada well above normal, lots of sea ice worldwide

Sea ice in at least three Eastern Canadian polar bear subpopulations is well above normal for this time of year, which means many bears are likely not ashore yet. The same is true in the Beaufort and Barents Seas – ice is melting but there is still a fair amount of sea ice close to popular shores. Cause for cheering, not raising alarms.

Stirling 01 no date_sm

Southern Hudson Bay, Foxe Basin, and Davis Strait, all have above average sea ice coverage, according to the Canadian Ice Service (see charts below).

Sea ice concentration in Canadian waters at 23 July 2015. Canadian Ice Service. Click to enlarge.

Sea ice concentration in Canadian waters at 23 July 2015. Canadian Ice Service. Click to enlarge.

Hudson Bay ice levels are particularly striking: the anomaly map below (“departure from normal”) is almost entirely blue (positive), showing how far it is above average. No wonder supply ships needed icebreaker help yesterday to get into Inukjuak on the eastern shore. Most of the ice is technically in the Southern Hudson Bay polar bear subpopulation region, which has a stable population.

Continue reading