
UPDATE February 11, 2014. A reader (Kevin, at “Afton’s Waterfowl List”) has pointed out an error in Fig. 3, where I inadvertently labeled the bars on the upper graph as ending in 2011 instead of 2012 (the Pembroke graph ends at 2011. sigh..). I have corrected the figure and the text that refers to it, but do not believe it affects the overall conclusion. See for yourself. Thanks Kevin — and Alan for getting in touch!
Another round of press release inspired news stories emerged last week insisting that polar bear predation on ground-nesting birds during the summer ice-free period is evidence that they are nutritionally stressed by global warming.
A few weeks ago it was snow goose eggs in Western Hudson Bay – this time it’s thick-billed murre (Uria lomvia) and common eider (Somateria mollissima) eggs in Foxe Basin and Hudson Strait (e.g. see the story at Canada’s National Post and a short summary provided by Science [and it’s not even their paper!]). The source of the media attention this time is a newly-published paper by Samuel Iverson and colleagues (Iverson et al. 2014).
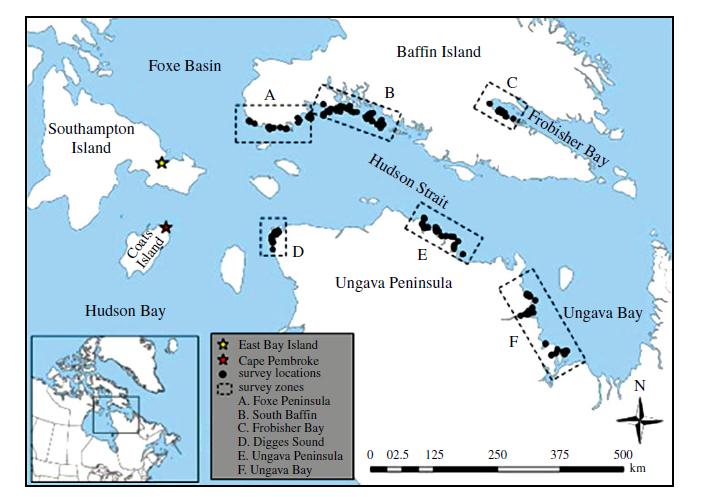
Figure 1. From Iverson et al. 2014 (their Fig.1), “map of the study area.” Most of the study sites are within the Foxe Basin polar bear subpopulation region (see Fig. 2 below), although the Ungava Peninsula (E), Ungava Bay (F) and Frobisher Bay (C) sites are in the Davis Strait subpopulation.
Polar bears have always preyed on ground-nesting sea bird and goose eggs while onshore (see Kelsey Eliasson’s take on the situation around Churchill, at his PolarBearAlley blog). The issue in this case is whether the increase in predation can be unquestionably blamed on reduced sea ice cover and nutritionally-stressed bears – that is, predation increases that correlate with year-to-year sea ice changes and bears in poor condition found consuming bird eggs.
As I did for the “polar bears eat more caribou and snow geese than they used to” press release, I refused to take the PR or the news stories at face value and went to the published paper and its supplemental data (it’s open access, see it for yourself here).
What I see in this paper is a spurious sea ice correlation and no data on the condition of the few bears observed consuming eggs. There is also no mention of the fact that polar bear numbers have increased in part of the study area (Davis Strait) or that bears in Foxe Basin and southern Davis Strait have been found to be in very good condition and reproducing well (Rode et al. 2014; Peacock et al. 2013). See my analysis below and judge for yourself.
Researchers Samuel Iverson and Grant Gilchrist are both quoted in the press release issued Wednesday February 5, 2014 by Carlton University (pdf here):
“Bears are arriving at these colonies in response to climate change and shrinking ice,” said Carleton’s Gilchrist. The birds aren’t used to this new threat and in many cases it is proving to be devastating. The increase in bear numbers has been so great that to protect our research crew we have had to shorten our field season. When you are on an island that is 800 metres long with three bears, you are camping with them.”
Given less opportunity to hunt for seals, bears are turning to alternative prey to offset nutritional shortfalls. Eggs of colonial nesting birds are on such alternative prey item. Bears have long been known to eat them, but the paper concluded that the behaviour is on the rise.
“Our research shows a seven-fold increase in bear incursions at one nesting site that has been monitored since 1997 [Fig. 2 below] and an eight-fold increase at another monitored since 1988 [Fig. 3 below],” said Iverson. “At the first site, the increased presence of bears has caused near total reproductive failure in recent years.” [my bold]
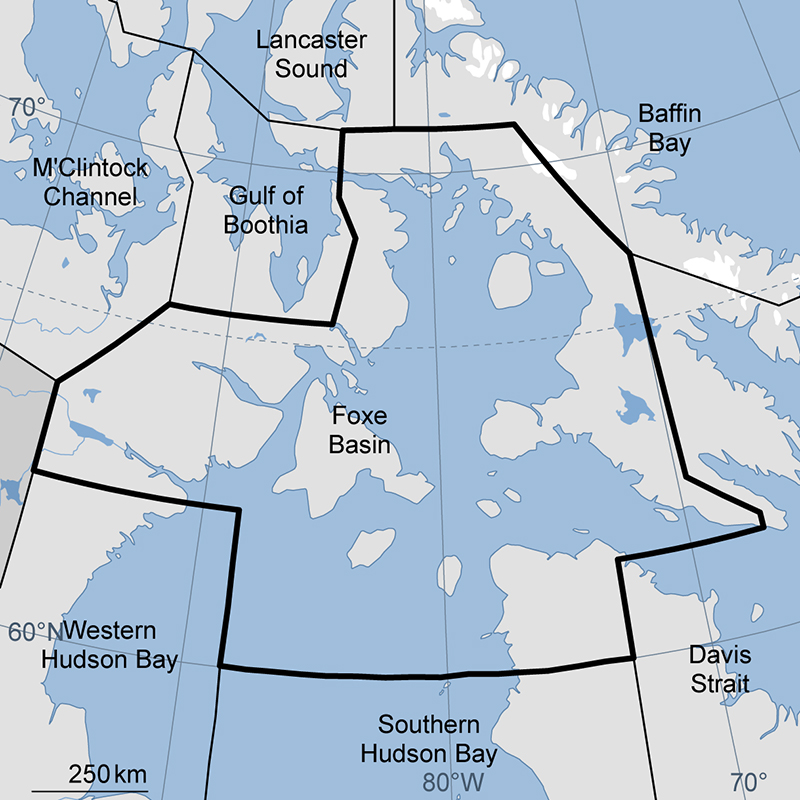
Figure 2. The study area of this paper (Fig. 1) covers parts of the Foxe Basin polar bear subpopulation and the southern portion of the Davis Strait subpopulation that spends summers on the Northern Labrador coast and the southeast shore of Baffin Island. Courtesy IUCN Polar Bear Specialist Group.
There were three parts to this study: 1) a long-term survey of one common eider colony and 2) one thick-billed murre colony (16 and 20 years, respectively) in Foxe Basin, and 3) a recent three year survey (2010-2012) of a larger area that included Hudson Strait (areas “A-F” in Fig. 1).
Oddly, despite the fact that the researchers collected data on sea birds in mid-summer (mid-June to mid-August), they used a sea ice metric (“ice season length, # days with ice cover >30%”) for the entire winter-early summer sea ice season rather than breakup dates associated with each summer’s breeding season.
1) East Bay Island common eider colony long term study
East Bay Island, off Southampton Island in Foxe Basin (Fig.1), is the colony where the authors say they found a “seven-fold” increase in the presence of bears. The supplemental data file provided with the paper (pdf here) contains this description of the location, the largest known eider nesting colony in the Canadian Arctic:
“The colony is situated in a protected bay that is seasonally covered with landfast sea ice that typically melts several weeks later than the sea ice in surrounding, more open water areas.
…
“Ringed seals (Pusa hispida) are frequently observed in the vicinity of the island hauled out onto the sea ice and bearded seals (Erignathus barbatus) are occasionally observed.”
That fact that this region routinely retains sea ice longer than others during the breakup period in mid-summer means bears will be attracted to the lingering ice as a hunting platform, putting them conveniently close to ground-nesting eiders once the ice finally melts. Sound like a less than ideal location for the eiders.
So what does the data they collected look like?
The sea ice data for East Bay Island is presented in the published paper while the “polar bear presence on the colony” data is in one of the supplemental data files. Because few people ever bother to examine supplemental files, I’ve combined them into one image so they can be more easily compared (Fig. 3).
Looking at the two graphs one above the other, I noted the following: 2009 had a relatively long ice season with a relatively high bear presence (although not as high as 2011, which had a short ice season). Conversely, 2005 had an ice season almost as long as 2009 but relatively low bear presence. In 2006, the ice season was longer than 2007 (which was a low ice season) but had exactly the same number of days with bears present.
While there is indeed an overall trend in both data sets over time there is little year-to-year correlation of ice season length with polar bear presence on the eider colony. This suggests that any “correlation” the authors found is due to the magic of statistics, not a biologically meaningful relationship.
![Figure 3. Two graphs from Iverson et al. 2014. Top (their supplemental Fig. S3a): “the number of days on which one or more polar bears was sighted at the East Bay Island,” eider colony, from 1997-2012. That could be the same bear sighted every day over that period or several sighted on multiple days. Bottom (their Fig. 2): “decline in annual sea ice coverage in Northern Hudson Bay Narrows” for 1988-2012 (days with >30% ice). While there is a trend in both data sets, note the lack of a consistent correlation between length of ice season (bottom) and polar bear presence (top) year-to-year, especially for 2009 vs 2011 and 2005 vs 2001. [this is the corrected version]](https://polarbearscience.com/wp-content/uploads/2014/02/iverson-et-al-2014-east-bay-sea-ice-graphs-combined_feb-11-2014-corrected.jpg)
Figure 3. Two graphs from Iverson et al. 2014. Top (their supplemental Fig. S3a): “the number of days on which one or more polar bears was sighted at the East Bay Island,” eider colony, from 1997-2012. That could be the same bear sighted every day over that period or several sighted on multiple days. Bottom (their Fig. 2): “decline in annual sea ice coverage in Northern Hudson Bay Narrows” for 1988-2012 (days with >30% ice). While there is a trend in both data sets, note the lack of a consistent correlation between length of ice season (bottom) and polar bear presence (top) year-to-year, especially for 2009 vs 2011 and 2005 vs 2009. [corrected version]
Cape Pembroke is on the north end of Coates Island in Foxe Basin and hosts a cliff-side colony of thick-billed murres. As for the East Bay data, I put Iverson and colleagues’ Cape Pembroke thick-billed murre data alongside their sea ice graph, with a similar result (Fig. 4 below).
As for East Bay, the data indicate no year-to-year correlation of ice season length with polar bear presence. The only marked increase in bear sightings was confined to 2010 and 2011 – two years out of 20.
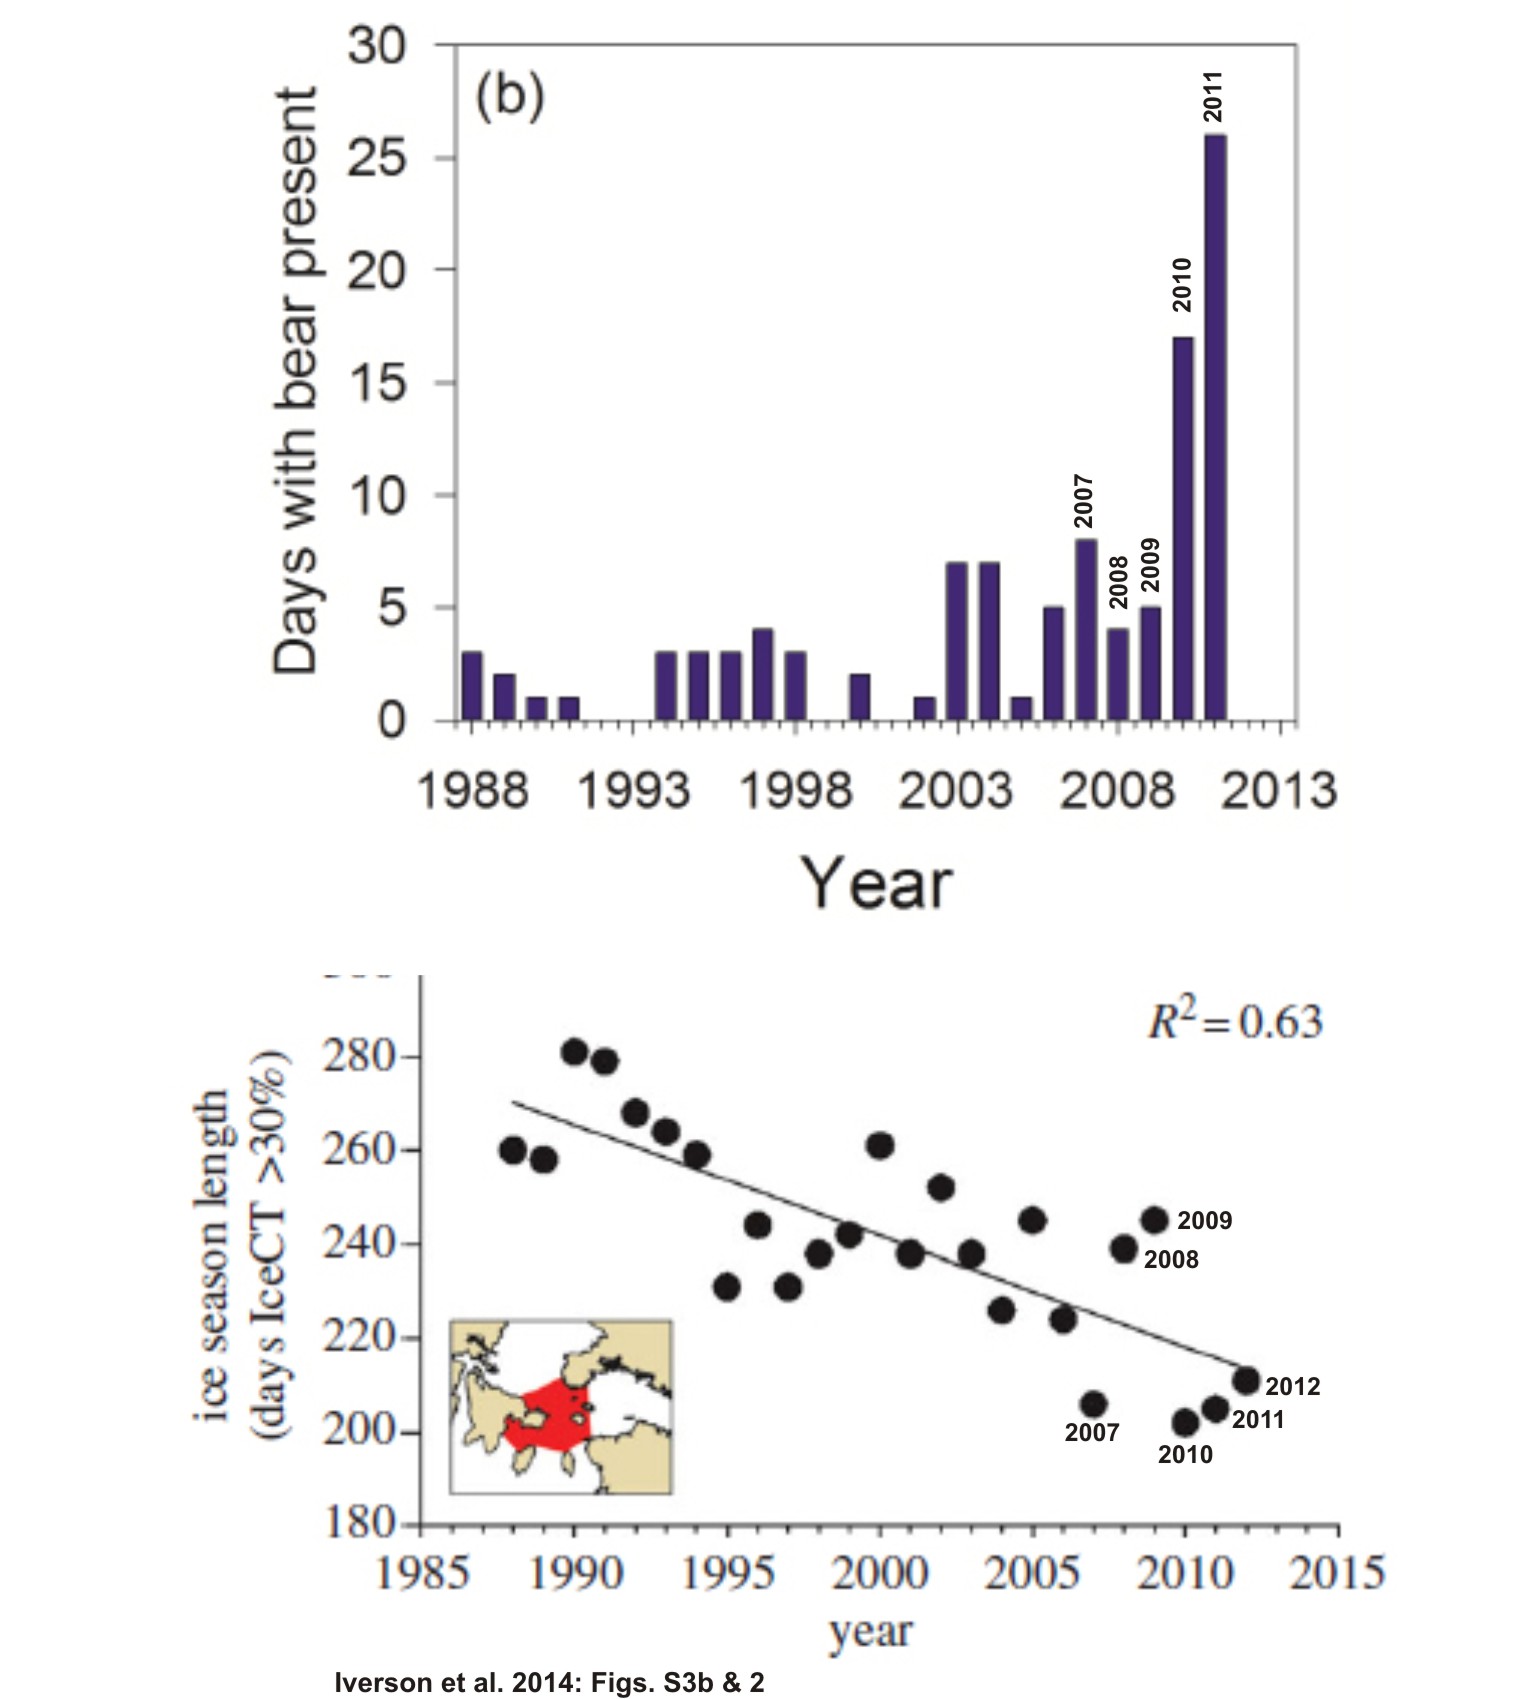
Figure 4. Two graphs from Iverson et al. 2014. Top (their supplemental Fig. S3b): “the number of days on which one or more polar bears was sighted at the Cape Pembroke thick-billed murre colony,” 1988-2011. That could be the same bear sighted every day over that period or several sighted on multiple days. Bottom (their Fig. 2): “decline in annual sea ice coverage in Northern Hudson Bay Narrows” for 1988-2012 (days with >30% ice). While there is a trend in both data sets, note the lack of a consistent correlation between length of ice season (bottom) and polar bear presence (top) year-to-year, especially for 2007 vs 2011. The real increase in bear sightings was confined to 2010 and 2011 – two years out of 20.
3) Three year survey (2010-2012) of Hudson Strait common eider colonies
This is what the authors say about the ice conditions in Hudson Strait from 2010 to 2012:
“These years coincided with the three lowest early summer ice coverage extents on record in Northern Hudson Bay Narrows and three of the four lowest ice coverage extents on record for Hudson Strait. However, variation in ice coverage was apparent among locations and across years, with 2012 being a relatively heavy ice year (IceCT > 70% on 25 June) in the Foxe Peninsula, South Baffin and Frobisher Bay survey zones.”[my bold]
During this survey, the bird researchers counted only 22 bears (including four cubs, Fig. 5) on 16 out of 230 island colonies (which is one bear, or a female bear plus one or two cubs, per island). The rest of the evidence of bear “presence” is indirect (feces, tracks, fur). There appeared to have been no attempt to discover if any of the indirect signs of polar bear presence could have come from the same bear visiting several adjacent locations.
Most importantly, there was absolutely no mention of the condition of the bears they saw on eider colonies or caught in the act of consuming eggs. However, the two photos they included in their supplemental data (Figs. 5 and 6 below) show bears that don’t look the least bit “nutritionally stressed.” [So where are all the starving polar bears?]
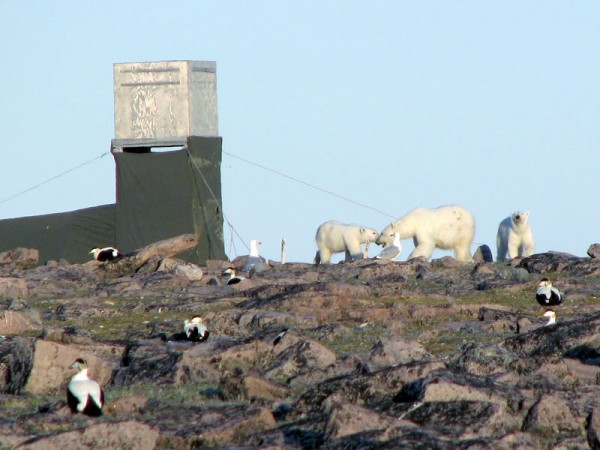
Figure 5. Fat female polar bear and her two fat cubs on the East Bay Island eider colony. A cropped version of this photo appears as part of Fig. S1 in Iverson et al. 2014 (this version is from the Science story). Steve Marson photo.
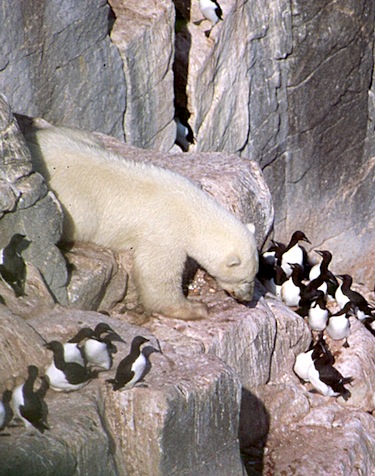
Figure 6. Healthy-looking polar bear at the Cape Pembroke thick-billed murre colony on Coates Island. This photo appears as part of Fig. S1 in Iverson et al. 2014 (this image appeared in a related NunatsiaqOnline story, 8 August 2013). Kenny Woo photo.
Where did Iverson and colleagues get the idea that Foxe Basin and Southern Davis Strait bears were nutritionally stressed (or as they put it: “experiencing difficulty meeting their energetic demands” and “turning to alternative prey to offset nutritional shortfalls“)?
Not from the Davis Strait polar bear paper by Peacock and colleagues (2013), who said this about the bears they surveyed in Hudson Strait:
“Survival and reproduction of bears in southern Davis Strait was greater than in the north and tied to a concurrent dramatic increase in breeding harp seals (Pagophilus groenlandicus) in Labrador.”
They couldn’t have gotten the idea from Rode et al. (2014), who reported that both male and female bears in Foxe Basin were heavier than all other subpopulations examined, including Chukchi Sea bears — who were found to be in excellent condition and reproducing well (see Fig. 7 below).
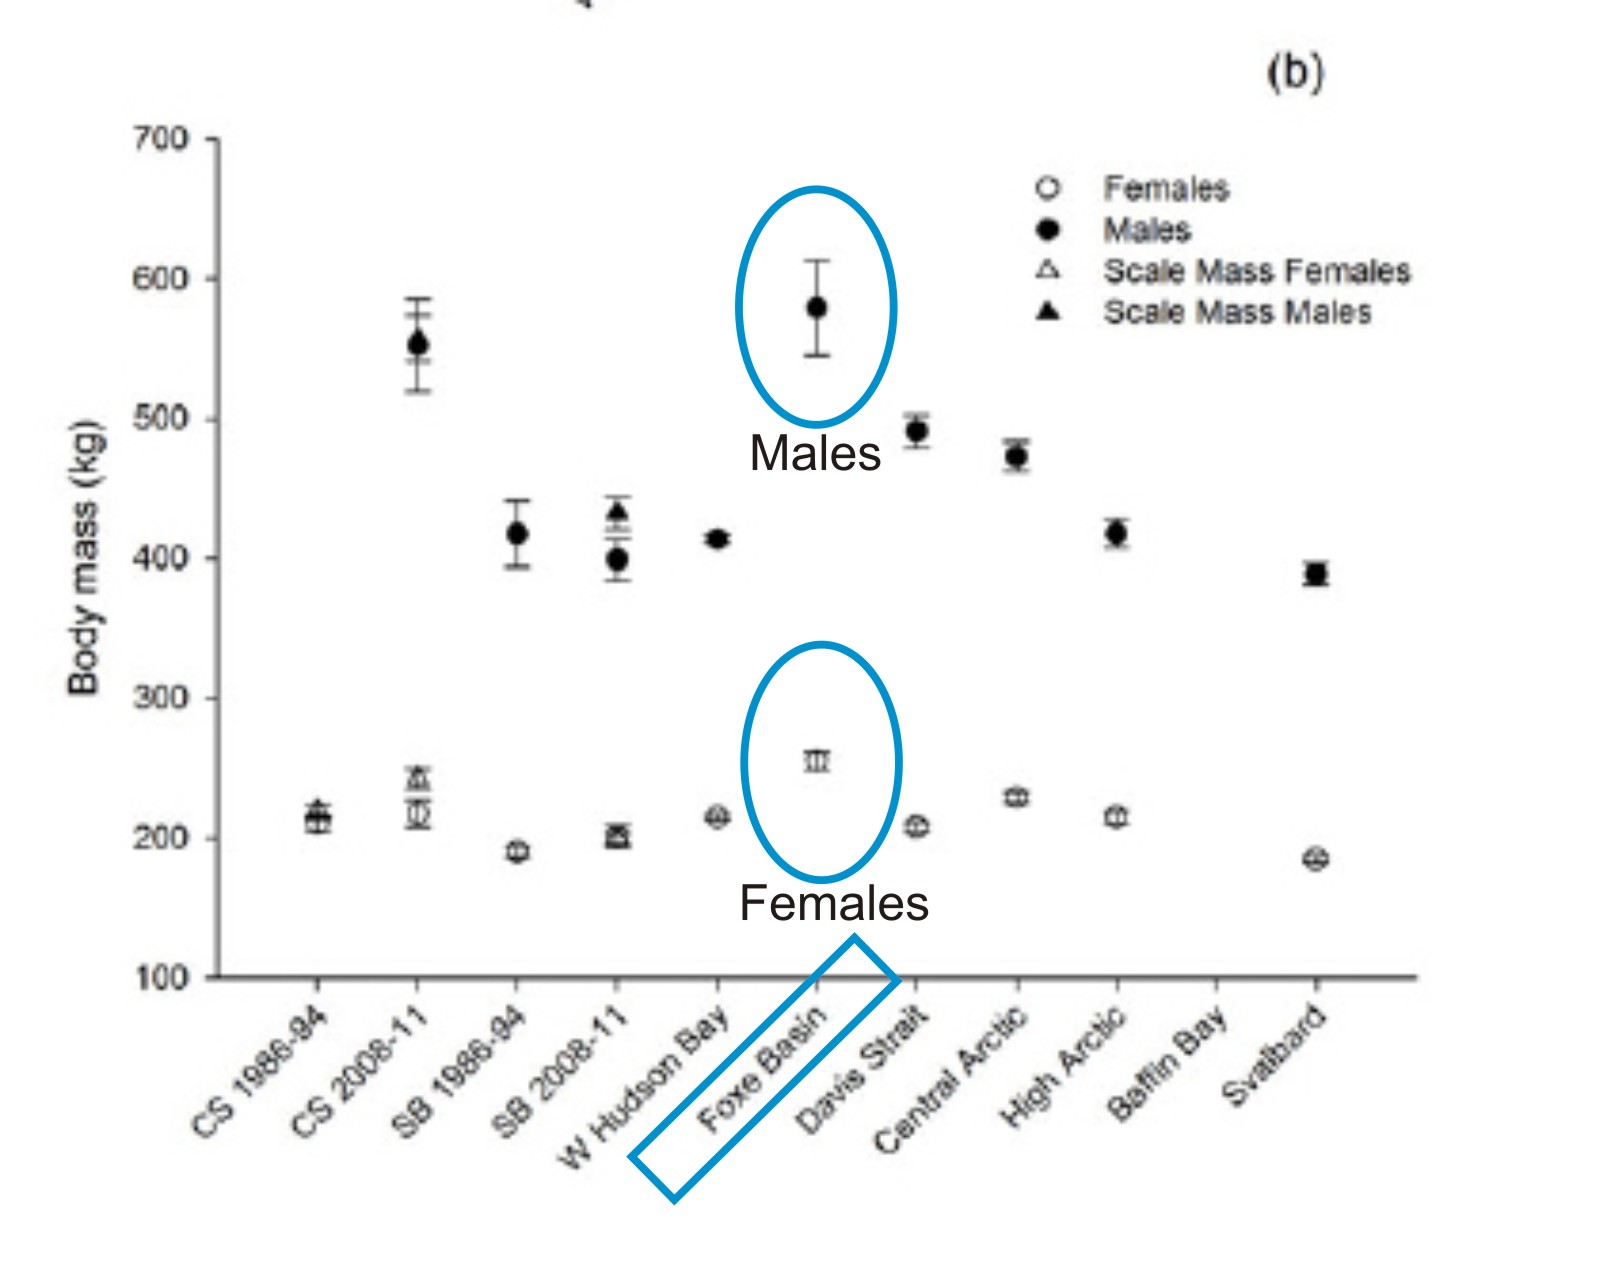
Figure 7. Weight of Foxe Basin male and female polar bears (circled by me) compared to other populations measured. CS, Chukchi Sea; SB, Southern Beaufort; Central Arctic = parts of Gulf of Boothia and M’Clintock Channel; High Arctic = Lancaster Sound. This is figure 5b from Rode et al. 2014.
The nutritional stress idea appears to have come from an assumption that a reduction in “good” or “best” annual ice cover over the last 30 years in Foxe Basin and Hudson Strait (Sahanatien and Derocher 2012) automatically means the bears around the bird colonies they studied must have been “experiencing difficulty meeting their energetic demands.”
That’s right – the authors used an assumed correlation rather than published observations available for bears in their study area. Iverson and colleagues did not cite either Rode et al. 2014 or Peacock et al. 2013.
Conclusions
There is no doubt that both common eider and thick-billed murre colonies in Foxe Basin and southern Davis Strait are occasionally depredated heavily by polar bears and that some colonies have suffered high losses. Beyond that, the authors are out on a limb with the most publicized of their conclusions.
Iverson et al. state:
“Our results are consistent with assertions that polar bears are experiencing difficulty meeting their energetic demands in locations where ice-free seasons have grown significantly longer.”
The fact is, their results show nothing of the kind.
References
Iverson, S.A., Gilchrist, H.G., Smith, P.A., Gaston, A.J. and Forbes, M.R. 2014. Longer ice-free seasons increase the risk of nest depredation by polar bears for colonial breeding birds in the Canadian Arctic. Proceedings of the Royal Society B 281(1779):20133128 doi:10.1098/rspb.2013.3128 (published 5 February 2014) open access (free for all). http://rspb.royalsocietypublishing.org/content/281/1779/20133128.abstract
Peacock, E., Taylor, M.K., Laake, J., and Stirling, I. 2013. Population ecology of polar bears in Davis Strait, Canada and Greenland. Journal of Wildlife Management 77:463–476. http://onlinelibrary.wiley.com/doi/10.1002/jwmg.489/abstract
Rode, K.D., Regehr, E.V., Douglas, D., Durner, G., Derocher, A.E., Thiemann, G.W., and Budge, S. 2014. Variation in the response of an Arctic top predator experiencing habitat loss: feeding and reproductive ecology of two polar bear populations. Global Change Biology. 20(1):76-88) http://onlinelibrary.wiley.com/doi/10.1111/gcb.12339/abstract
Sahanatien, V. and Derocher, A.E. 2012. Monitoring sea ice habitat fragmentation for polar bear conservation. Animal Conservation 15(4):397-406. http://onlinelibrary.wiley.com/doi/10.1111/j.1469-1795.2012.00529.x/abstract


You must be logged in to post a comment.