Tag Archives: sea ice maps

Ice maps vs. observations in the W. Arctic – polar bear habitat reality check

Last Wednesday (8 June 2016), the US Coast Guard rescued walrus hunters from Shishmaref in the Bering Strait who got stuck in sea ice that is barely visible on sea ice maps. It’s a rare glimpse of what sea ice really looks like up close compared to what you see on the ice maps.

Watch the video here: https://www.dvidshub.net/video/embed/467959

[Unfortunately, the screencaps from the video, like the one below, are less impressive than the film. In the video, you can see the hunters walking on the ice around their trapped boat – the ice does not visibly move]

Shishmaref_ice_CoastGuard 02_8 June 2016

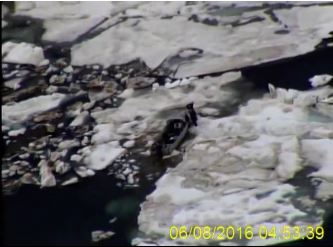
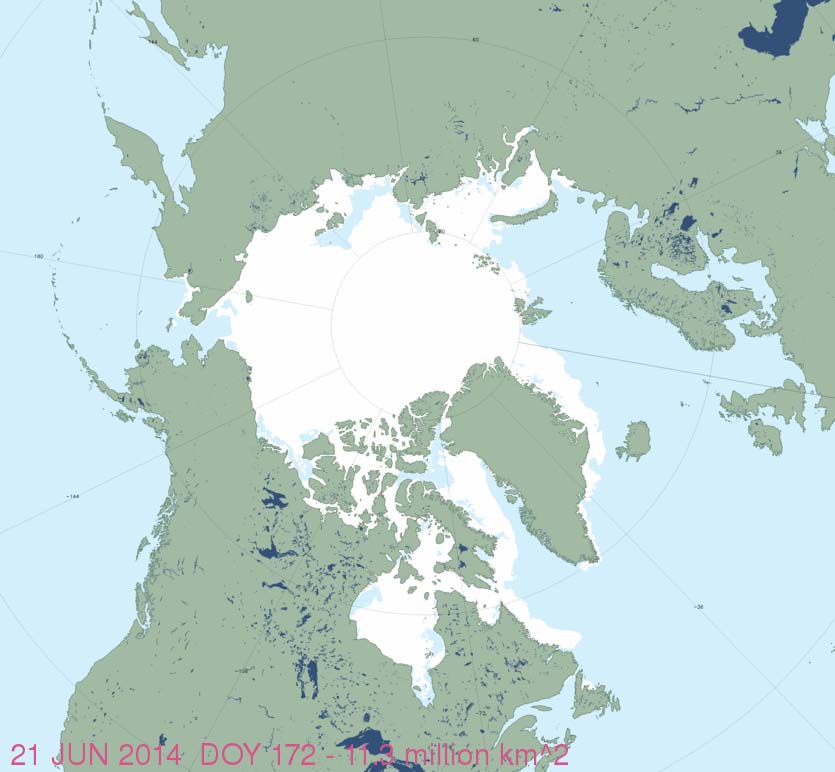
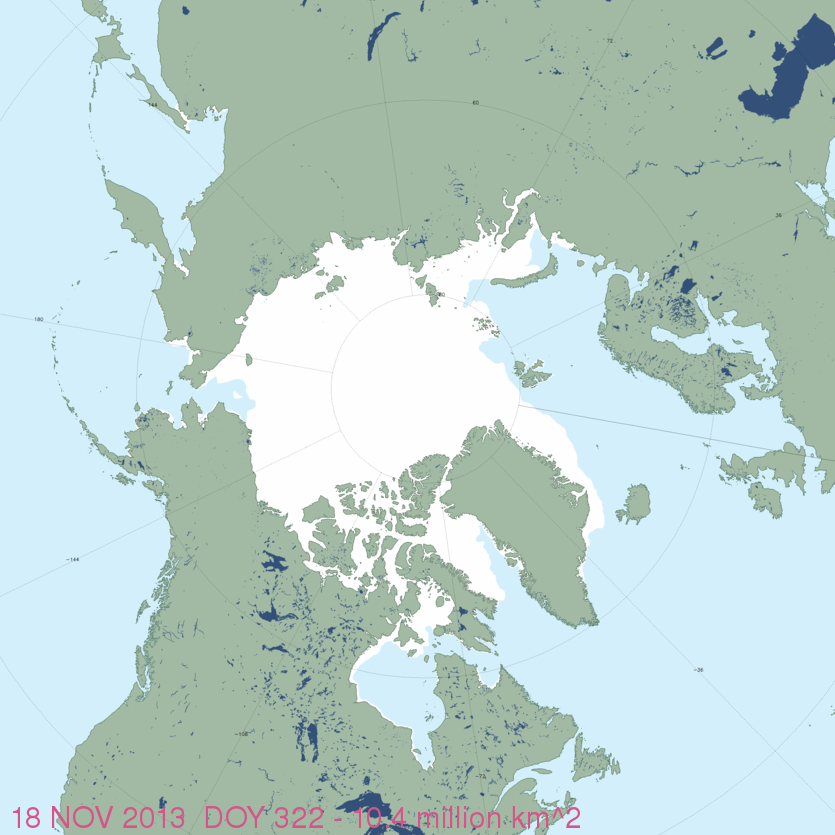
Have a look at the sea ice maps below for the day the incident took place. They show what appears to be hardly any ice in the area.

This is a good lesson for assessing what’s been going on in the Beaufort Sea a bit further east, where winds and currents have opened up a rather large patch of open water surrounded by considerable expanses of sea ice – at issue is the possible impact on polar bear spring feeding for April and May.
Continue reading

Mass gatherings of walrus follow-up – sea ice maps for 1978 and 1972

Walruses as polar bear prey and sea ice were on my mind last night and I remembered that we DO have detailed sea ice information for 1978 and 1972 – from the sea ice atlas put together by University of Alaska Fairbanks (UAF), which has ice concentration maps for Alaska going back to 1850 — and for every year up to 2013 (reported previously here).

Chukchi Sea walrus, June 2014. US Fish and Wildlife Service.

Chukchi Sea walrus, June 2014. US Fish and Wildlife Service.

I’ve copied some of the ice maps below.

It is clear that ice was available close to Wrangel Island in 1972 when walruses chose to haul out on the island in huge numbers. And in 1978, there was ice present to the north of the walrus herd, but they had moved away from the ice to get to St. Lawrence Island, where they hauled out in large numbers.

This means it is more likely that food resources were the issue, not sea ice.
UPDATE OCTOBER 3 2014:

See another interesting follow-up elsewhere: Walrus inconsistencies
Continue reading

Spring/summer sea ice bonanza for polar bears – conditions excellent again for 2014

Again this year – contrary to predictions – there has been no early breakup of the sea ice on Hudson Bay and even though it’s the height of summer, there is plenty of ice throughout the Arctic to act as a feeding platform for polar bears. This makes it unlikely there will be a longer-than-average summer fast for polar bears again this year.

Figure 1. NSIDC MASIE map for June 21, 2014.

Figure 1. NSIDC MASIE map for June 21, 2014.

Sea ice maps around the Arctic for June 21 (and June 24, for Hudson Bay) reviewed and discussed below in relation to polar bear habitat — have a look.

Continue reading

Chukchi-Beaufort sea ice atlas: check out polar bear habitat 1850-2013

It’s here – as promised and right on schedule — the sea ice atlas put together by University of Alaska Fairbanks (UAF) now has ice concentration maps for Alaska going back to 1850 — and for every year up to 2013. 

Several examples are included below: August 1850 vs August 1870, and April 1850 vs. April 1920 and April 2012.

For background, see my post announcing the site preview, which was then limited to 1953-2012 data, when it became available in late January.

Sea ice atlas_1850_Aug
Continue reading

Polar bear habitat virtually everywhere now

What did I tell you, back in mid-September?

Have a look at all the polar bear habit, ten days shy of the end of November!

Figure 1. MASIE sea ice extent for November 18, 2013 (using US National Ice Center data). You have to look closely but there is indeed ice forming around Svalbard (just above the tip of Greenland) and in James Bay (southern Hudson Bay). Click to enlarge. High resolution map here.

Figure 1. MASIE sea ice extent for November 18, 2013 (using US National Ice Center data). You have to look closely but there is indeed ice forming around Svalbard (just above the tip of Greenland) and in James Bay (southern Hudson Bay). Click to enlarge. High resolution map here.

Figure 2. Canadian Ice Service map. Good amounts of ice developing in northern Hudson Bay, Foxe Basin and Davis Strait (between southern Greenland and Baffin Island), with ice forming along the shore in James Bay (the southern-most region where polar bears are on-shore at the moment). Click to enlarge.

Figure 2. Canadian Ice Service map. Ice developing rapidly in northern Hudson Bay, Foxe Basin and Davis Strait (between southern Greenland and Baffin Island), with ice also forming along the shore in James Bay (the southern-most region where polar bears are onshore at the moment). Click to enlarge.

September sea ice ballyhoo and why it doesn’t matter to polar bears

The end of September sea ice summary from the US National Snow and Ice Data Center (NSIDC) finally became available late last week (October 3, “A better year for the cryosphere”).

The summary figure NSIDC provides are the average ice extent for the month (not the maximum achieved at the end of the month), which are compared to previous years.

[There has been considerable ice growth since the end of September (updated daily here].

Here is why the September extent doesn’t matter to polar bears: it is the extent in June that is important to polar bear survival. June is the end of the critical spring feeding period for polar bears (see previous post here) – healthy bears eat more seals over a shorter period of time from March to June than any other time of year. After the end of June, most bears have enough fat to survive a fast of 4 months or more.

In contrast to September – when many bears are taking a time-out on shore – ice extent for June over the last 30 years or so provided an extensive hunting platform for polar bears throughout the Arctic. To show you how extensive, I’ve constructed a composite of ice maps from selected years (Fig.1, below).

Continue reading