
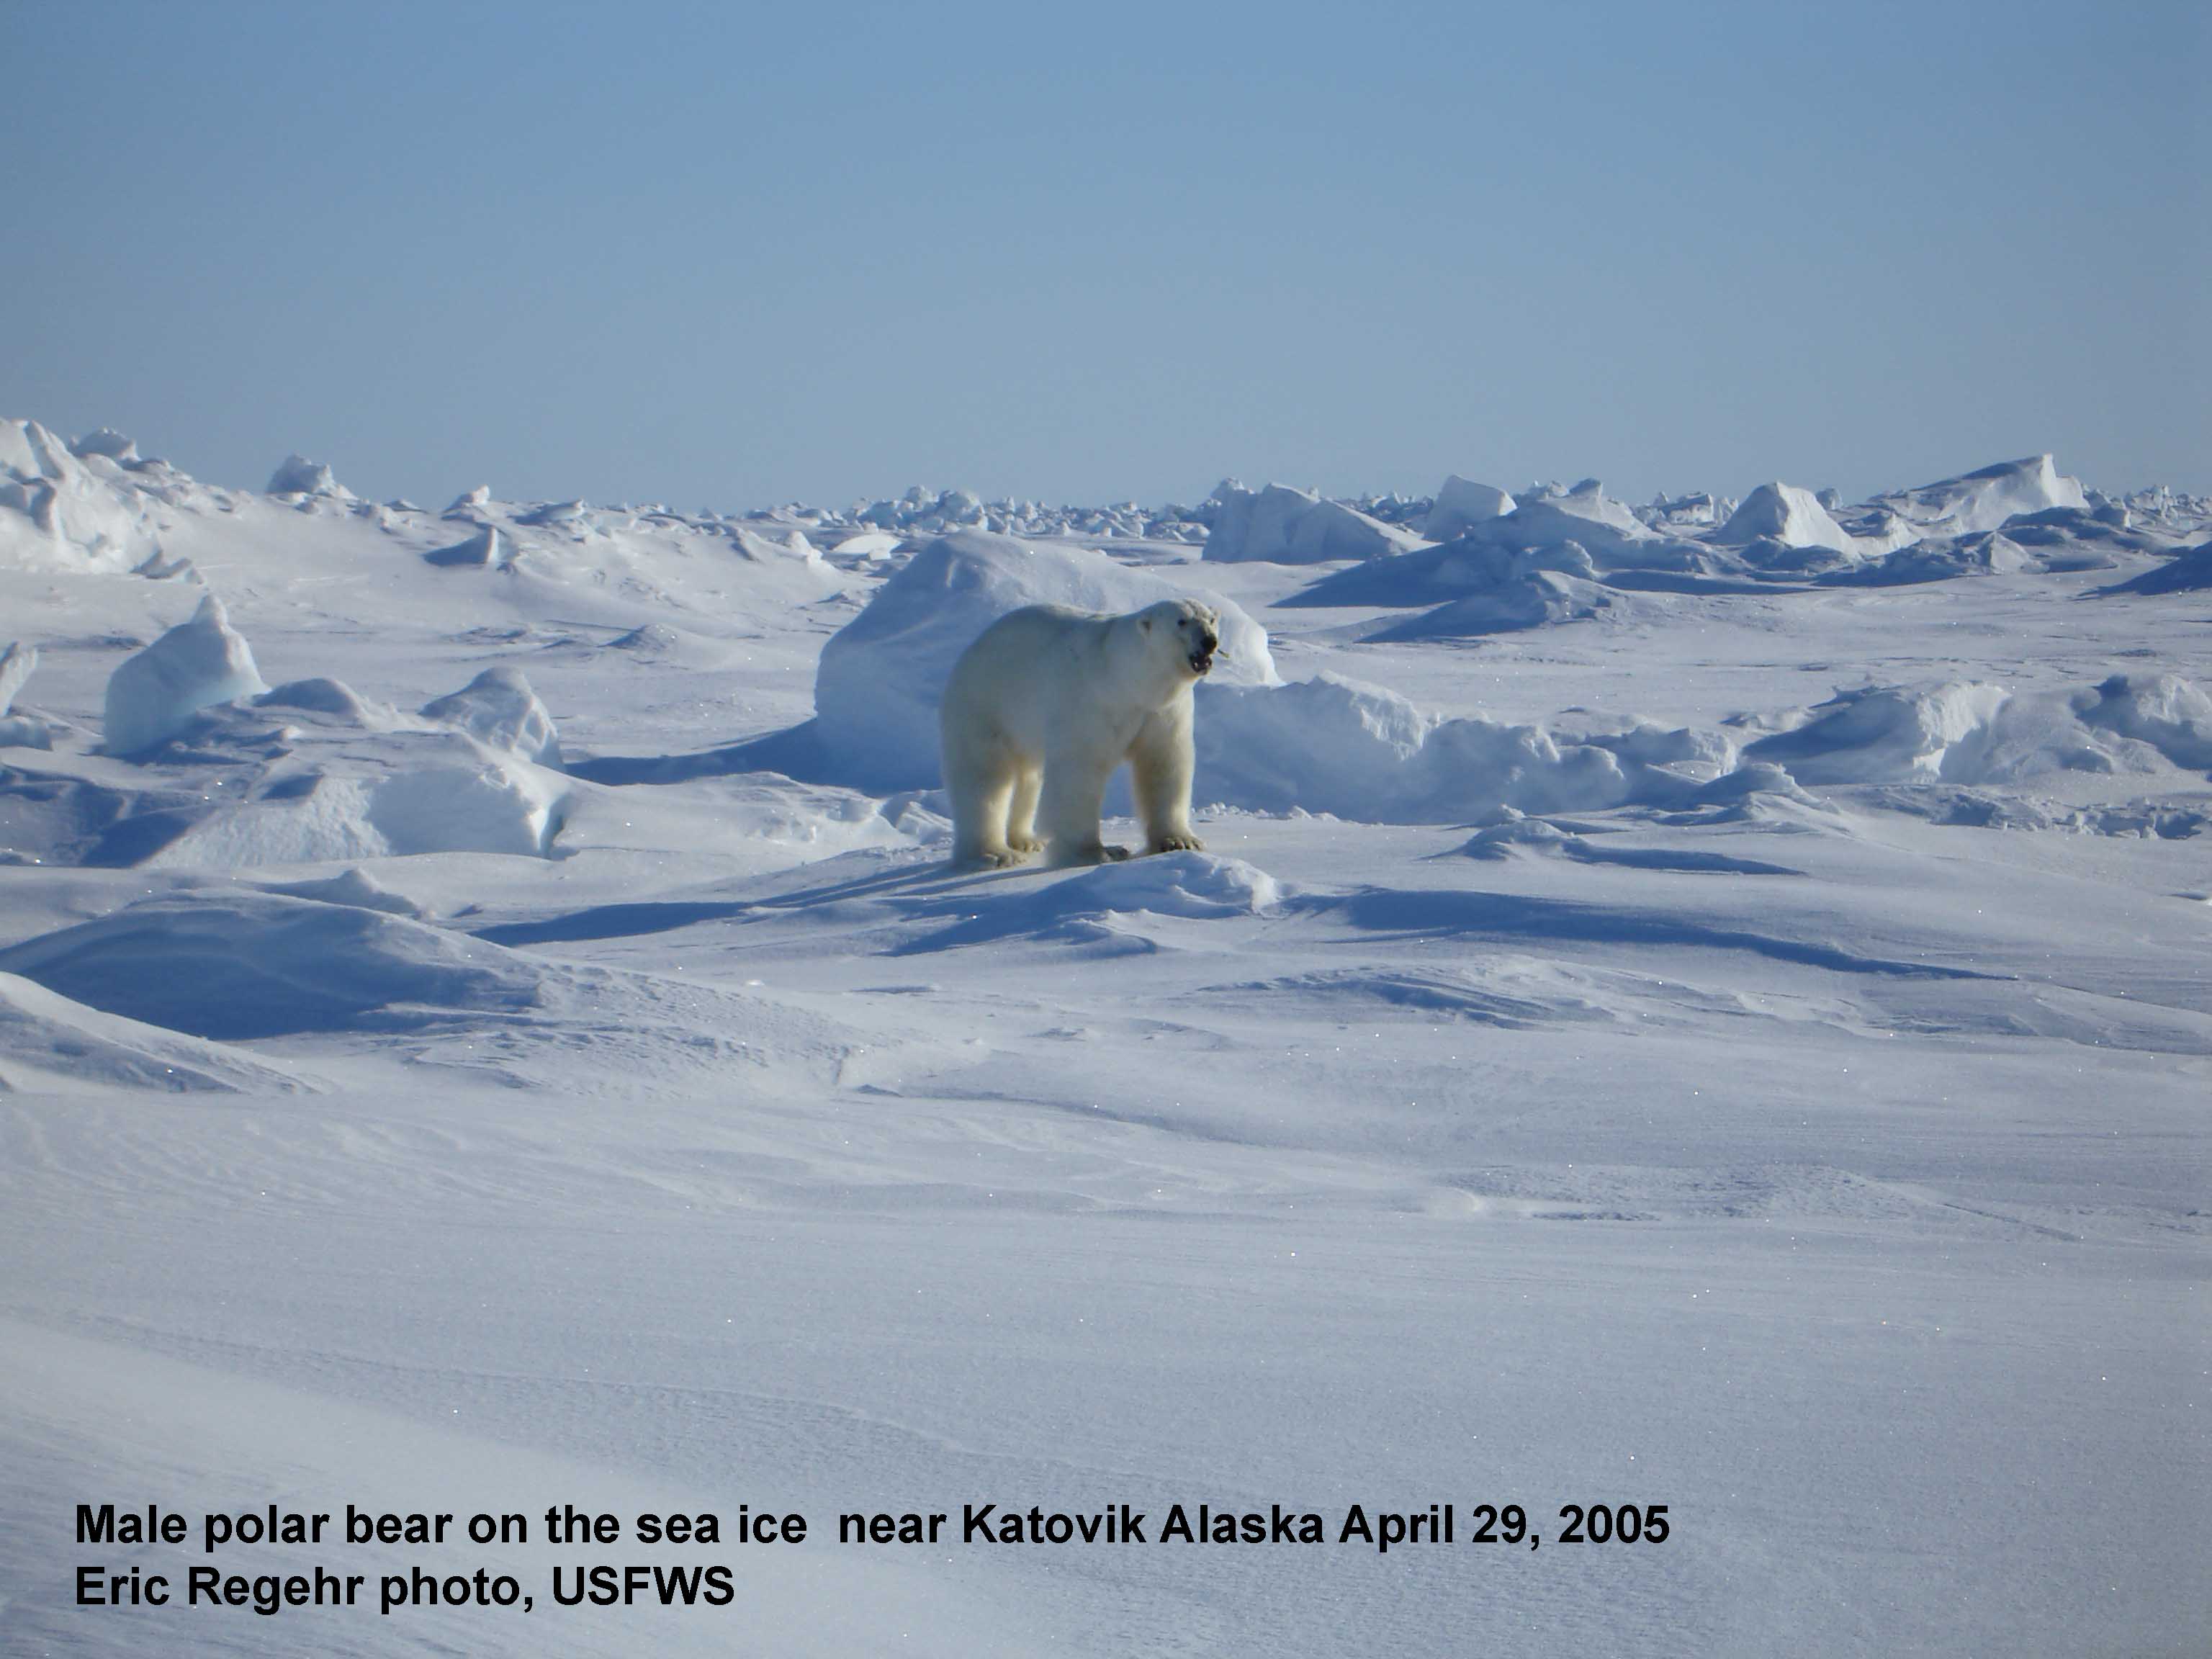
Polar bears are all out on the sea ice at this time of year, feeding on new-born seal pups. Here’s a look at what the ice conditions are like at this critical time.
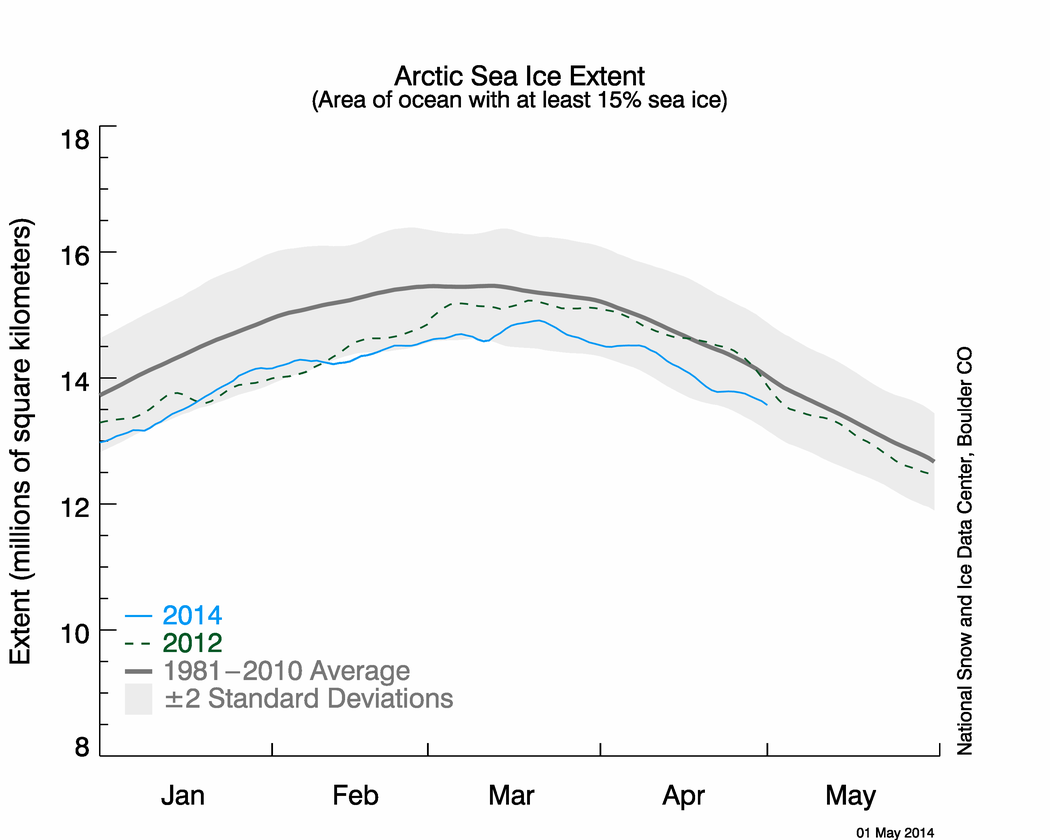
The ice extent is still well within two standard deviations from the 1981-2010 average, which indicates no deviation from natural variation, as the graph (below) for May 1, 2014 from the US National Snow and Ice Data Center (NSIDC) shows.
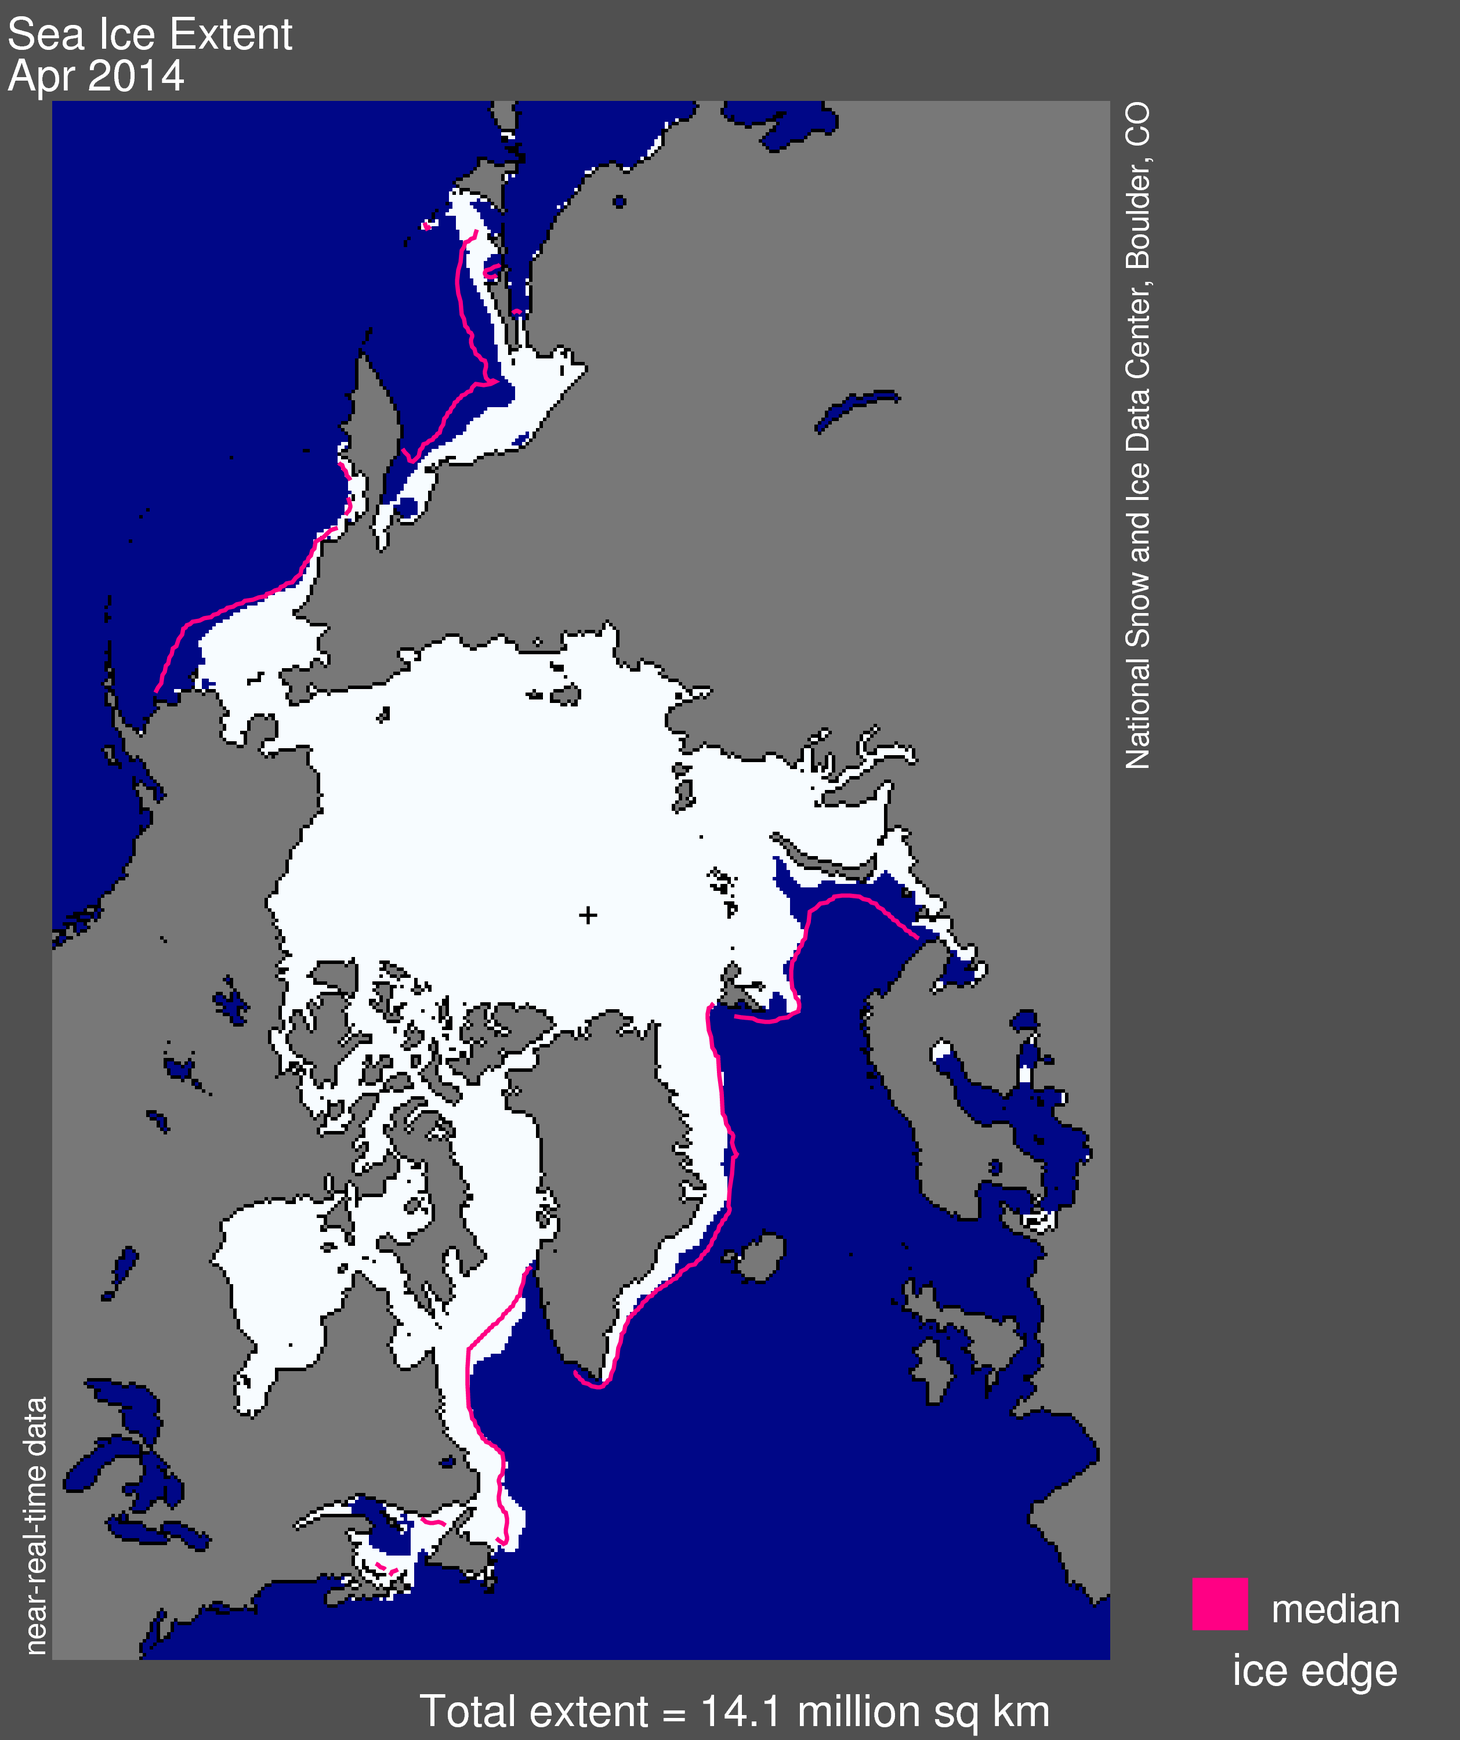
Between the official spring maximum (according to the NSIDC ) on March 21, with a total extent of 14.8 million km2, the ice slowly retreated in some regions and increased in others, while most regions remained pretty much the same. This is an important reminder that the Arctic as a whole is not a homogeneous region but one with marked regional variation.
As has been noted elsewhere (Sunshine Hours), ice in the Greenland Sea (habitat of ‘East Greenland’ bears) and the Barents Sea both increased in extent over this period. Bering Sea ice (habitat of southern ‘Chukchi Sea’ bears) declined markedly but Baffin Bay/Gulf of St. Lawrence ice (habitat of ‘Davis Strait’ bears) declined much less, as NOAA’s MASIE maps copied below show very well.
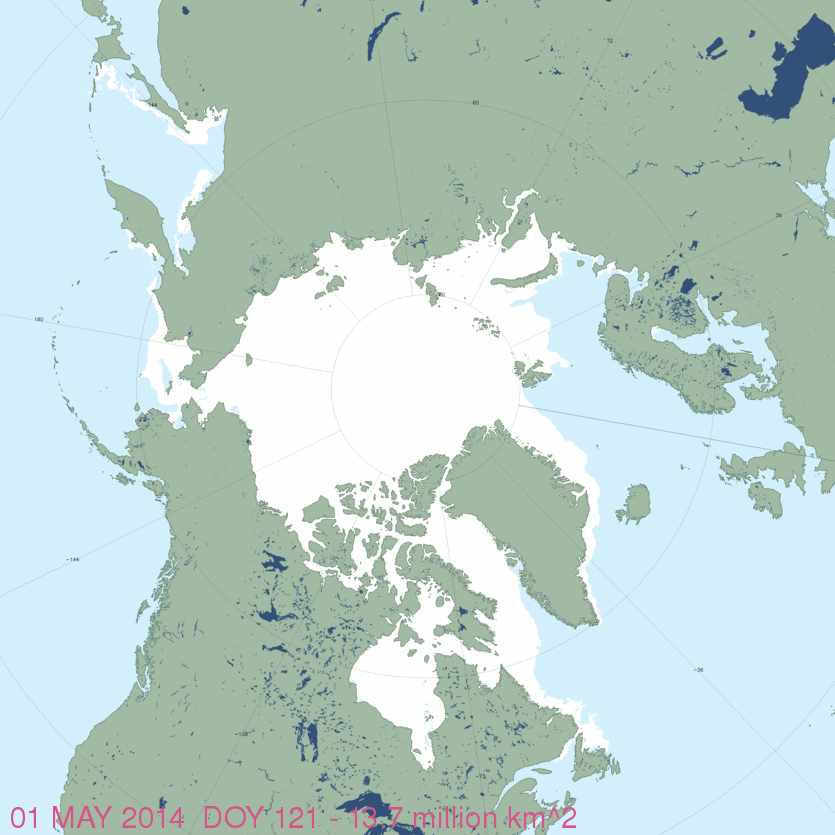
MASIE map of the entire Arctic, to get you oriented for the regional maps that follow:
The regions with polar bears that increased in ice extent over April, 2014
[See the polar bear distribution map at the end of this post]
Greenland Sea 30 March 2014 (608.6 k km2) below (in this image, the island is Iceland; Greenland is on the left):

Greenland Sea 1 May 2014 (656.4 k km2) below:

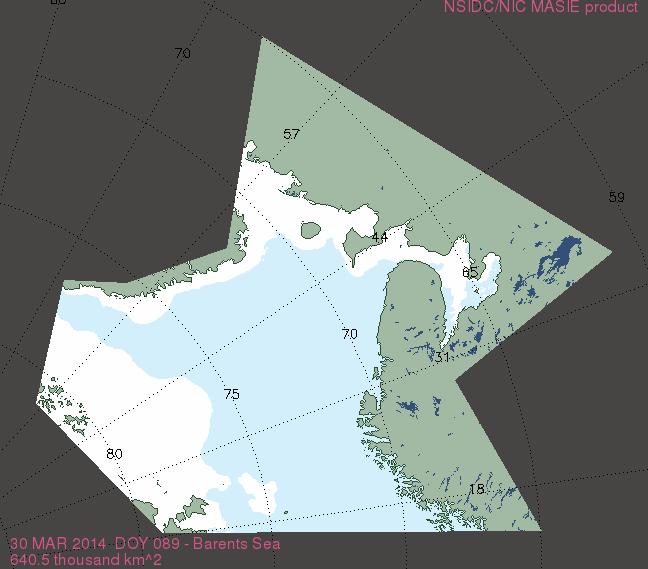
Barents Sea 30 March 2014 (640.5 k km2) below (in this image, the coast of northern Norway is on the far right, edge of Svalbard on the lower left):
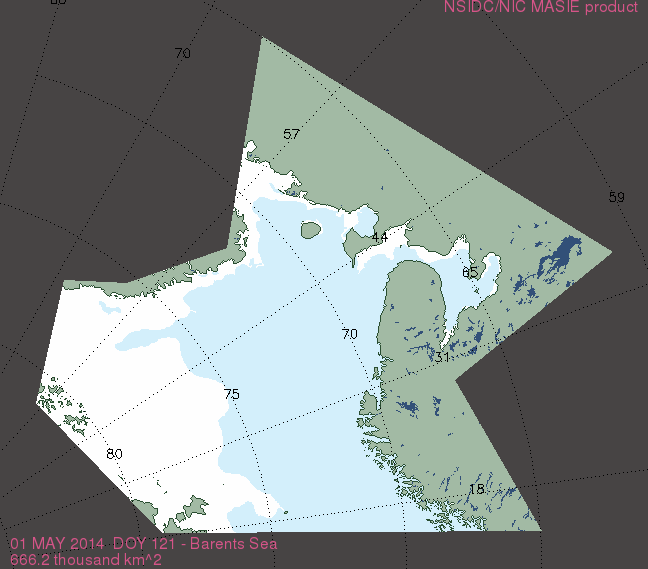
Barents Sea 30 1 May 2014 (666.2 k km2) below:
The regions with polar bears that decreased in ice extent over April, 2014
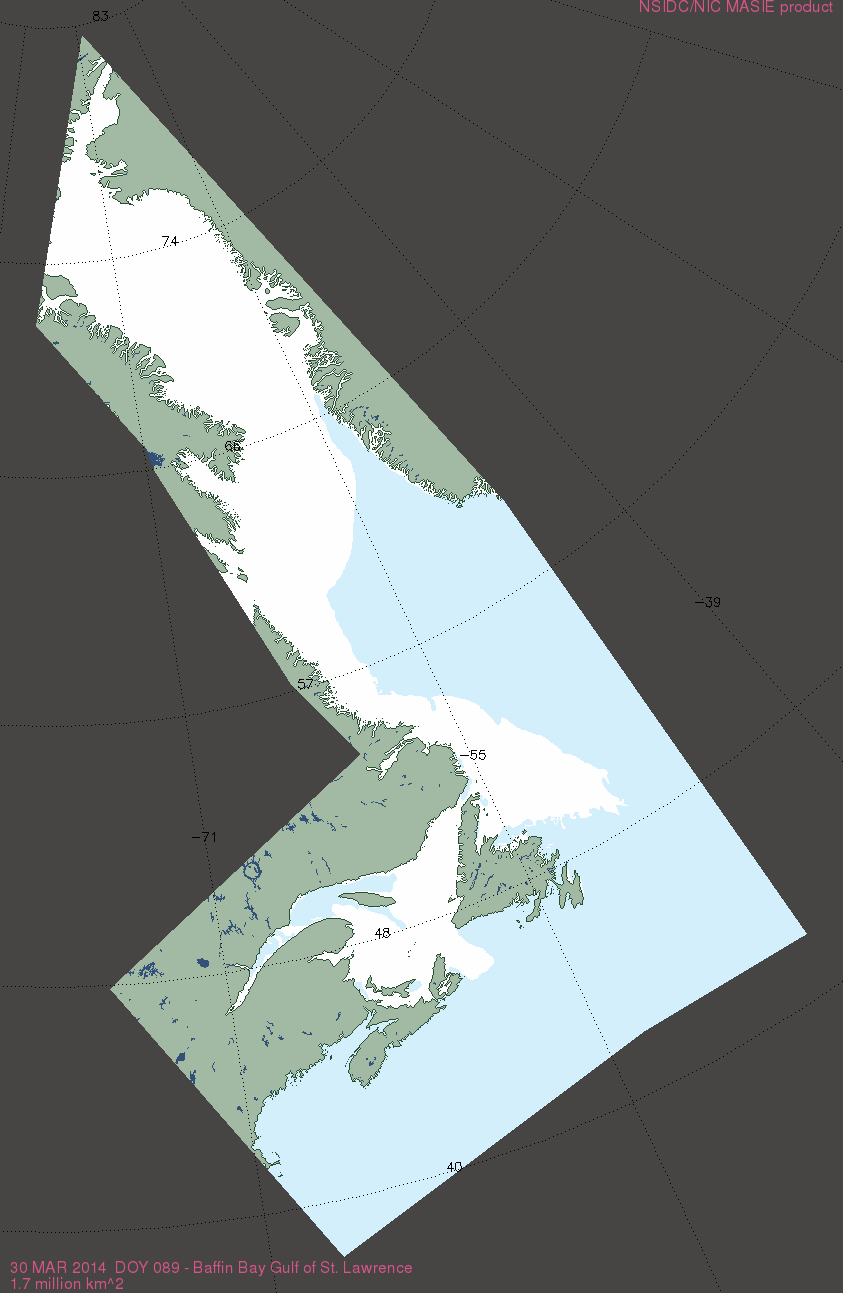
Baffin Bay/Gulf of St. Lawrence 30 March 2014 (1.7 mkm2) below (in this image, the island is Newfoundland):
Baffin Bay/Gulf of St. Lawrence 1 May 2014 (1.4 m km2)

Bering Sea 30 March 2014 (672.0 k km2) below (in this image, Bering Strait is on the far right and Alaska is at the bottom):

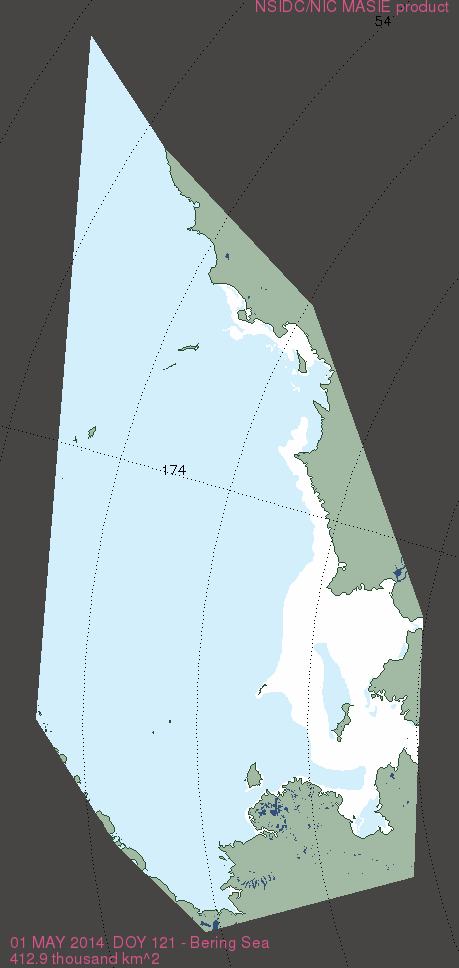
Bering Sea 1 May 2014 (412.9 k km2) below:
Below: a view of heavily ridged sea ice broken up with leads (cracks), Arctic Basin, courtesy Wikipedia.


The 19 polar bear subpopulations currently defined by the IUCN Polar Bear Specialist Group (PBSG), with a few extra labels added. I’ve rotated the original map 90 degrees (right) to make it easier to relate to sea ice maps. SB, Southern Beaufort; NB, Northern Beaufort; VM, Viscount Melville; MC, M’Clintock Channel; LS, Lancaster Sound; GB, Gulf of Boothia; NW, Norwegian Bay; KB, Kane Basin; WH, Western Hudson Bay. Courtesy the PBSG. Click to enlarge.


You must be logged in to post a comment.