
It was a good year for polar bear habitat in the southern portions of Eastern Canada this spring – surprisingly, much better than it was in 1968 through 1970. And since spring conditions are what really matter to polar bears, this is good news indeed.
Environment Canada’s Canadian Ice Service recently published a nice little summary that has some rather eye-opening graphs. These describe the conditions for polar bears in the southern Davis Strait subpopulation – the one whose population size increased so dramatically between 1974 and 2007 despite lower-than-average ice extent in some years, even while their body condition declined (see here and here).
[Fitting post for the second anniversary of this blog, I think – more below1]
Note that I’ve added a “Blog Archive” page that lists all of my posts, easier to browse now that there are more than 200 of them.
Here’s what the Canadian Ice Service says about this winter-spring season (ending 18 June), with a few of the graphs and ice charts they provided below:
“Air temperatures on the East Coast over the 2013-2014 winter season were overall colder than normal, with December and March being much colder than the 1980-81 to 2009-2010 climate normal. This contributed to an above normal amount of ice for each of the Gulf, Newfoundland and Southern Labrador Coast regions. There was more than twice as much ice during the 2013-2014 season than the median of the previous 10 years.
The severity of the 2013-2014 ice season was felt particularly around Newfoundland as the pack ice reached most of the west coast of Newfoundland in the first week of February and started clearing only in mid-April. On the east side of the island, the ice coverage reached its maximum extent around mid-March, when the pack ice followed the Labrador Current and drifted all the way down to about 45N, before starting to retreat later in the month. Some ice lingered in Notre Dame Bay and White Bay until the last week of June before melting. These areas usually clear before the end of May. The last season that had more ice in East Newfoundland Waters was 1993-1994.
In the Gulf of St Lawrence, the maximum ice coverage was also reached around mid-March. Clearing occurred in the estuary in early April, which is near normal. The pack ice disappeared from the southern portions of the Gulf at the end of April, about two weeks later than normal. Some ice lingered in the northeast sections of the Gulf until the third week of June before melting, more than three weeks later than normal. The last season that had more ice in the Gulf was 2002-2003.” [my bold]
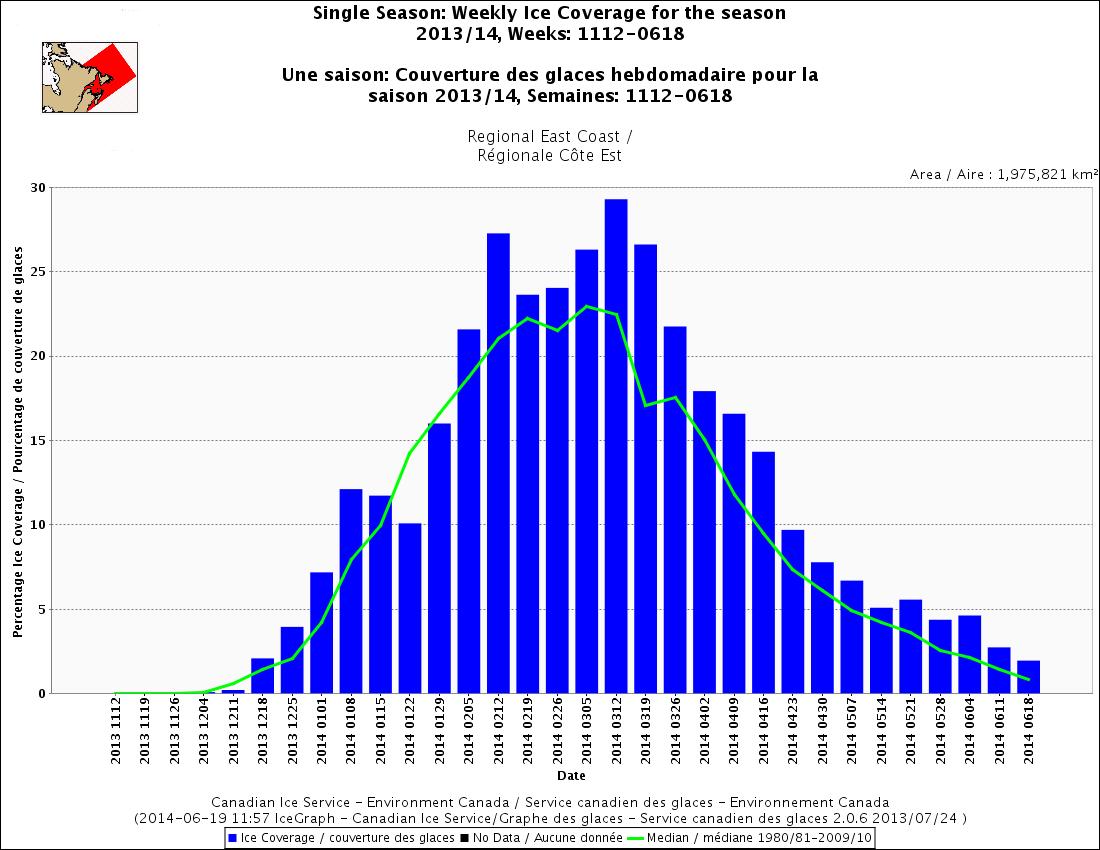
Weekly Ice Coverage for the Canadian East Coast season, 2014 (to 18 June). CIS.
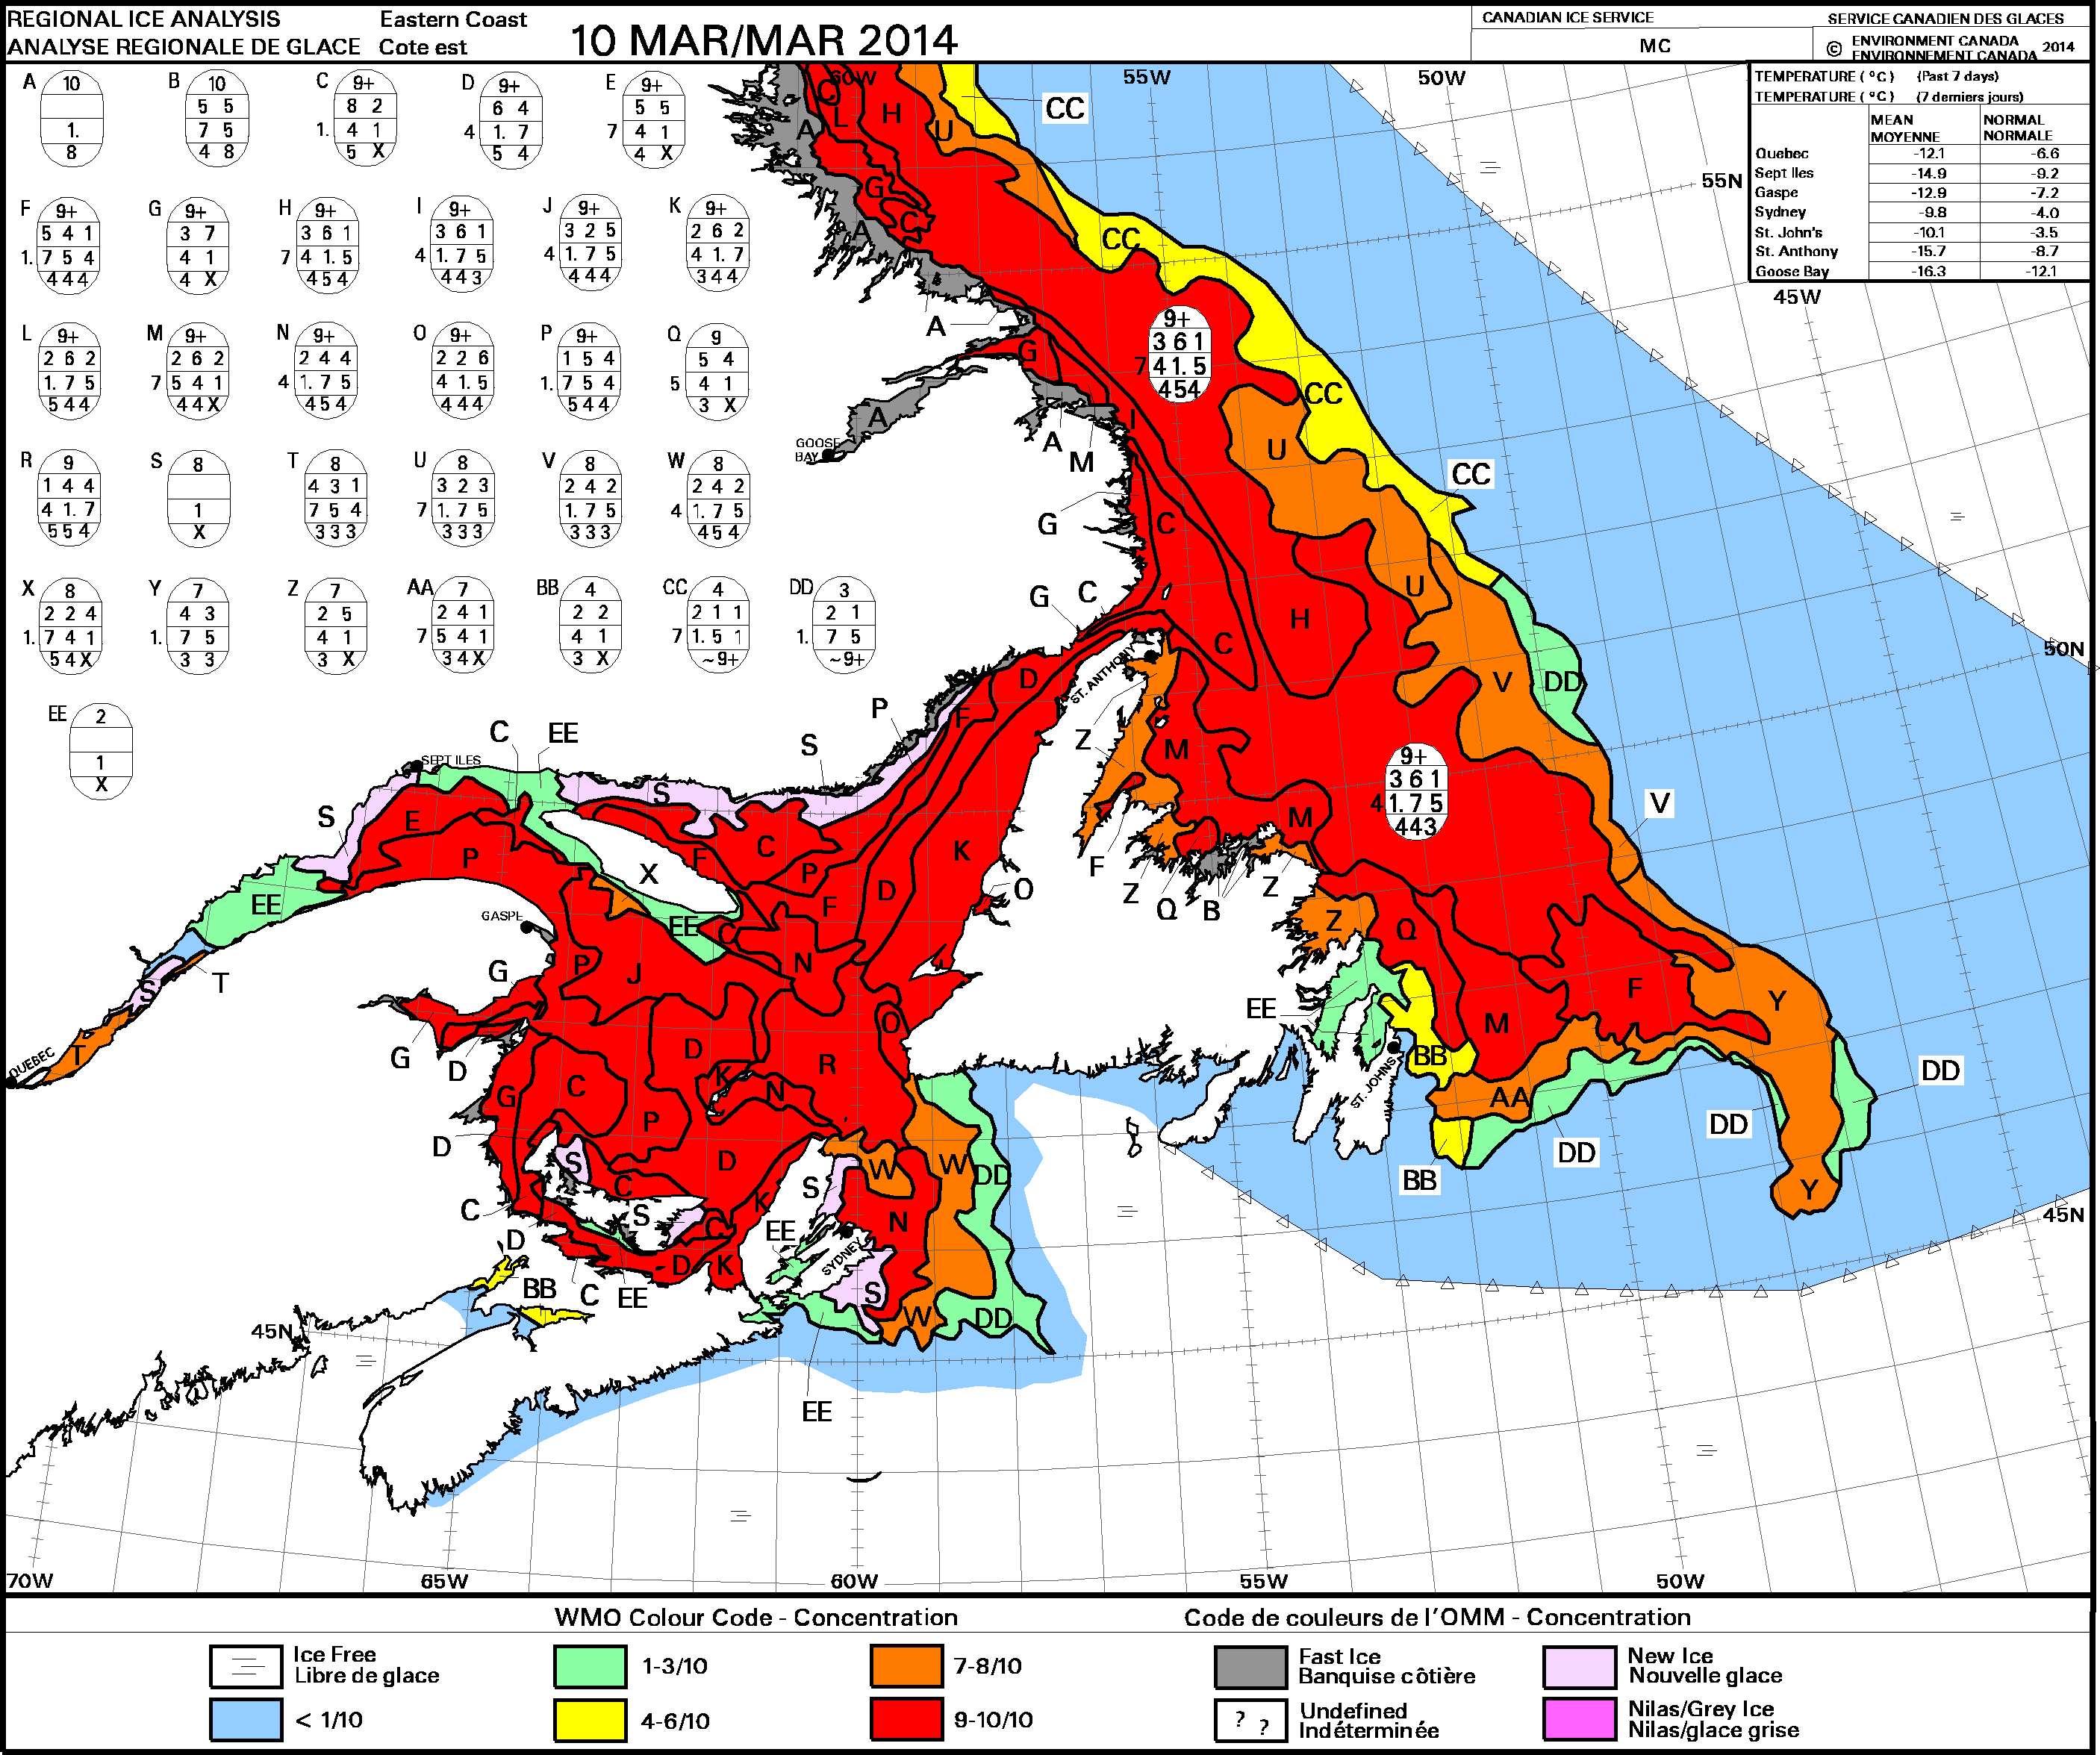
Maximum ice coverage for the Canadian East Coast, 2014 (10 March). CIS.
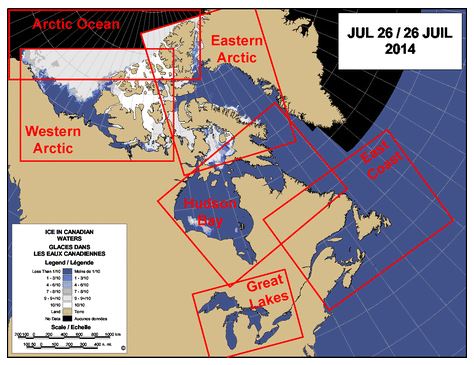
See the full report here and a similar one, without graphs and charts, for all regions of the Canadian Arctic for the spring of 2014 including Hudson Bay, here.
But have a look at the graphs below, that show how little ice there was in this region in the late 1960s (the winters of 1968/69 and 1969/70) — the maximum total for the winter of 1968/69 was almost as low as 2010 (the lowest overall) and the highest extent was not in the 1970s but in 1990!
[Keep in mind that this region is the most southern region supporting polar bear populations in the world, to at least 470N in the south (see Fig.1 here), so what happens in southern Davis Strait should reflect some of the most extreme fluctuations in polar bear habitat globally]
Makes me wonder – if we had data going back a few more decades, recent lows wouldn’t look so unusual. It might look more like a cyclic pattern of high-low ice over decadal time scales than a slow steady decline since 1979 (when comprehensive satellite-gathered sea ice data began).
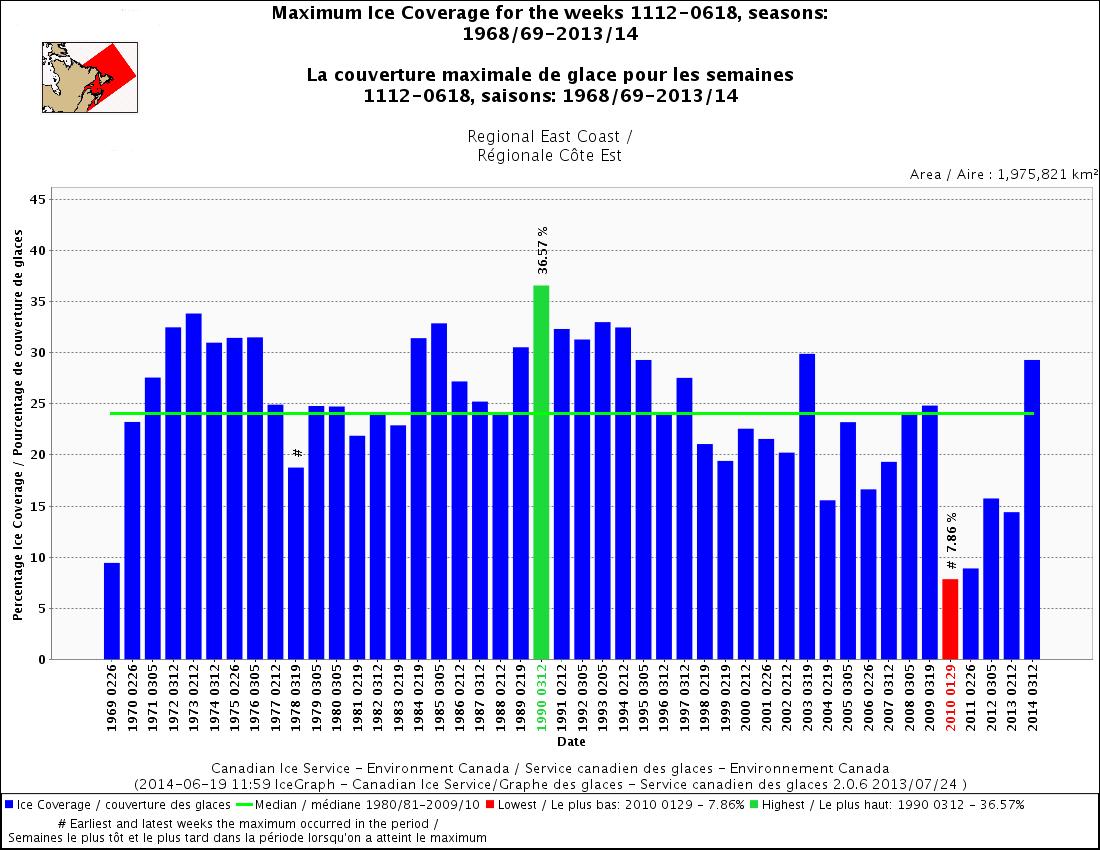
Maximum ice coverage for the East Coast 1969-2014 (to 18 June), CIS.
————————————————————————–
————————————————————————–
Footnote about this blog’s 2nd anniversary:
Accumulated views over two years — 227,210 (July 26, 2012 to July 25, 2014 at midnight).
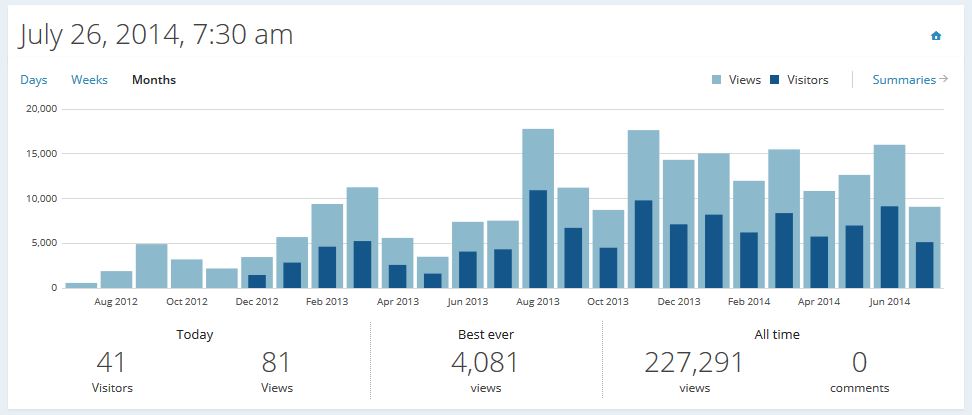
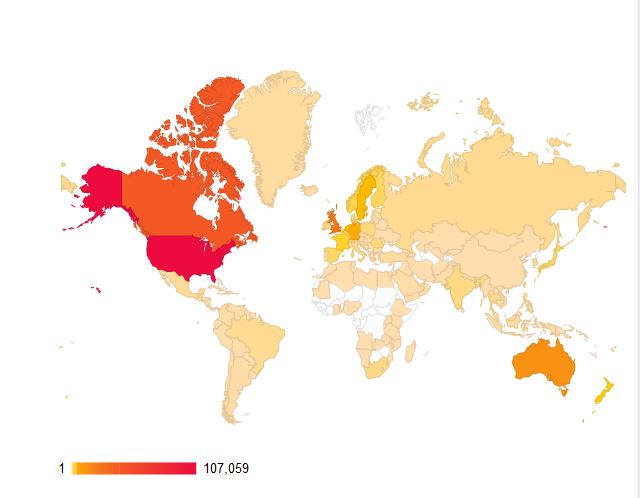
Views by country for this period (July 26, 2012-July 26, 2014 a.m.) below:


You must be logged in to post a comment.