
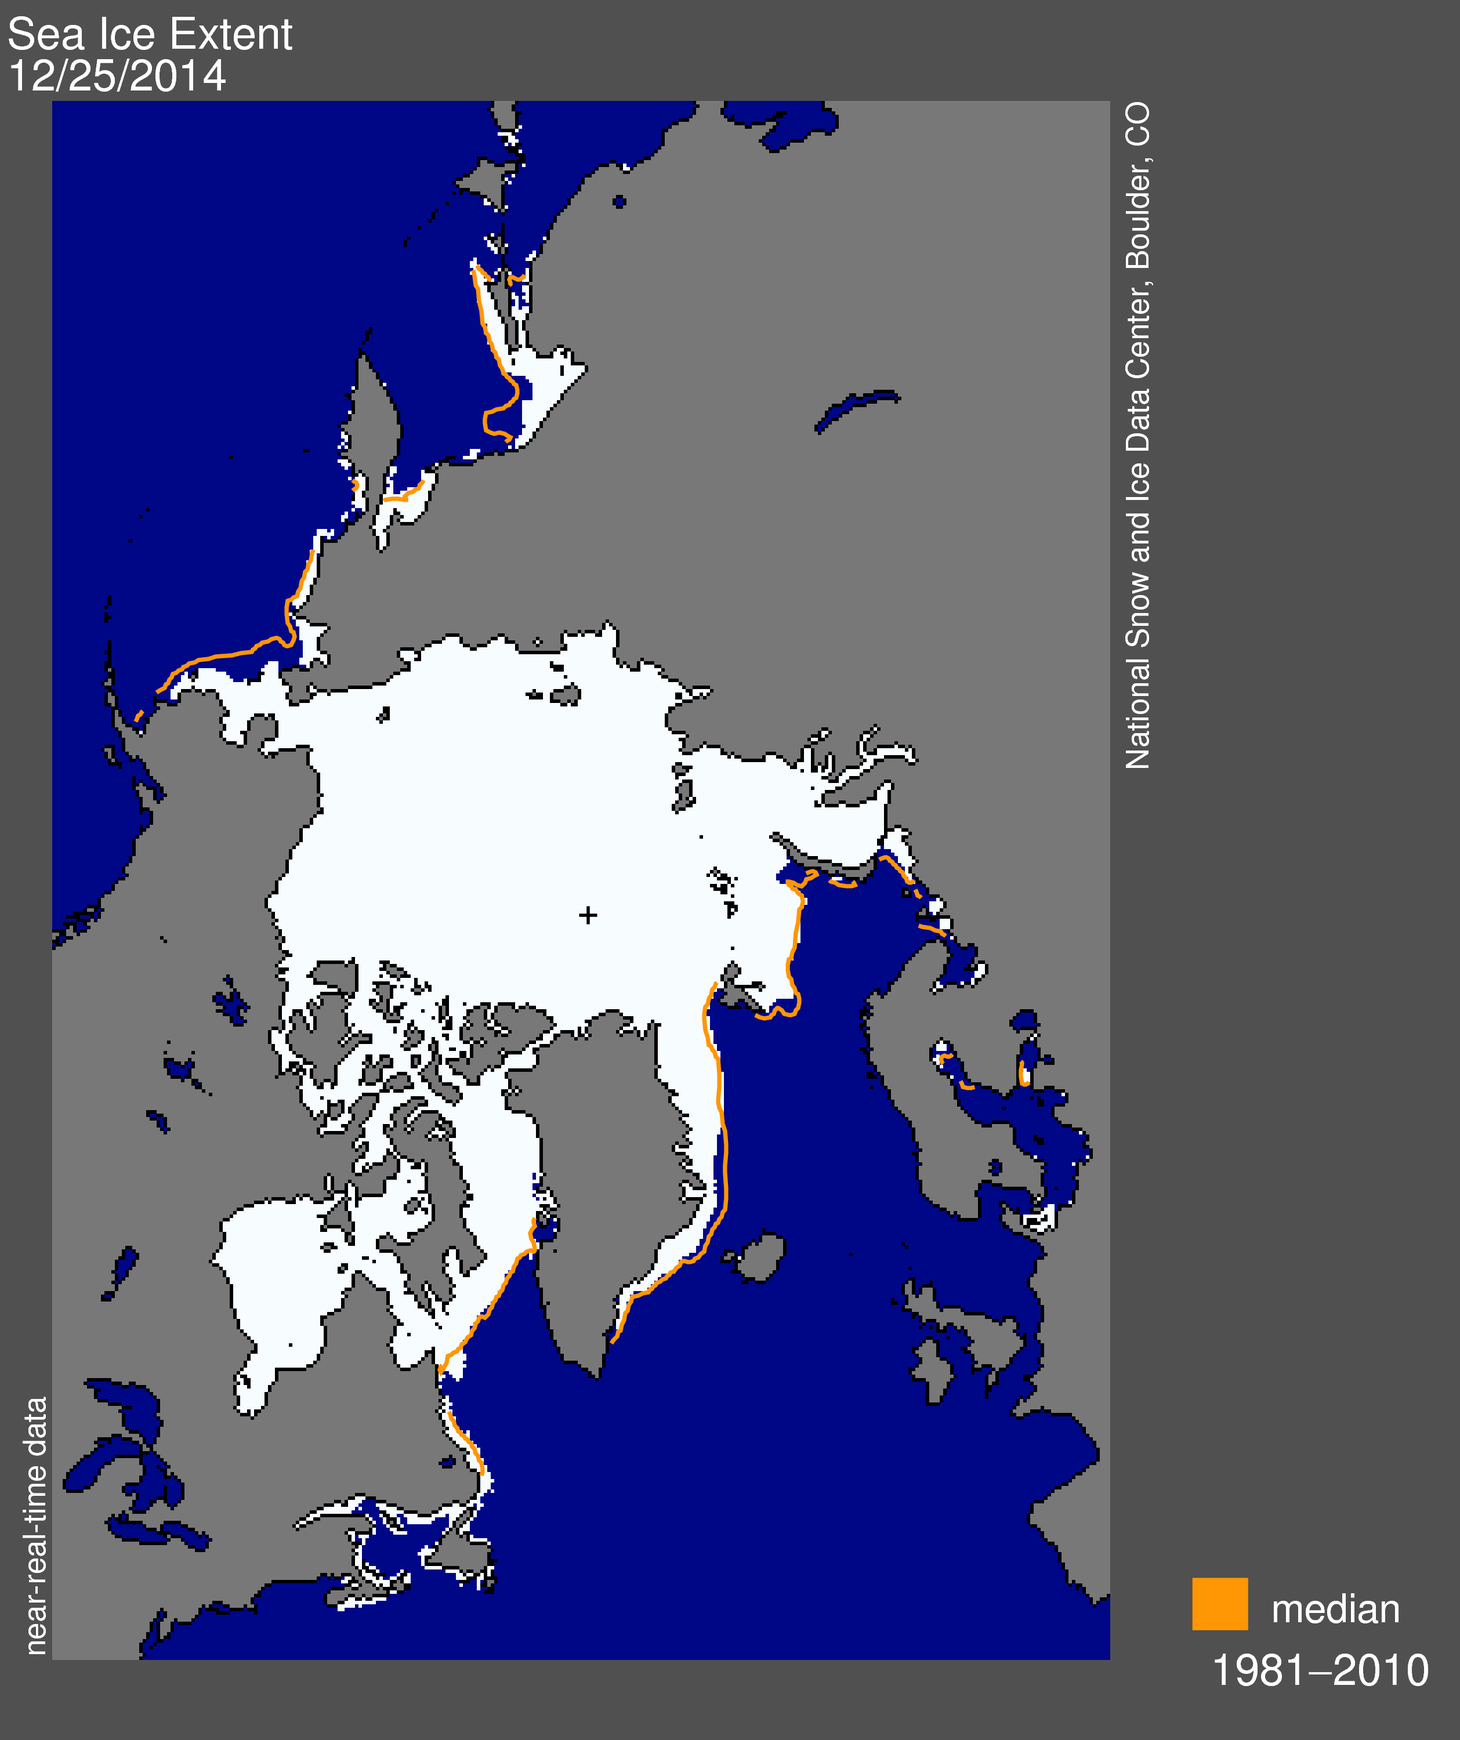
This week, Arctic sea ice in Canada, where 2/3 of the world’s polar bears live, had more sea ice than was present in the early 1970s. Globally, the ice is spitting-distance close to the 1981-2010 average calculated by the NSIDC for this date – which means lots of winter/spring hunting habitat for polar bears.
This is the peak of the polar bear birthing season (both in the wild and in zoos.) Newborns will be snug in maternity dens built by their mothers onshore or on the sea ice; the rest of the population will be out on the ice.
Regional ice charts going back to the late 1960s and early 1970s for this week show even more surprises — have a look.
First, here’s today’s ice map (26 December 2014) published by the Canadian Ice Service. Click on any of the maps or charts below to enlarge.
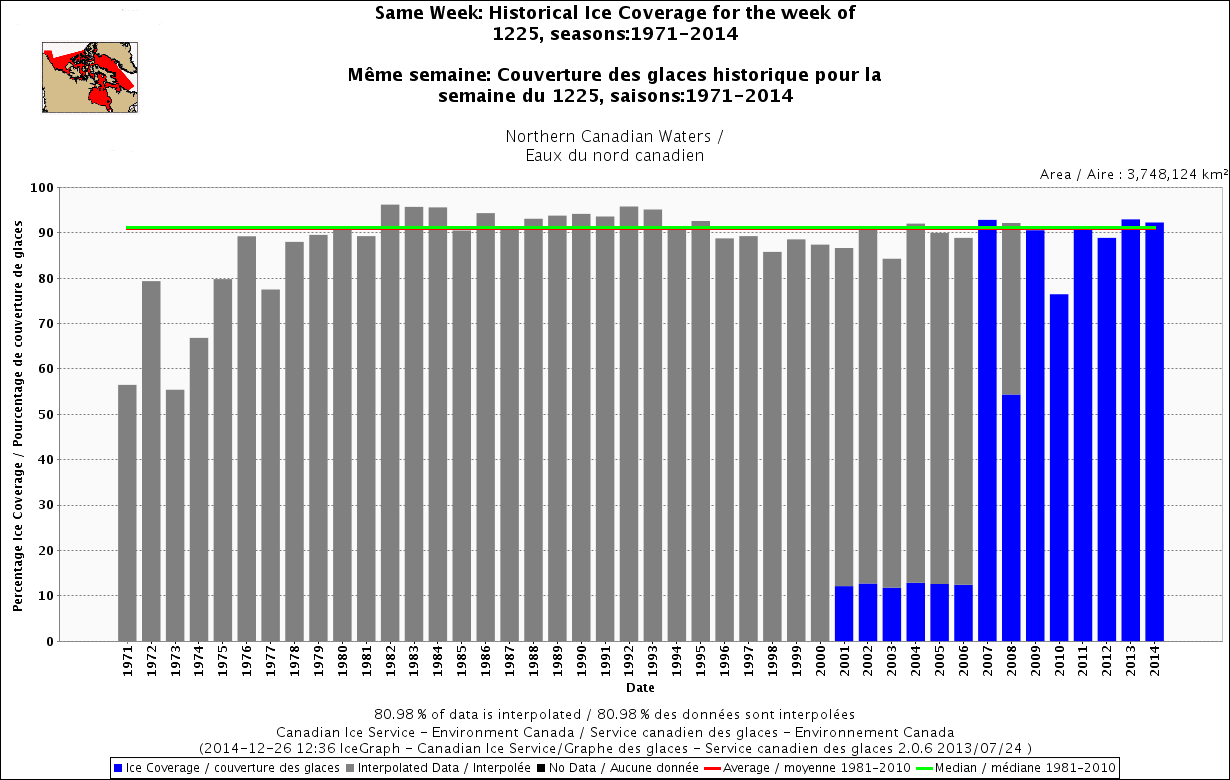
Ice in “Eastern Canada” (which in this case excludes Hudson Bay) in the late 1960s and early 1970s was well below recent levels for the week of 25 December — the area covered by the graph is noted by the map in the upper left corner, marked in red:

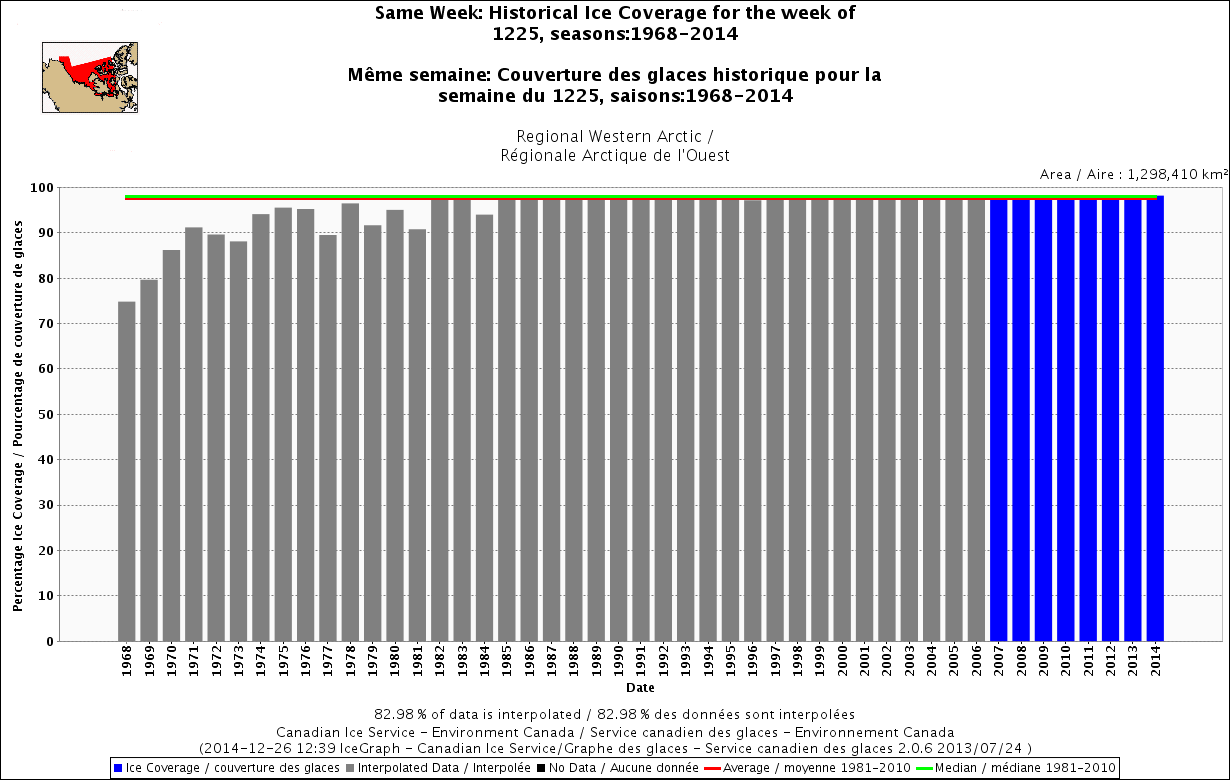
Ice in “Western Canada” (which includes the Alaskan portion of the Southern Beaufort) in the late 1960s and early 1970s was also below recent levels for the week of 25 December:
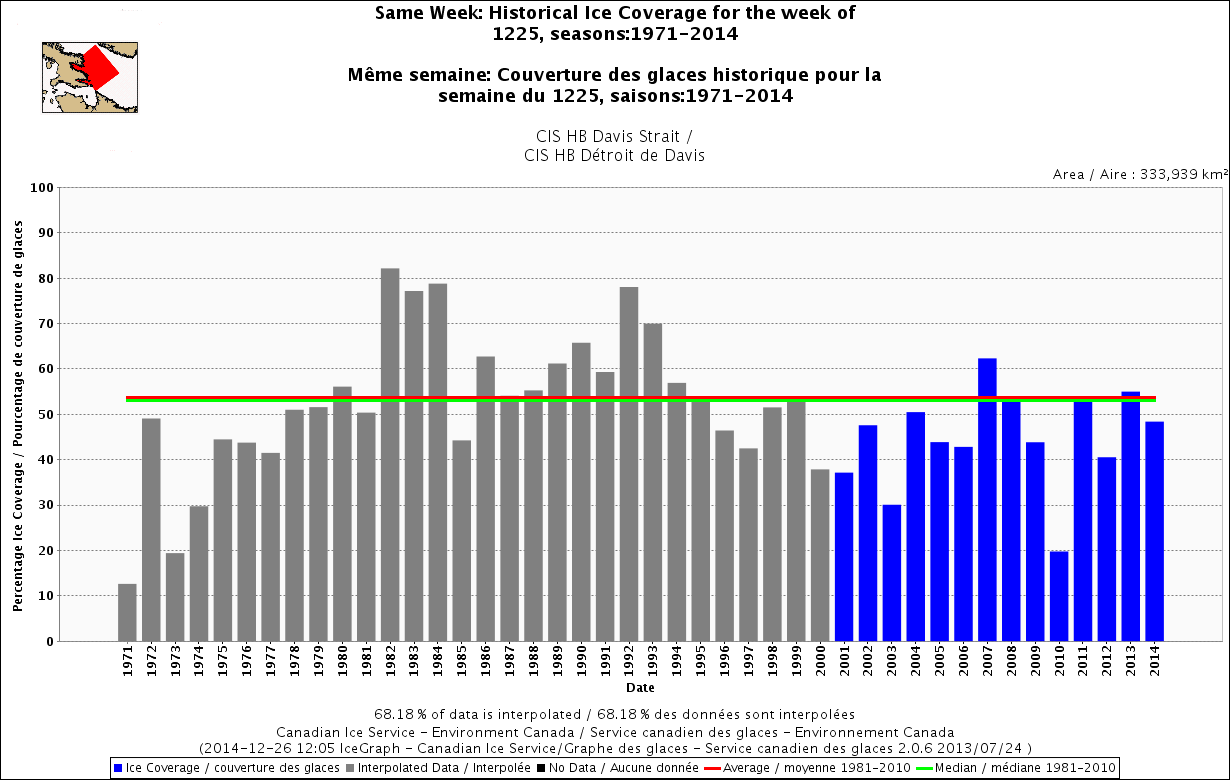
Ice in the main portion of Davis Strait is now almost average for this point in the season, even though it got a late start. Ice levels were also much lower at this week in the early 1970s in Davis Strait than they have been for the last four years (1971 being the lowest, with 1973 about as low as 2010).
But wait a minute — it turns out that the worst years for freeze-up on Hudson Bay ice (below) were 1971 and 1973. In those years, by the week of 25 December, ice levels hadn’t even come close to reaching the 50% mark considered to indicate freeze-up. Freeze-up of Hudson Bay has never been that late since.

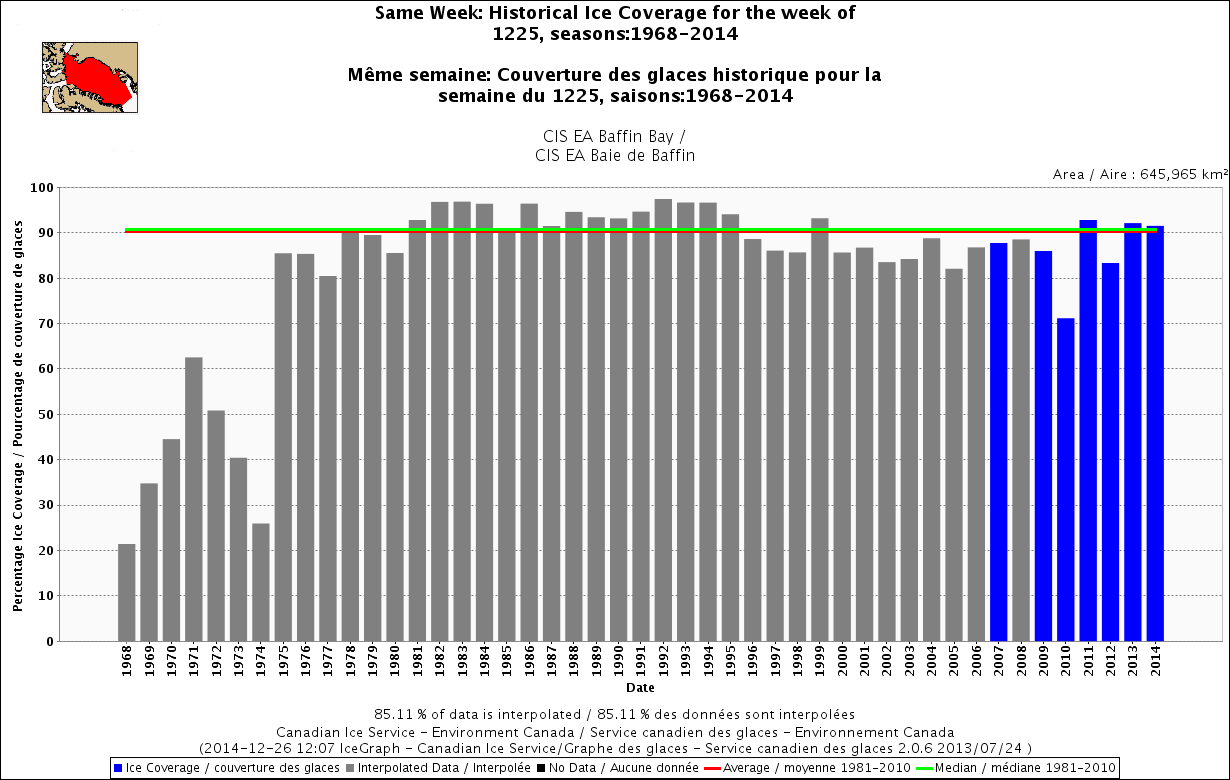
Equally astonishing, Baffin Bay ice levels were the lowest they’ve been (for this date) in the late 1960s and early 1970s than they have been since.
Funny how we never hear about this when the media and polar bear folks are raving on about the perils of “late freeze-up” — explains why they like to start the historic period for averages in 1981.


You must be logged in to post a comment.