
![]() Here’s a new resource for cooling the polar bear spin, all in one place. I’ve updated and expanded my previous summary of reasons not to worry about polar bears, which is now two years old. In it, you’ll find links to supporting information (including previous blog posts of mine that provide background, maps and extensive references), although some of the most important graphs and maps have been copied into the summary. I hope you find it a useful resource for refuting the spin and tuning out the cries of doom and gloom about the future of polar bears — please feel free to share. Pdf here of the text below.
Here’s a new resource for cooling the polar bear spin, all in one place. I’ve updated and expanded my previous summary of reasons not to worry about polar bears, which is now two years old. In it, you’ll find links to supporting information (including previous blog posts of mine that provide background, maps and extensive references), although some of the most important graphs and maps have been copied into the summary. I hope you find it a useful resource for refuting the spin and tuning out the cries of doom and gloom about the future of polar bears — please feel free to share. Pdf here of the text below.
This is the 1st anniversary of Canada providing population estimates and trends independent of the pessimistic prognostications of the IUCN/SSC Polar Bear Specialist Group (PBSG) — so let’s celebrate the recent triumphs and resilience of polar bears to their ever-changing Arctic environment.

1) Polar bears are still a conservation success story — with a global estimate almost certainly greater than 25,000, we can say for sure that there are more polar bears now than there were 40 years ago (Fig. 1). Sadly, although completing a global survey was one of the primary objectives of the PBSG at its inception 47 years ago, it has still not provided one. The current PBSG estimate is about 20,000-25,000 bears, although with several subpopulations still uncounted (Fig. 1), the actual figure is almost certainly a good deal higher (e.g. see point #3). Even with this lack of precision, the global estimate is too high to qualify the polar bear as ‘threatened’ with extinction based on current population levels – all of the concerns expressed regarding polar bears are about the future.
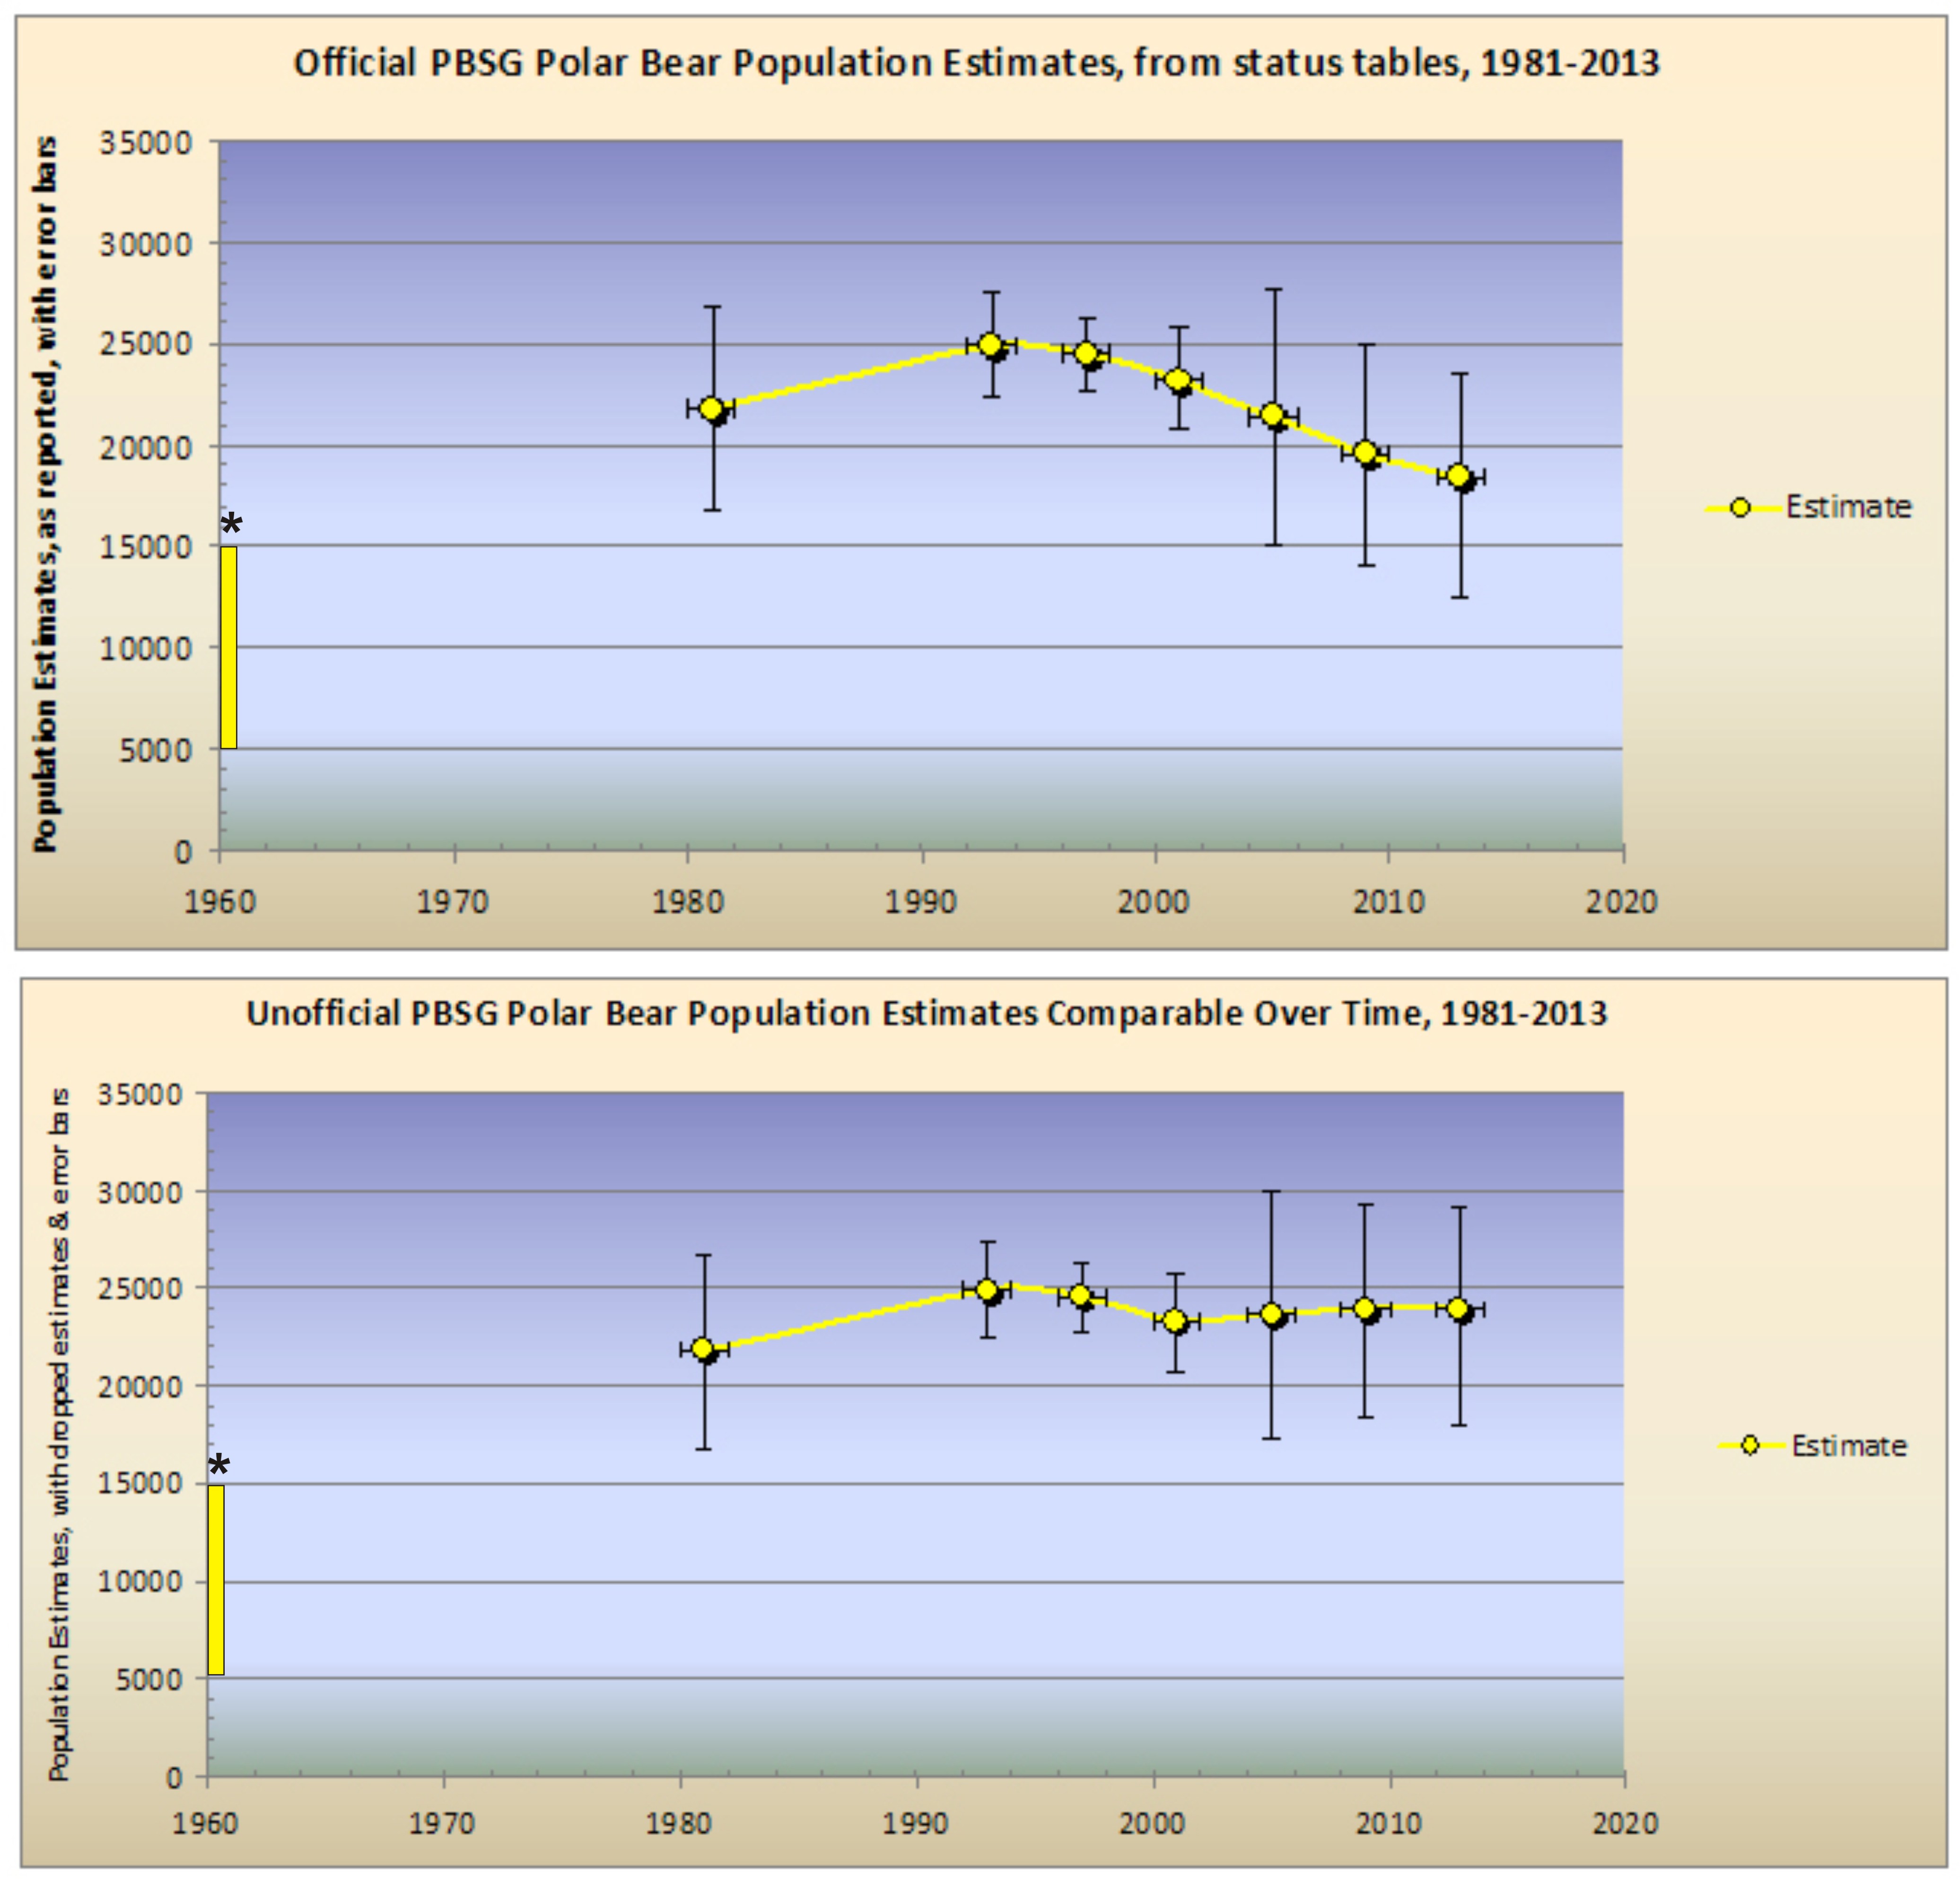
Figure 1. Upper graph uses totals reported in PBSG status tables (to 2013), with min/max; Lower graph uses the same figures, but adds back in the so-called “inaccurate” estimates dropped between 2005 and 2013 (in 2014, the PBSG finally did the same). The 1960 figure * is a ballpark estimate. Original here.
2) The most recent status assessment for polar bears, published by Environment Canada in May 2014, shows only two subpopulations are “likely in decline,” down from four listed by the PBSG as declining in 2013 and seven in 2010 (Fig. 2). Baffin Bay earns its ‘likely decline’ status due to suspicions of over-harvesting (so far not confirmed), not sea ice decline. And the recent assessment of Southern Beaufort bears (see point #7 below), which was based on a newly-formulated (i.e. untested) population estimate model that used a truncated data set, recorded a decline acknowledged to have been caused by thick ice conditions in spring, not summer ice declines.
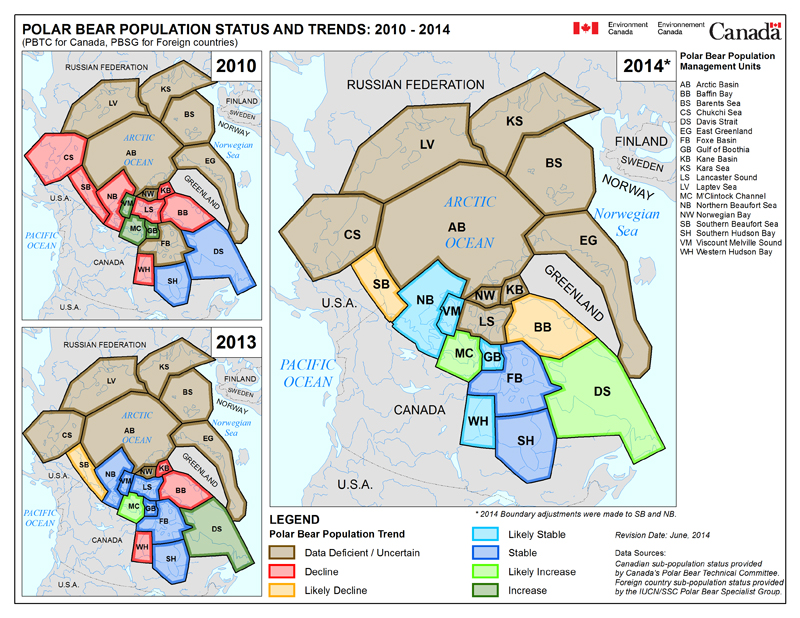
Figure 2. Most recent global polar bear population status assessment (far right), using figures from the IUCN Polar Bear Specialist Group assessment (2013) and Environment Canada (May 2014). Note that of the two subpopulations denoted as being on a likely declining trend, BB (Baffin Bay) is suspected to be declining due to over-hunting and SB (Southern Beaufort) had an unfinished rebound caused by thick spring ice conditions in 2004-2006; a more recent survey (2012) indicated SB numbers were higher than the previous 10 years. Note the improvement since 2010 (upper left) and even 2013 (lower left). Note also the number of regions considered “data deficient,” which have had no population survey or no recent one.
3) A first-ever Kara Sea population estimate completed in late 2014 potentially adds another 3200 or so bears to the global total. This estimate (range 2,700-3,500), published by Russian biologists, has not yet been added to the official global count.
4) Polar bears in the Chukchi Sea are in good condition and reproducing well – results of a new study were a direct contradiction of the repeated “message” that recent large sea ice declines in late summer put these bears in peril. A paper published online in late summer of 2013 showed that Chukchi polar bears are doing better than they were in the 1980s (Fig. 3) and better than any others except the bears in Foxe Basin (northern Hudson Bay), who are doing exceptionally well.
While there is still no official population estimate for the Chukchi Sea (officially listed as zero, previously estimated at about 2,000), it appears that the recording-breaking sea ice levels in September 2007 (lowest to that date since 1979), had no discernible effect on Chukchi Sea polar bears. As a result, the status of Chukchi Sea bears was upgraded from “declining” to “data deficient” by the PBSG in 2013 (pdf here). Despite the gloomy predictions, extra-low ice extent in late summer/early fall was actually better for Chukchi polar bears – and that’s very good news.
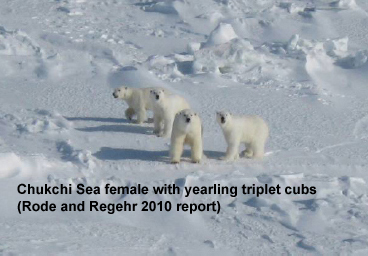
Figure 3. One of the 14 Chukchi Sea polar bear females captured between 2008 and 2011 had triplet cubs – a phenomenon rarely seen outside Western Hudson Bay. All three of her cubs (pictured above) had survived their first year, an astonishing achievement in any region. From a 2010 interim report on Chukchi Sea research, reference here.
5) The reason Chukchi Sea polar bears did so well with an extended open-water season was because ringed seals (their primary prey) do most of their feeding in ice-free summer waters — more fat seals mean more fat seal pups the following spring for polar bears. In recent years with extensive September sea ice minimums, seals got extra-fat from the extra summer feeding time, a recent study found. This meant that some seals provided a more energy-rich food source for polar bears over the following fall and winter, an immediate benefit to the bears. In addition, so many well-feed female ringed seals produced fat healthy pups the next spring, which meant more food for polar bears when they needed it the most.
Between 2008 and 2011, both ringed seals and polar bears did better than either had done in the 1980s when summer sea ice coverage was more extensive. Oddly, in March 2013, less than 6 months after ringed seals were placed on the American list of species ‘threatened’ with extinction (23 Dec. 2012), ringed seal biologists were reporting to their peers that the results of their Chukchi Sea research contradicted their dire predictions. Surprisingly to them, less summer sea ice was better for ringed seals, not worse. And in July 2014, a judge decreed that the 2012 decision to list bearded seals in Alaska as ‘threatened’ was deficient and showed no near-term threats. The judge called it “an abuse of discretion.” It turns out that the USA stands out as the only nation that insists Arctic seals have been (or will be shortly) harmed by recent declines in summer sea ice, even though it has the least amount of sea ice habitat of all Arctic nations.
6) Polar bears have been shown to move from areas with unsuitable ice to areas with better ice conditions, even over the short term – evidence of their ability to adapt to changing sea ice. Recently, it was noted that a number of bears from the Barents Sea (whose sea ice coverage is strongly influenced by variations in the Atlantic Multidecadal Oscillation, aka AMO) moved to the islands of Franz Josef Land archipelago in the Kara Sea, where there has been more predictable ice cover – one example of polar bear flexibility. A past example was the noted movement of Southern Beaufort bears into the Chukchi Sea during the catastrophic 1974-1976 episode of thick spring ice in the Eastern Beaufort, when many bears and seals moved into the Chukchi Sea. Flexibility in choosing maternity dens (onshore vs. sea ice), as well as variability in feeding areas (nearshore vs. offshore), give polar bears the resilience they need to survive as a species.
7) Southern Beaufort bear numbers, according to a preliminary US Fish & Wildlife Service survey (pdf here, pg. 17, lower right), were higher in 2012 than they had been in the previous ten years — indicating a full recovery from the dramatic decline (25-50%) that occurred between 2004 and 2006 because of the effects of thick spring sea ice. For unknown reasons, the newly-developed models used to estimate Southern Beaufort population size used only data up until 2010, even though mark-recapture data up until 2012 were available (which we know because it was used for another study, see next point).
8) The dramatically low September ice decline of 2012 apparently had no apparent effect on Southern Beaufort Sea polar bears, because we’ve heard nothing to indicate the bears were negatively affected. Even though 2012 had the longest open-water period in the Southern Beaufort since at least 1979 (Fig.5), researchers doing mark-recapture work in the area (publicized in a USGS press release) reported no starving bears during the summer of 2012 or in the spring of 2013. Instead, an aerial survey conducted in the fall of 2012 reported that numbers were higher than they had been in a decade (see point 7). That’s because the extent of sea ice in early summer and late fall means little to polar bears, in part because most bears eat very little then, even if they are on the ice – and that’s good news.
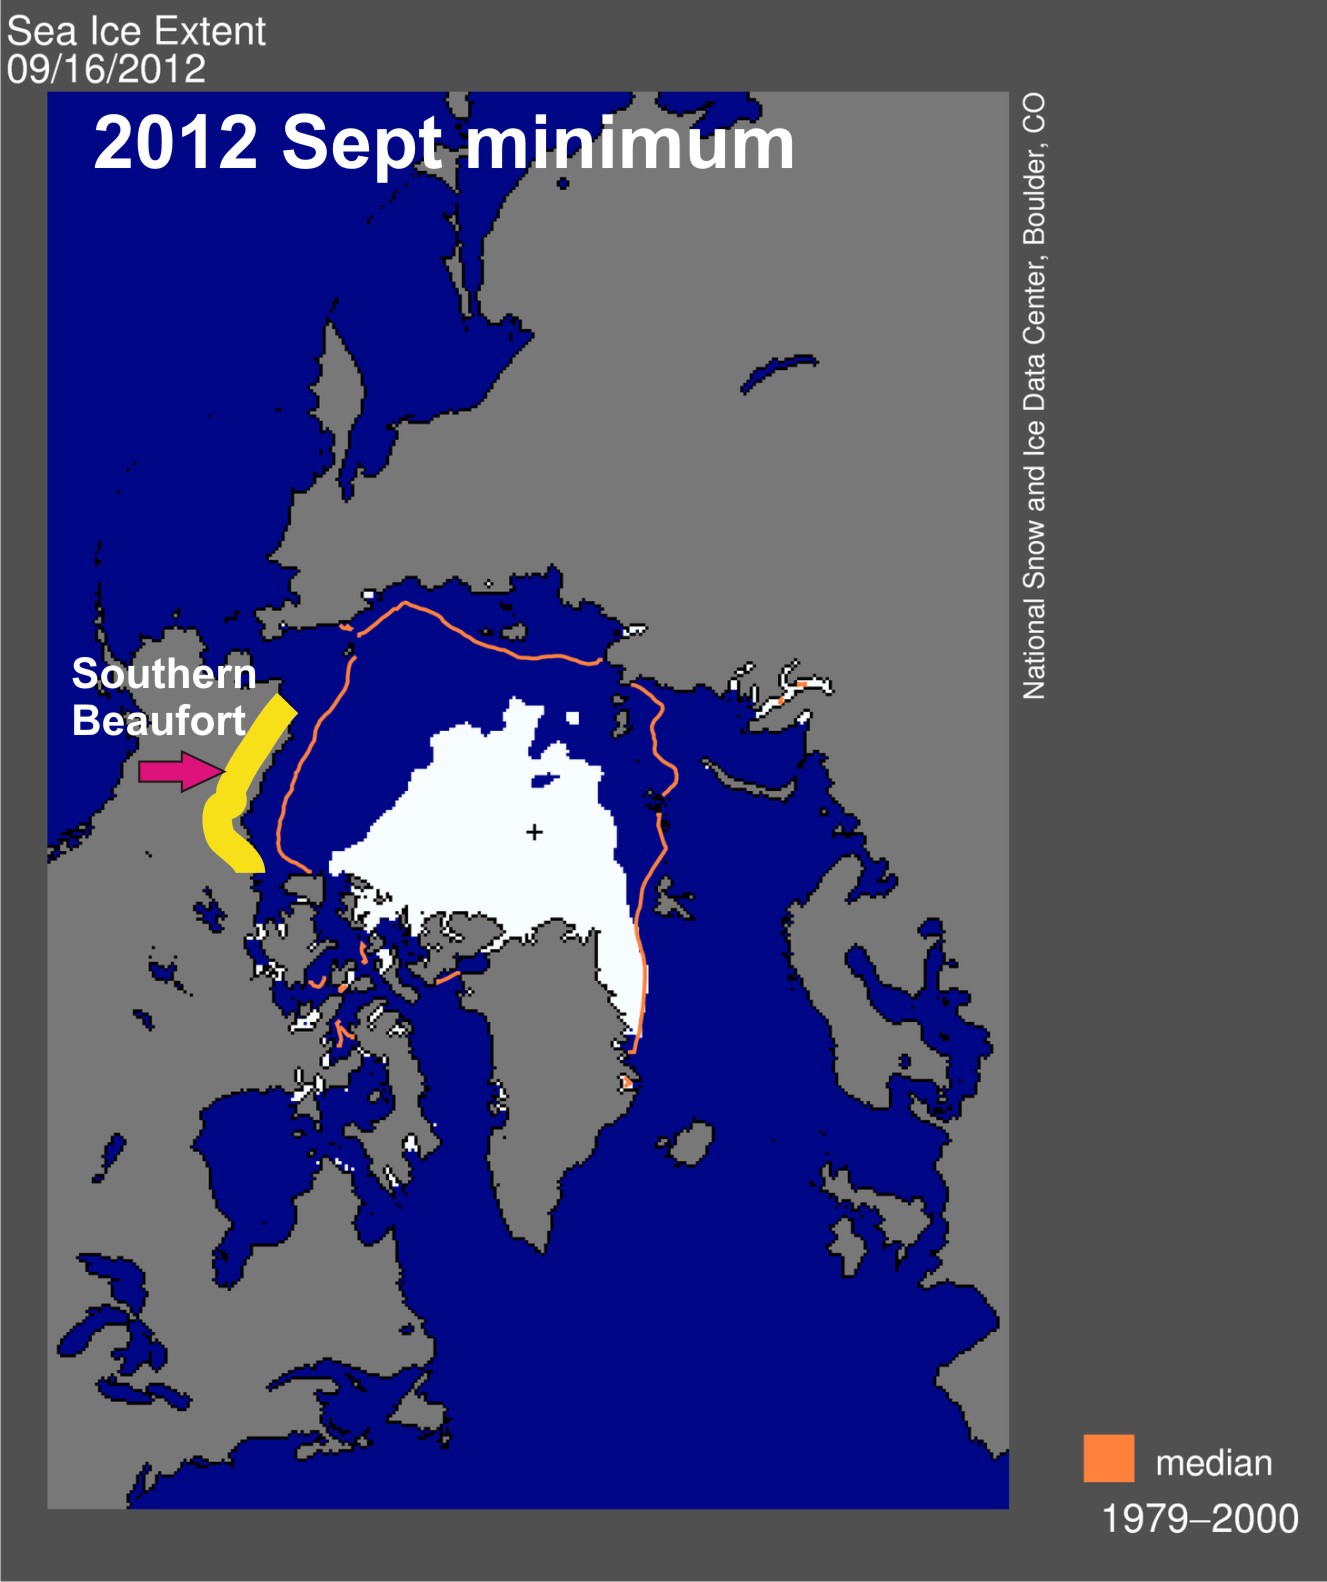
Figure 5. Sea extent at the 2012 late summer minimum, in relation to the Southern Beaufort Sea polar bear region, showing the extensive open-water season. Yet, that fall and following spring, no starving bears or incidents of cannibalism were reported by biologists working in the area.
9) There are so many polar bears in Foxe Basin and southern Davis Strait (Fig. 6) that they may be decimating some nesting sea bird colonies — a down side of too many bears? And in Western Hudson Bay, polar bears have been reported eating record-numbers of caribou and snow geese – because populations of caribou and snow geese are higher than they have been in decades. Such fortuitous food sources for eastern Canadian bears provide a little relief from their summer fast, as whale carcasses do for western bears (like those at Kaktovik in the Beaufort Sea). However, all evidence suggests that such terrestrial foods are not necessary for bears that have fed well during the previous spring – whether on land or out on the ice, most polar bears eat very little over the late summer/early fall months.
10) Western Hudson Bay polar bear numbers have stabilized – they have not continued to decline since 2004 as predicted, although a decline has been proclaimed as fact for the last few years by PBGS biologists. In an internal government report, Canadian polar bear biologists found that if they used the same methods to analyze mark-recapture data collected in 1998-2004 as they did for data from 2004-2012, the population estimates are virtually identical (Report pdf). In other words, there has been no further decline in numbers of WHB polar bears since 2004. You may still find people saying that there are only about 800 bears in WHB, but that estimate was based on a misleading calculation – the official estimate is about 1,000 bears, in agreement with a 2011 aerial survey.

Figure 6. Most recent global polar bear population status assessment, using figures from the IUCN Polar Bear Specialist Group assessment (2013) and Environment Canada (May 2014). Note that of the two subpopulations denoted as being on a likely declining trend, BB (Baffin Bay) due to concerns about over-hunting and SB (Southern Beaufort) was still rebounding from thick spring ice conditions in 2004-2006 (a more recent survey (2012) indicated SB numbers were higher than the previous 10 years).
11) Hudson Bay sea ice is not on a steadily precipitous decline – for the last three years, break-up has been average (July 1) or later, while freeze-up has consistently been only about 2 weeks later than it was prior to 1991. A new paper published in 2013 showed that for polar bears in Western Hudson Bay (WHB, discussed here and here), breakup is best defined as the date of 30% ice coverage for that region (about 20% for the bay overall), while freeze-up occurs at about 10% for the region (5-10% for the bay overall).
However, polar bear biologists (see 2013 unpublished report) continue to use their out-of-date definition of breakup and freeze-up dates for WHB (date of 50% ice for both) in their attempts to correlate sea ice changes with polar bear population size. Using an approximation of the newer, best-for-polar-bears breakup date definition (Fig. 7) — because there hasn’t been an update since 2009 — there has not been another very early breakup in Hudson Bay like the one that occurred in 1999 (June 17). While 2009 was a surprisingly late breakup year and 2010 was earlier than average, all other years since then (2011-2014) have been average or above average for the 1991-2009 period (July 1). There has also not been a late freeze-up since 2010 (when it was delayed until early December).
All of which suggests that in Western Hudson Bay, some years have been good for polar bears and others have been not so good, but there has not been a relentless or precipitous decline in sea ice breakup dates over the last thirty years, which has allowed polar bears there to adapt via natural selection.
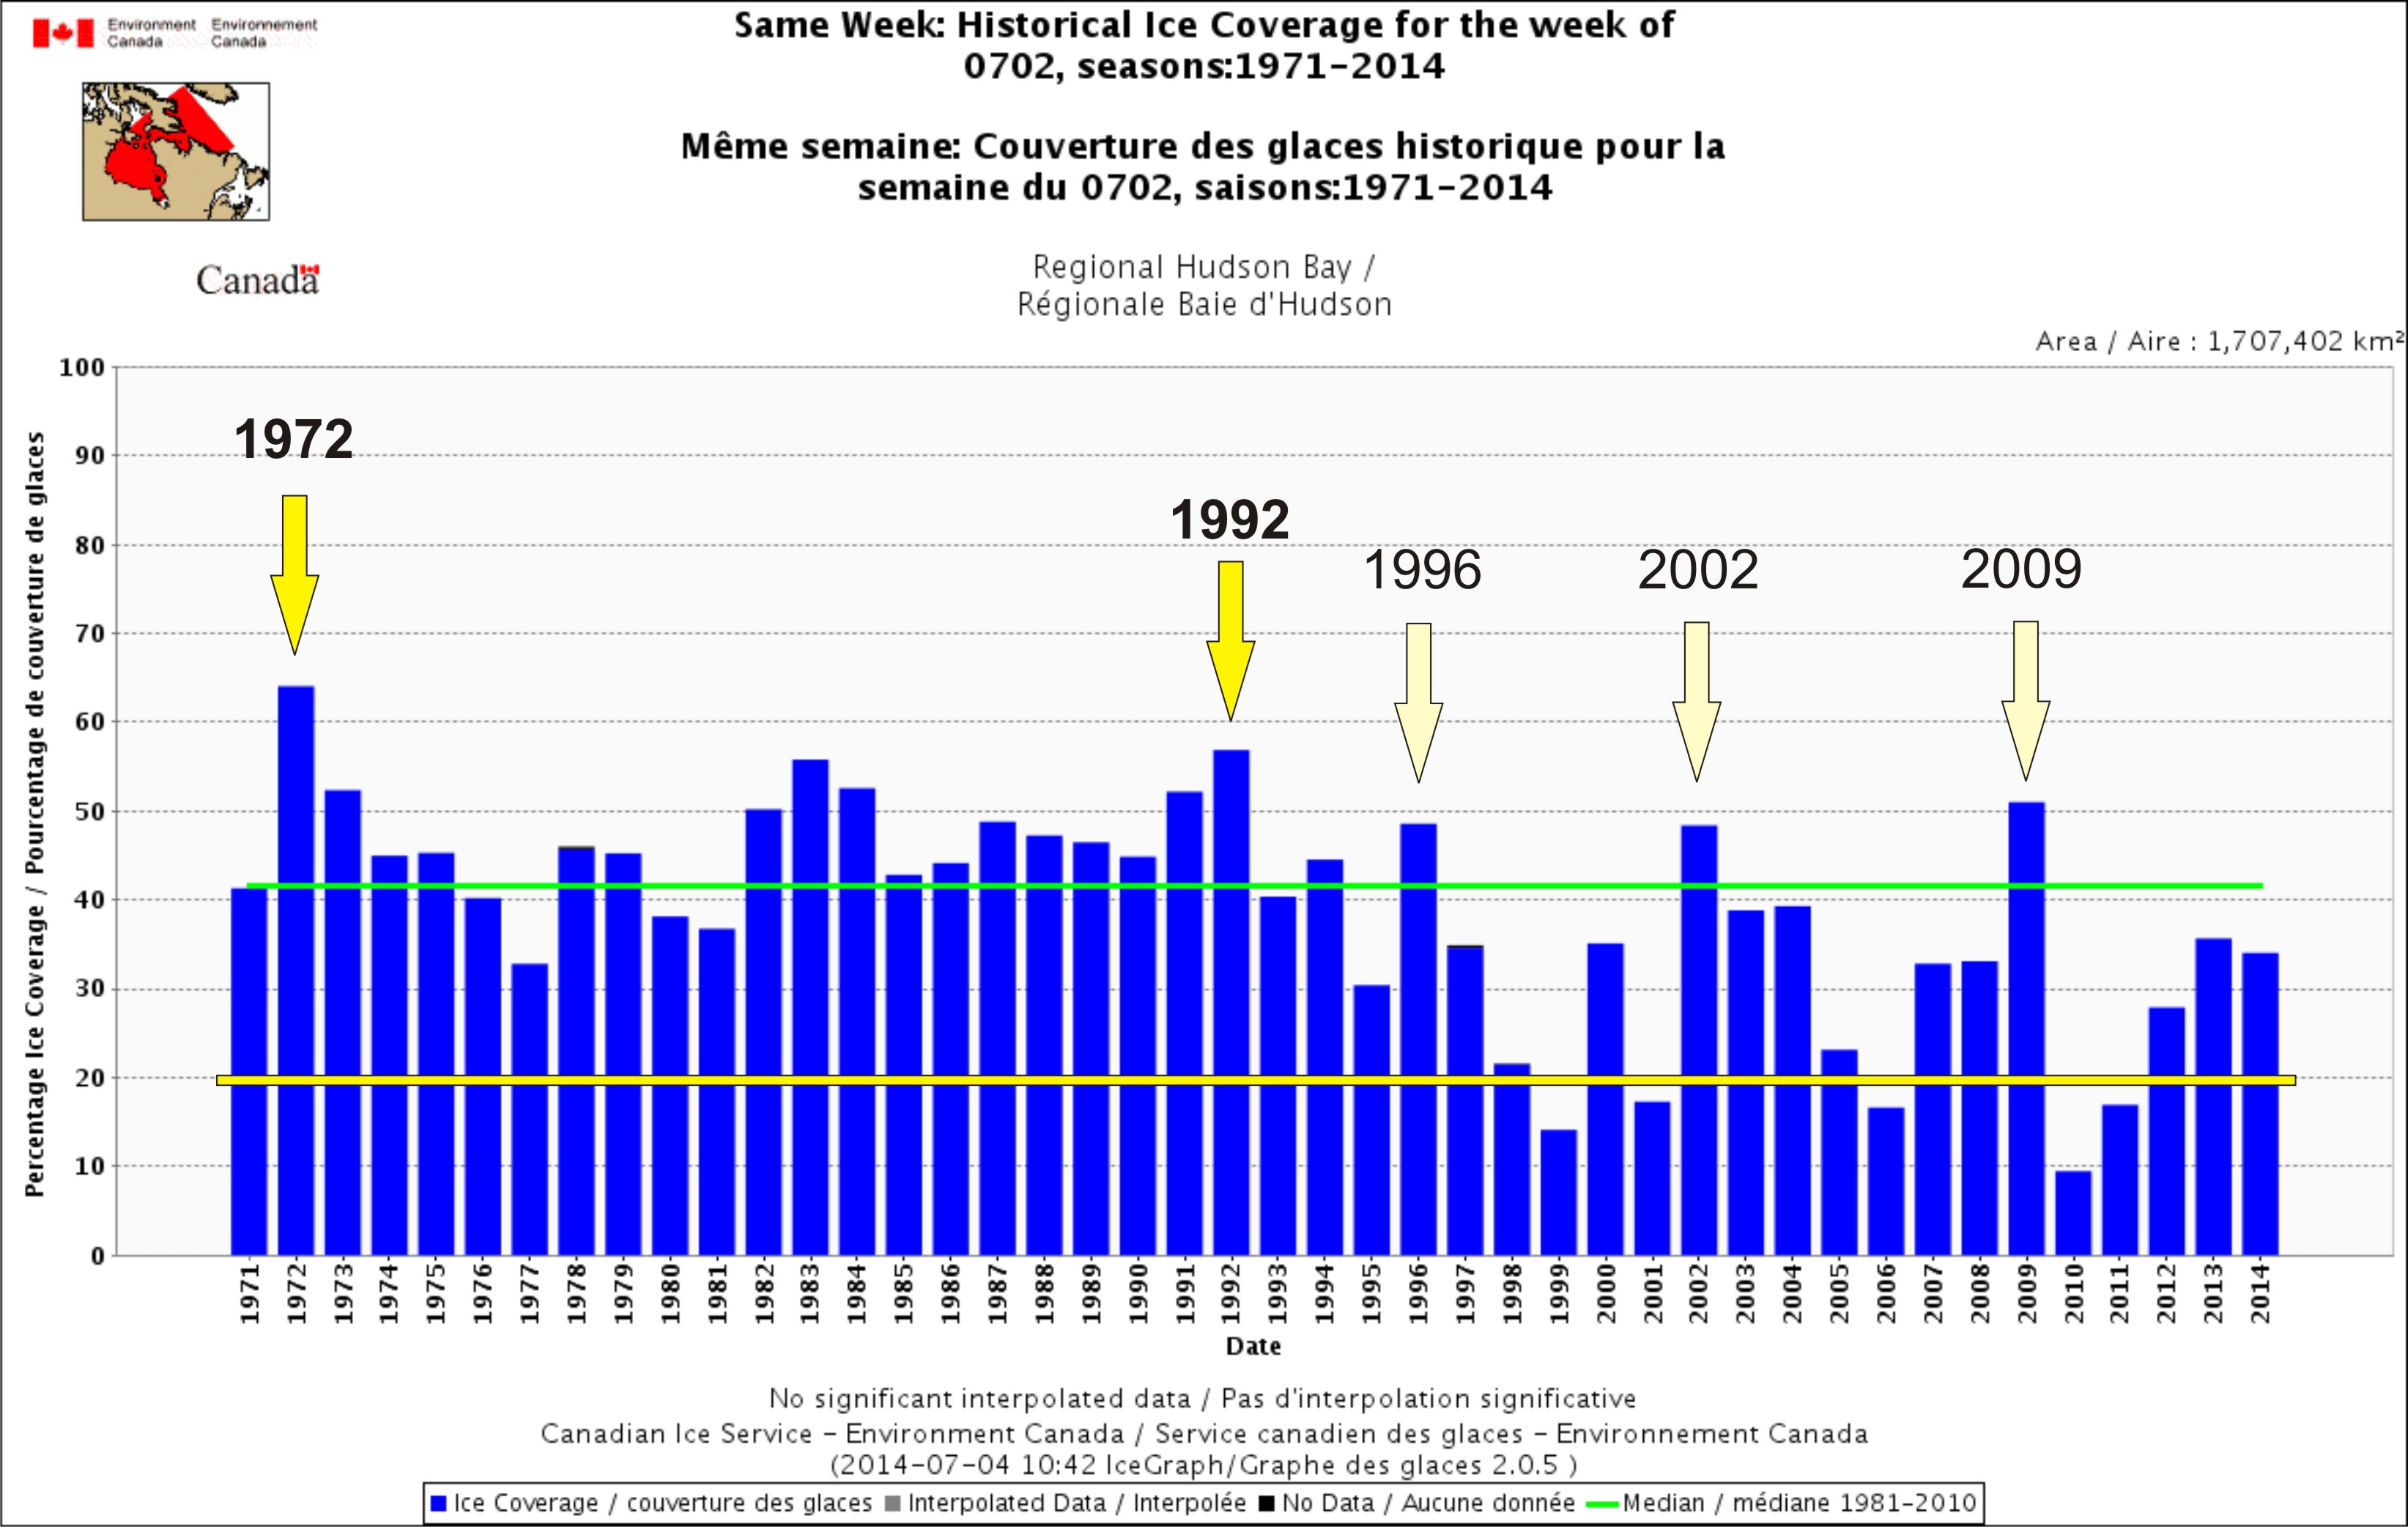
Figure 7. Sea ice coverage on Hudson Bay for the week of July 2, 1971-2014. The green line is the 1981-2010 median, yellow line indicates 20% ice coverage level for the entire bay, and arrows denote very late breakup years. Note that breakup for the Western Hudson Bay polar bear subpopulation is determined when ice in that region reaches the 30% level (Cherry et al. 2013). This means Hudson Bay ice coverage overall is likely close to 20% by the time that W. Hudson Bay coverage is reduced to 30%. Note how few years were at or below 20% by July 2: 1998, 1999, 2001, and 2006, 2010 and 2011 – six times over the last 44 years. Click to enlarge.
12) The Canadian Broadcasting Company (CBC, a public broadcaster) produced a relatively balanced documentary about some of the controversies involved in polar bear conservation, called “The Politics of Polar Bears.” The long version of the program can be viewed online here, and a shorter (30 minute) version here. It included an interview with the head conservation officer in Churchill, who noted that virtually none of the “problem bears” (see point #13) captured over the last 5 years were starving or lean. That suggests that many of the problems with polar bears that WHB communities have experienced in recent years are due to the higher number of bears – as predicted by Ian Stirling in the 1970s – combined with other factors (like more residents and tourists), not sea ice changes.
13) The worst year for problem bears in Churchill that could be correlated with lack of sea ice was back in 1983, when the last human fatality from a polar bear attack occurred. Ironically, 1983 was a year when breakup of sea ice was later than usual (so they had more time on the ice to feed) but unfortunately, freeze-up was also much later than usual, leaving many bears in a very lean state. While 2004 also had a high number of problem bears, there have been no published problem bear statistics compared to sea ice status since 2004. While there were polar bear problems reported in 2013, freeze-up was not late that year, nor was breakup early. Breakup and freeze-up dates for Western Hudson Bay are highly variable (see point #11) and do not appear to correlate with high or low Arctic sea ice levels in September (Fig. 8).
14) Across the Arctic, there has been only a marginal decline in total sea ice extent (Fig. 8) during the critical spring feeding period (March through June), when polar bears require the ice as a hunting platform for gorging on young, fat seals. Polar bears consume two-thirds or more of their yearly food intake during this time – they generally eat little during the summer whether on land or on the ice. Feeding picks up again in the fall but declines over the winter, explaining why polar bears everywhere are leanest at the end of winter, just before Arctic seals pups are born.

Figure 8. Sea Ice Figure 4.2 from NOAA’s “Arctic Report Card 2014.” See my discussion here. Note the lack of error bars indicating the estimated accuracy of each value, which should be present on a scientific graph.
15) There is no plausible evidence that regulated subsistence hunting is causing polar bear numbers to decline, despite suspicions harbored by Polar Bear Specialist Group biologists. The one region where over-hunting is suspected (but not yet proven) to have caused a difference to population numbers is in Baffin Bay. However, results of the reportedly completed population survey there has still not been released, although they were promised by the end of 2014.
16) Many polar bear biologists have stopped putting satellite radio collars on polar bears and have turned to other methods to gather population size data — that means less handling stress for the bears. In some regions, like the Barents and Chukchi Seas, large-scale mark-recapture studies would be logistically impractical (although small projects are conducted in the Barents Sea). In others, repeated captures (each involving a helicopter chase and tranquilizer guns) are seen by Arctic residents as stressful for the bears, especially females with young cubs. Also, the drug residues are potentially bad news for aboriginal hunters and their families that eat the meat. Oddly, polar bear biologists chose to dispel the serious concerns over invasive research by presenting the outputs of computer models.
At the moment, in most regions of Canada with polar bears (Fig. 9), including Nunavut, the Northwest Territories and Quebec, permits are no longer being approved for mark-recapture work (discussed here and here). Invasive research does continue in other areas within Canada (especially WHB and SHB, and Labrador/Newfoundland) and beyond, particularly in the Southern Beaufort and East Greenland.
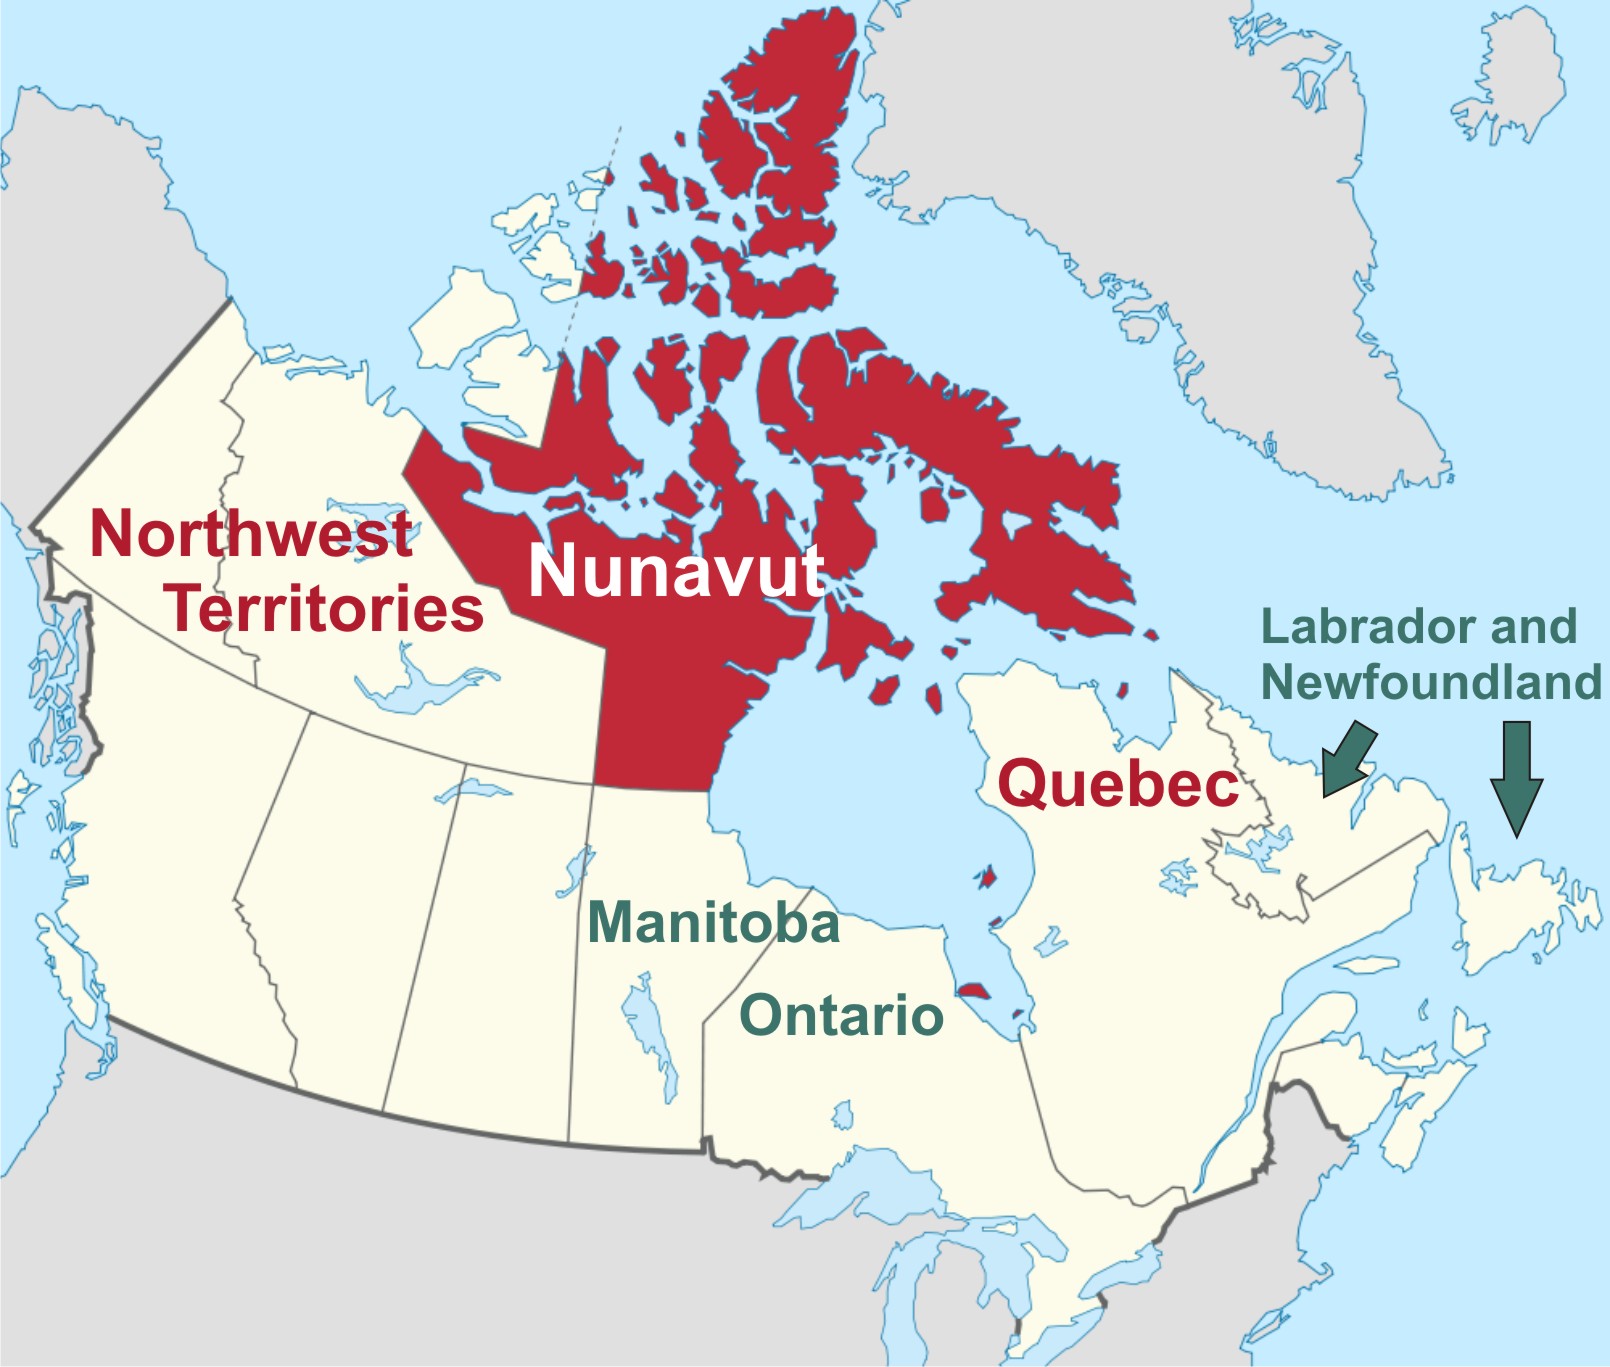
Figure 9. Regions in Canada where most research permits are no longer issued for mark-recapture work on polar bears: Northwest Territories, Nunavut, Quebec. Mark-recapture methods are still permitted in Manitoba and Ontario (home to Western and Southern Hudson Bay bears) and Labrador/Newfoundland (southern Davis Strait bears). Details here.
17) There have been no further reports of cannibalism since at least 2011 and no reports of den collapses due to unusually warm winter or early spring temperatures since 1990 — even though 2012 had the lowest summer ice extent since 1979. Even in regions where bears are reportedly under stress (e.g. Southern Beaufort, Western Hudson Bay, Barents Sea), we have not had any further reports of cannibalism or den collapse deaths – either through the media or in the published literature.
18) East Greenland bears appear to be the most “polluted” of all polar bears tested so far, they seem to be doing OK. Even their penis bones are holding up – reports that polar bear penis bones have been breaking due to weakening bone structure due to retained toxic environmental chemicals have sensationalized the original report, which only said the bones could perhaps break.
19) One of the most recent genetic studies published emphasized that polar bears, as a species, survived more than previous one warm period when there was virtually no summer sea ice. Sea ice has varied – countless dozens of times – over the short term (decades-long climate oscillations) and the long term (glacial-to-interglacial cycles of thousands of years). Over the last 100,000 years, for example, there have been periods of much less ice than today, but also much, much more. Polar bear population numbers probably fluctuated up and down in conjunction with these sea ice changes but the polar bear as a species survived – and so did all of the Arctic seal species it depends on for food, including Pacific walrus (a species limited by food, not sea ice). Such survival indicates that these Arctic species, in an evolutionary sense, are very well-adapted to their highly-variable habitat, despite their low genetic diversity.
20) Polar bears today are well distributed throughout their available habitat (winter sea ice), which is a recognized characteristic of a healthy species. While there has recently been a suggestion of a putative “range contraction” of polar bears due to sea ice declines, the authors offered only changes in seasonal use to support their claim – not the total abandonment of former territory that is meant by the term “range contraction.” Polar bear territory is still pretty well defined by the maximum extent of Arctic sea ice in March.
These are all good reasons to feel good about the current status of the polar bear. Polar bears are not currently threatened with extinction due to declining sea ice, despite the hue and cry from activist scientists and environmental organizations. Indeed, because the polar bear is doing so well, those who would like to see polar bears listed as ‘vulnerable’ on the IUCN Red List are depending entirely upon prophesied declines in summer sea ice to occur decades from now to make their case. The truth is, right now, polar bears are doing well despite dramatic declines in summer sea ice, for one simple reason: polar bears don’t need ice in late summer/early fall as long as they are well-fed in the spring.


You must be logged in to post a comment.