
Polar bear habitat is close to average for this date all over the Arctic this week. Barents Sea pack ice has increased substantially since last week and the ice in Eastern Canada is still well above average (and higher than 1979-early 1980s). Arctic ice has grown since a preemptive call for “the lowest maximum extent on record” was made by NSIDC last week — there is now at least as much ice for this date as there was in 2011 and almost as much as there was last year (2014).
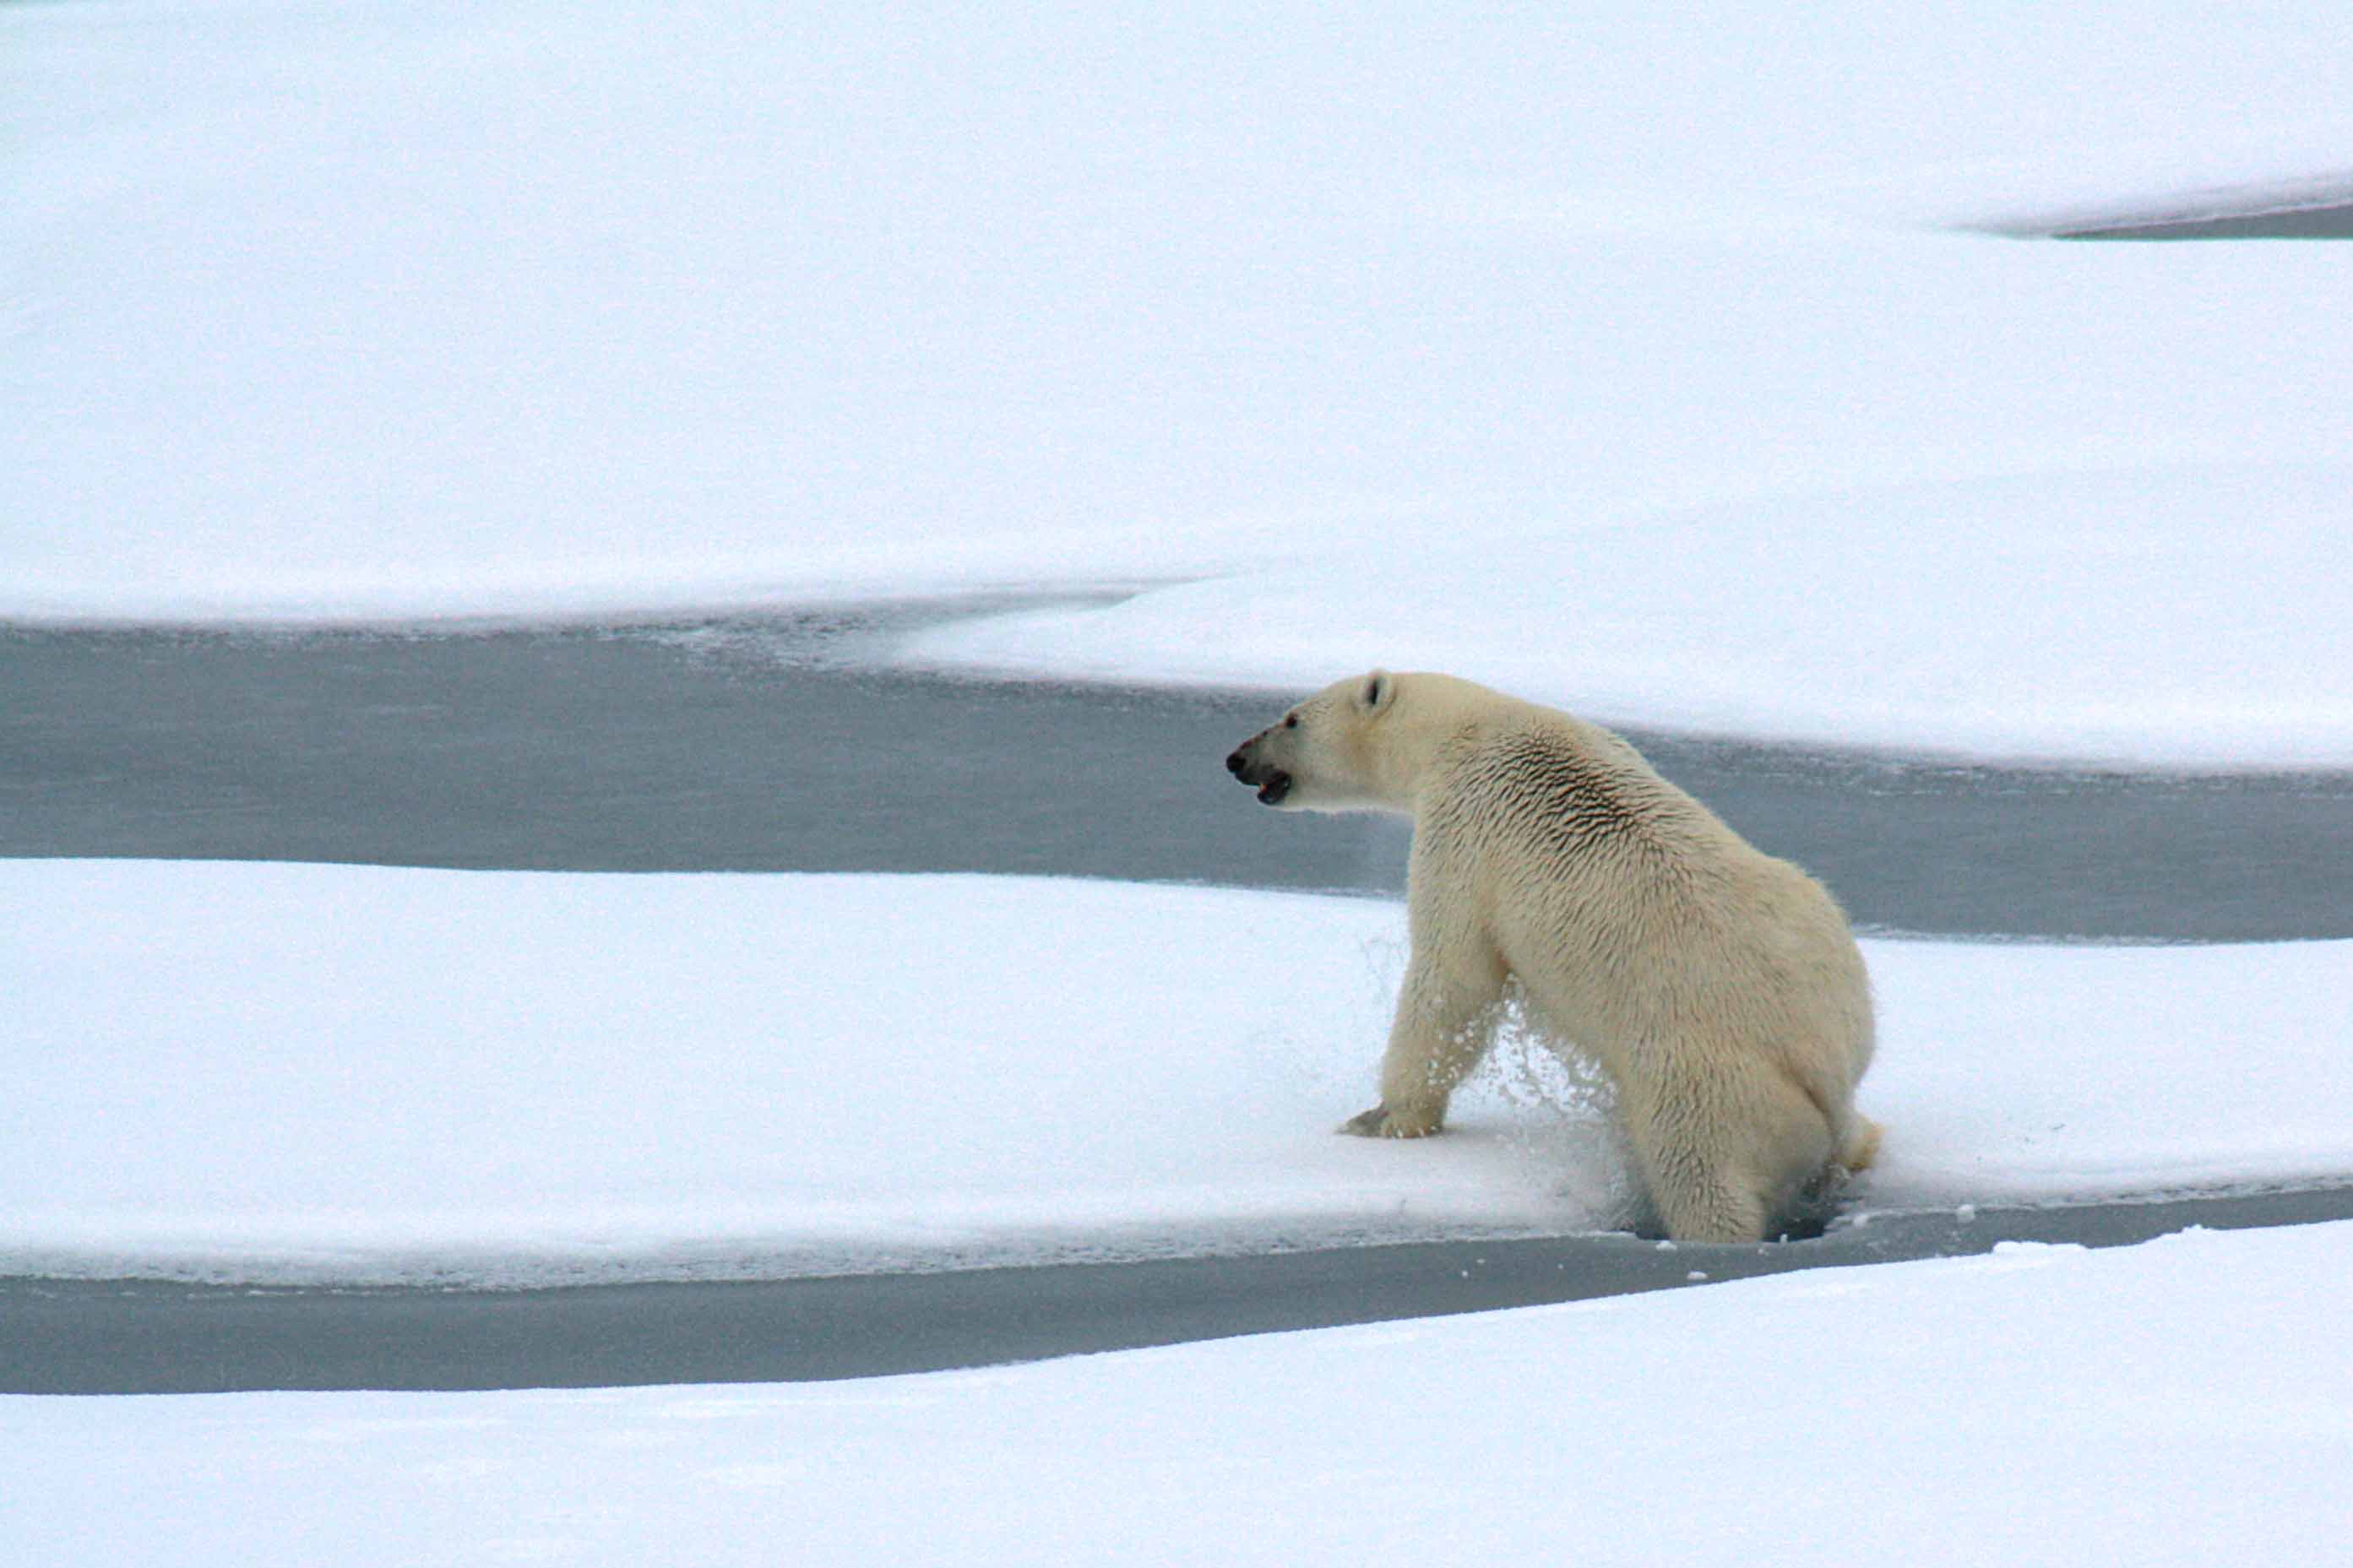
Southern Davis Strait polar bears are out feeding on the glut of harp seals in the pack ice off Labrador and Newfoundland (discussed in detail here). One or more bears strayed a bit from the pack and ended up swimming around near the Hibernia oil platform (not far from the ice edge, although the CBC reports didn’t mention that “minor” fact), discussed in this recently updated post (with maps).
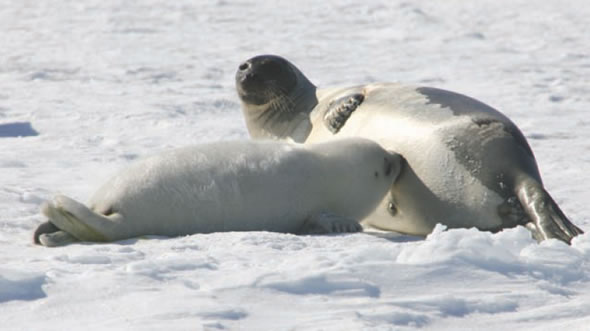
Harp seal female with nursing pup, DFO Canada.
Ice maps and graphs below: it’s worth a look.
From the Canadian Ice Service: today’s ice map
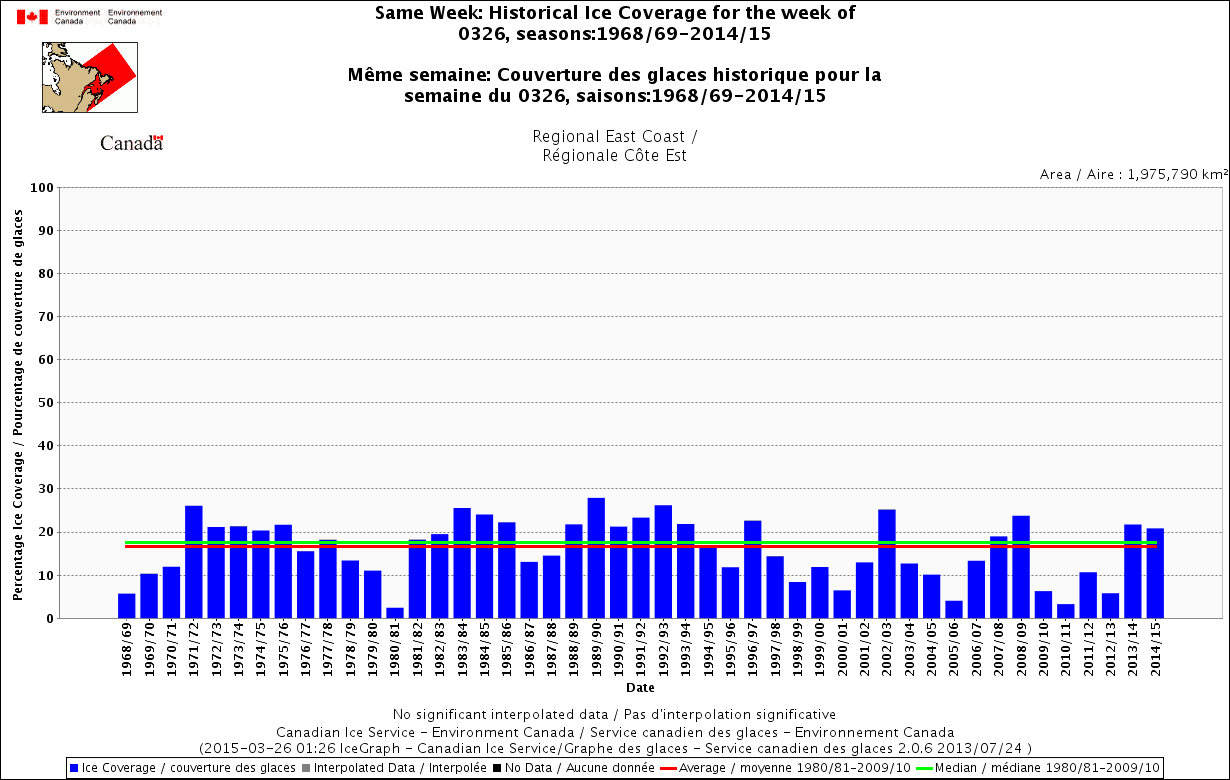
Same-week historical graphs, ice coverage for the week of 26 March (1969-2015), Canadian East Coast (click to enlarge):
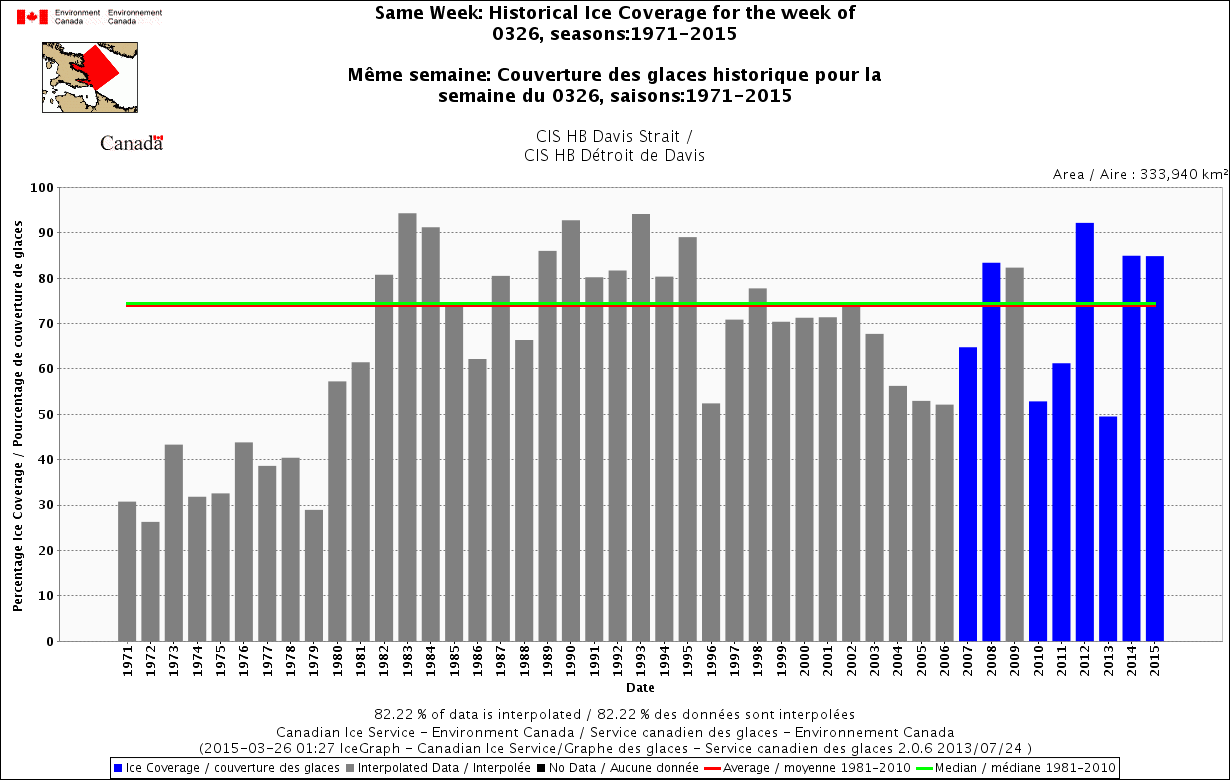
Same-week historical graphs, ice coverage for the week of 26 March (1971-2015), Davis Strait (click to enlarge):
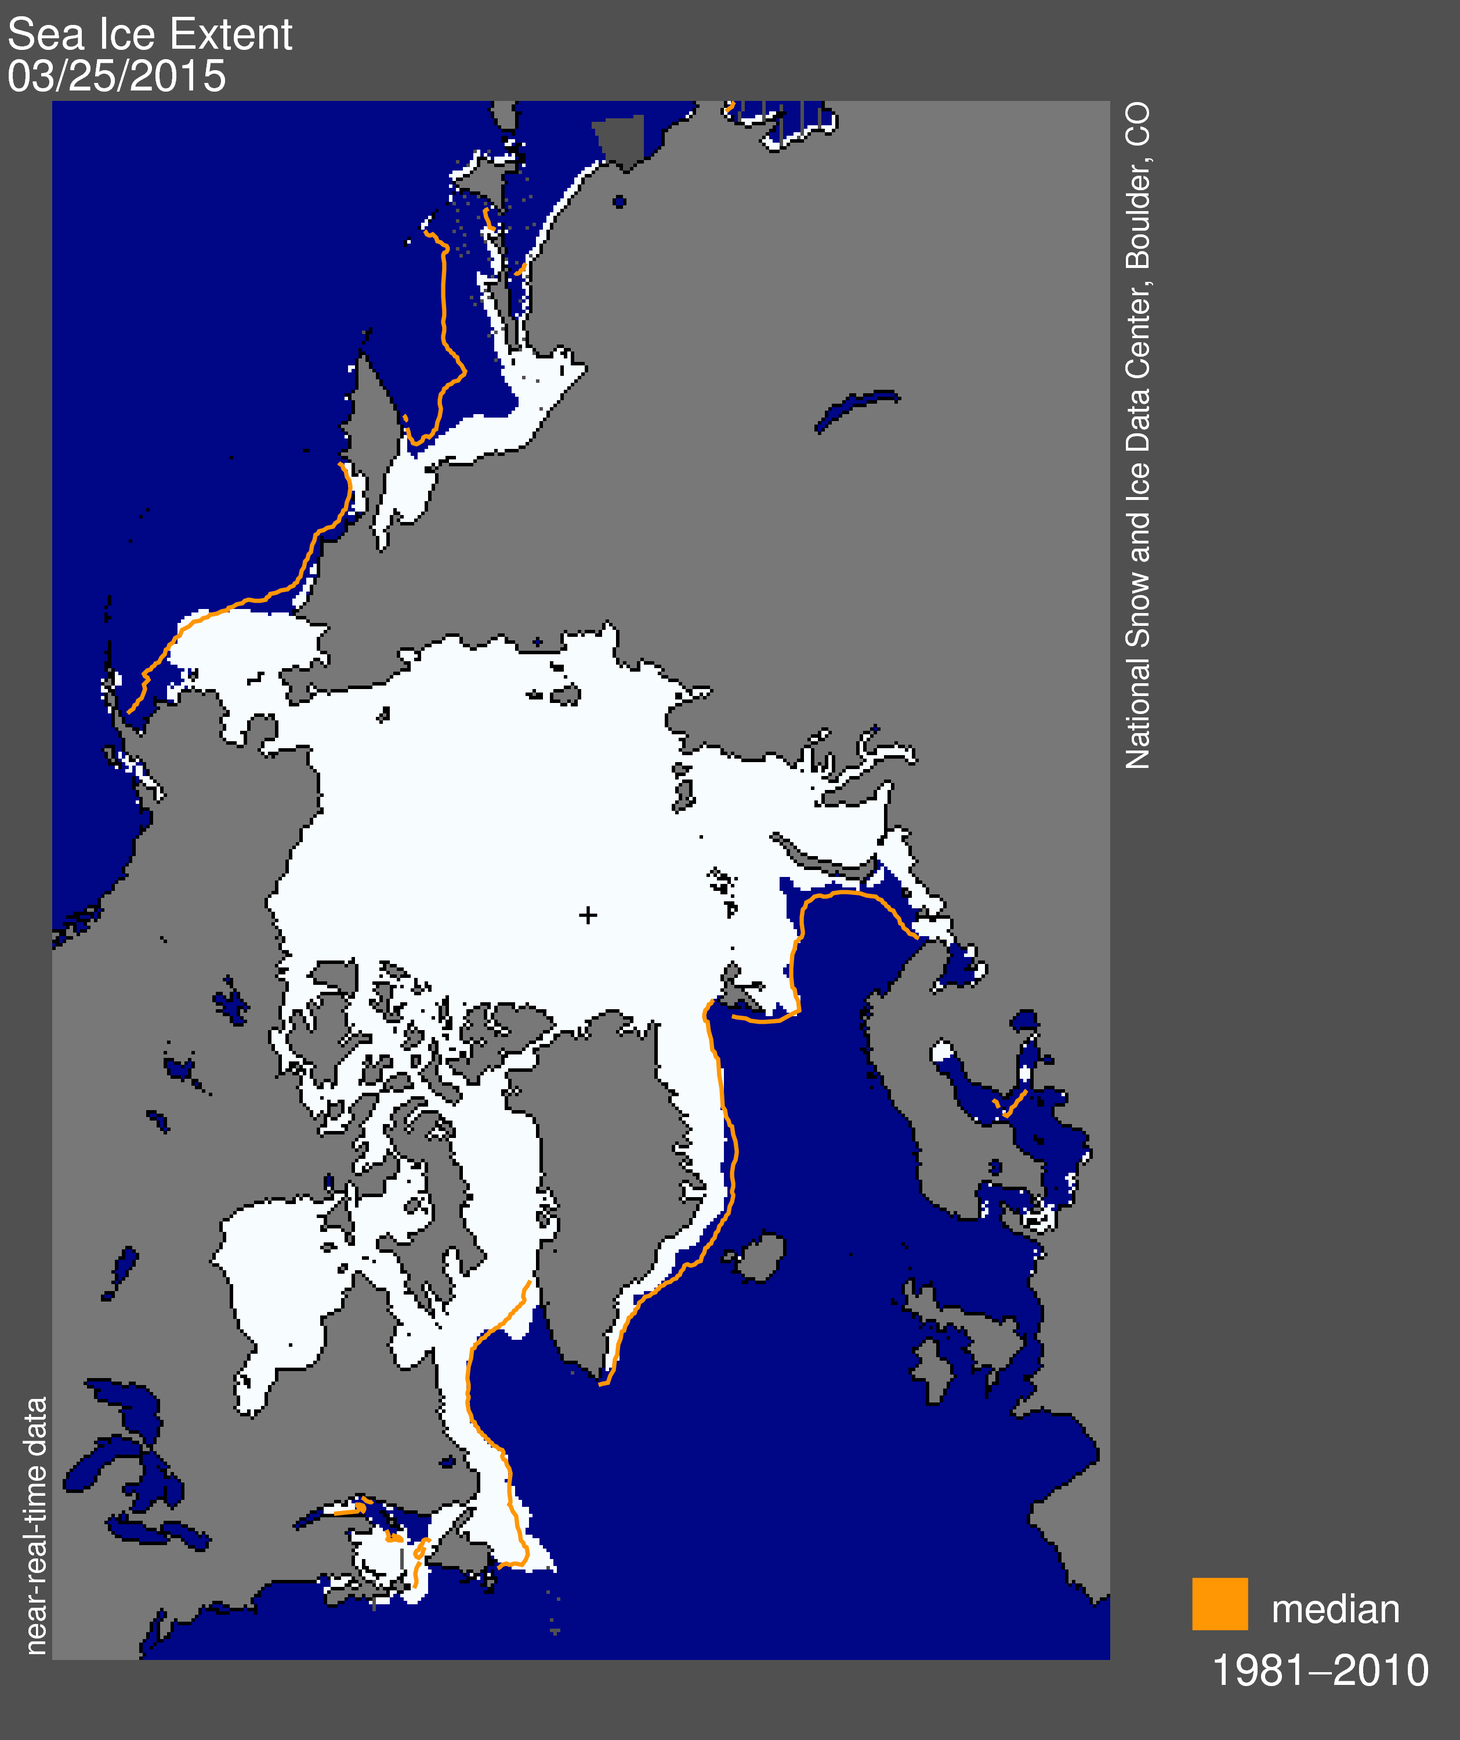
From the US National Snow and Ice Data Center (NSIDC), ice coverage for yesterday, 25 March (they have a one-day lag for their charts), with the long term average (click to enlarge):
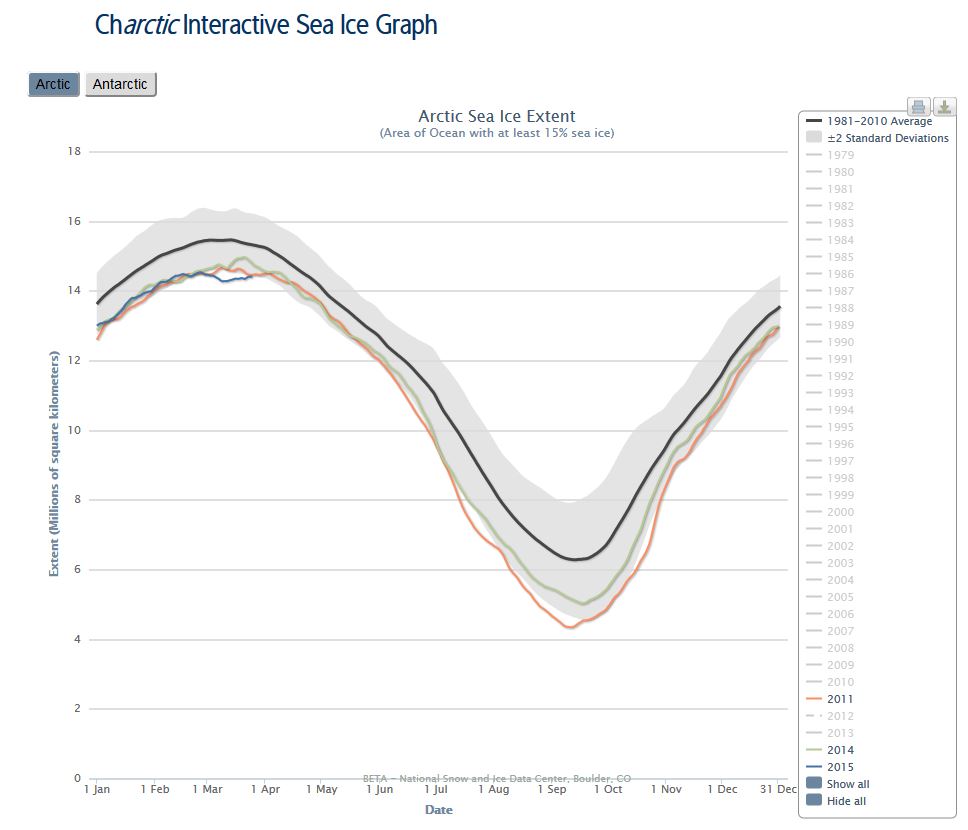
Also from NSIDC, the interactive ice extent graph provided for yesterday, 25 March vs. 2011 and 2014, with the long term average and 2 standard deviations marked (click to enlarge):
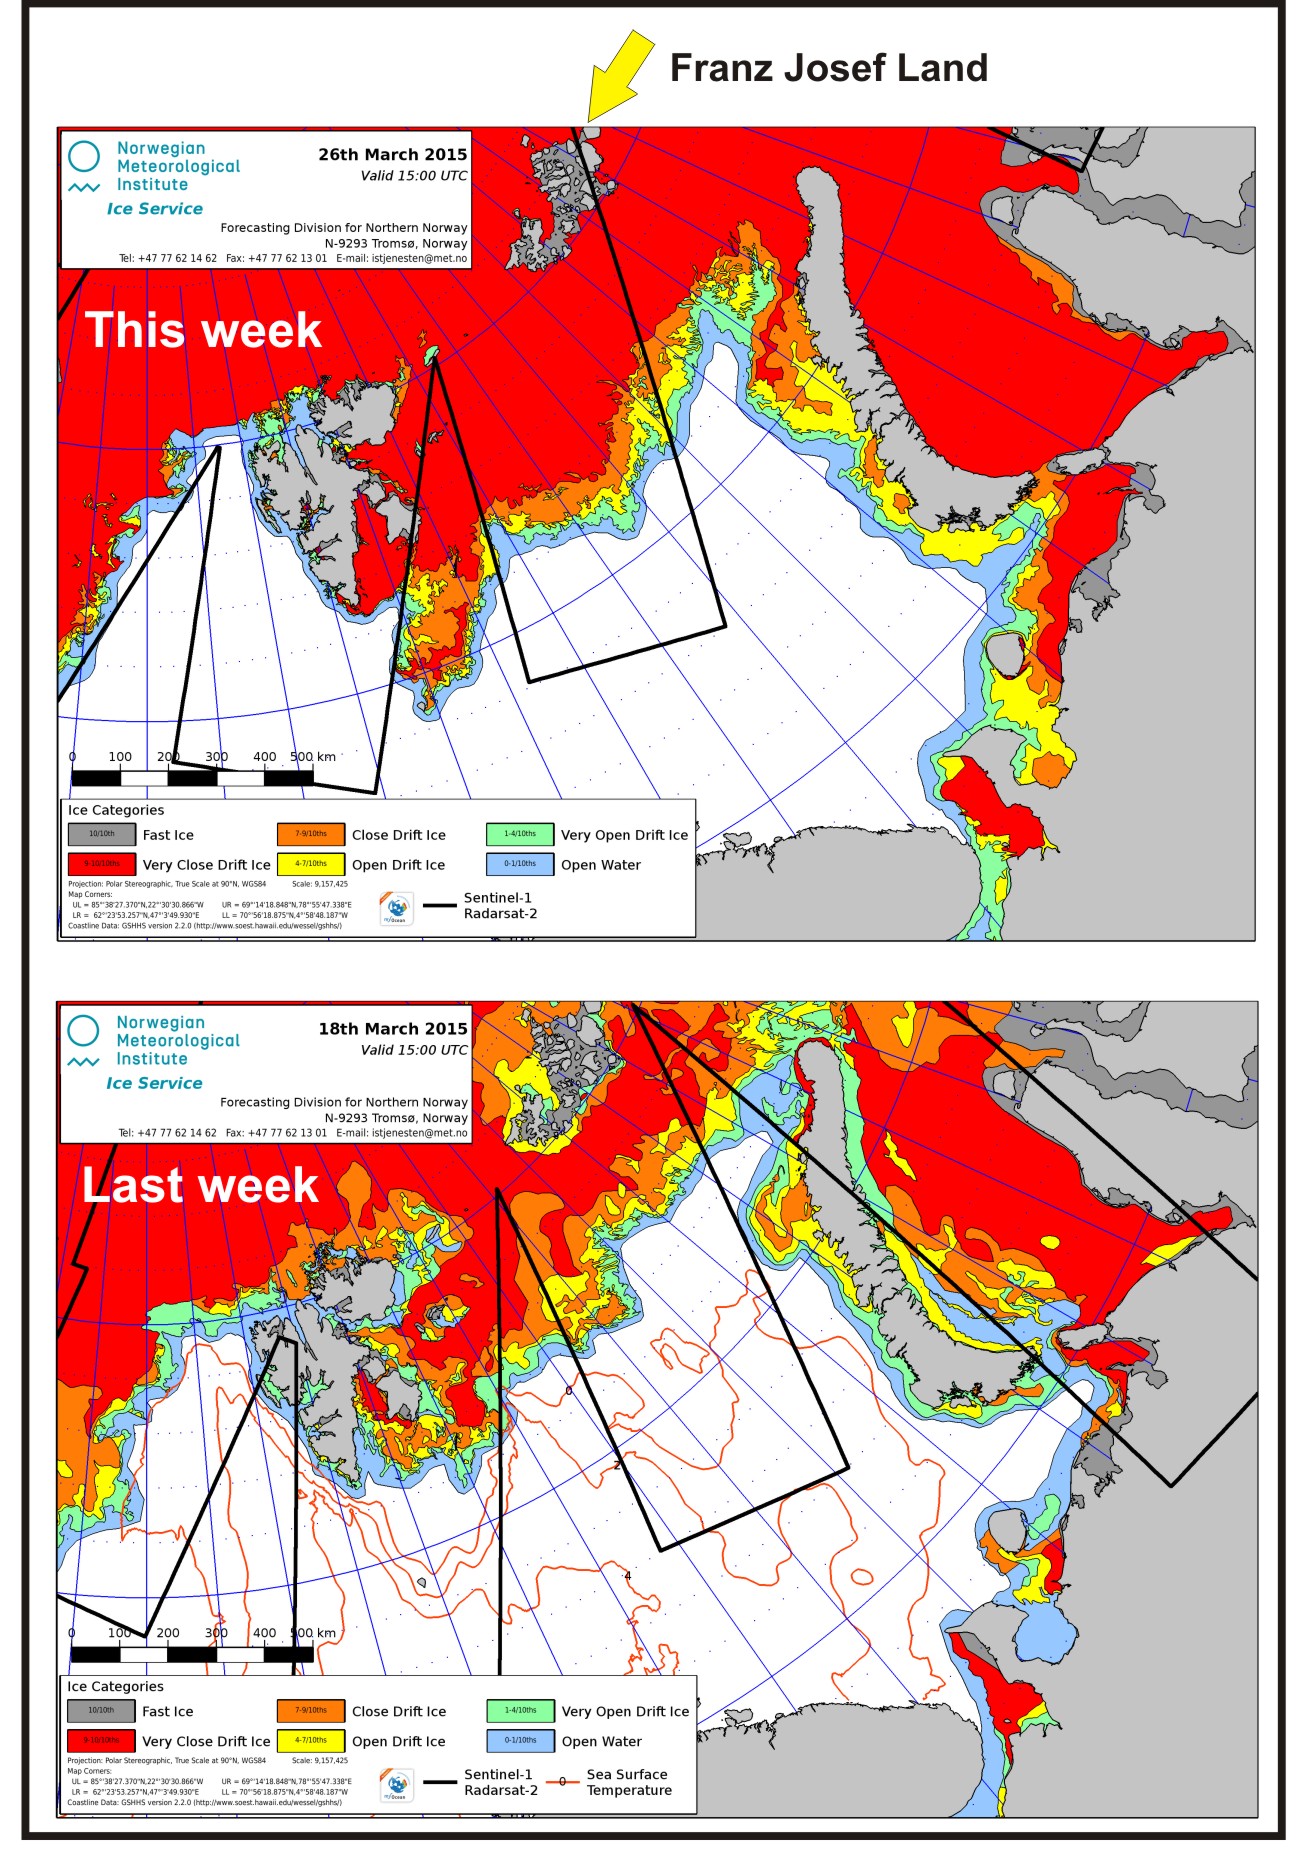
From the Norwegian Ice Service, ice coverage for today vs. last week (18 March), showing the increase in Barents Sea ice (my composite), below:
 It’s pretty clear why most Barents Sea polar bear females (Derocher 2005) make their dens on the northeast side of the Svalbard Archipelago (or further east, in Franz Josef Land): due to the natural, cyclical variation, there is often little ice on the west coast (see the map below from March 1985, ironically a year when ice in Eastern Canada was also above average). Sea ice is quite variable along the northwest coast and in the southeast portion of the archipelago.

Most of this sea ice variability in the Barents Sea (Wyatt and Curry 2014) is attributed to the cyclical Atlantic Multidecadal Oscillation (AMO), which is known to affect polar bear health, particularly when it affects the amount of ice in spring.
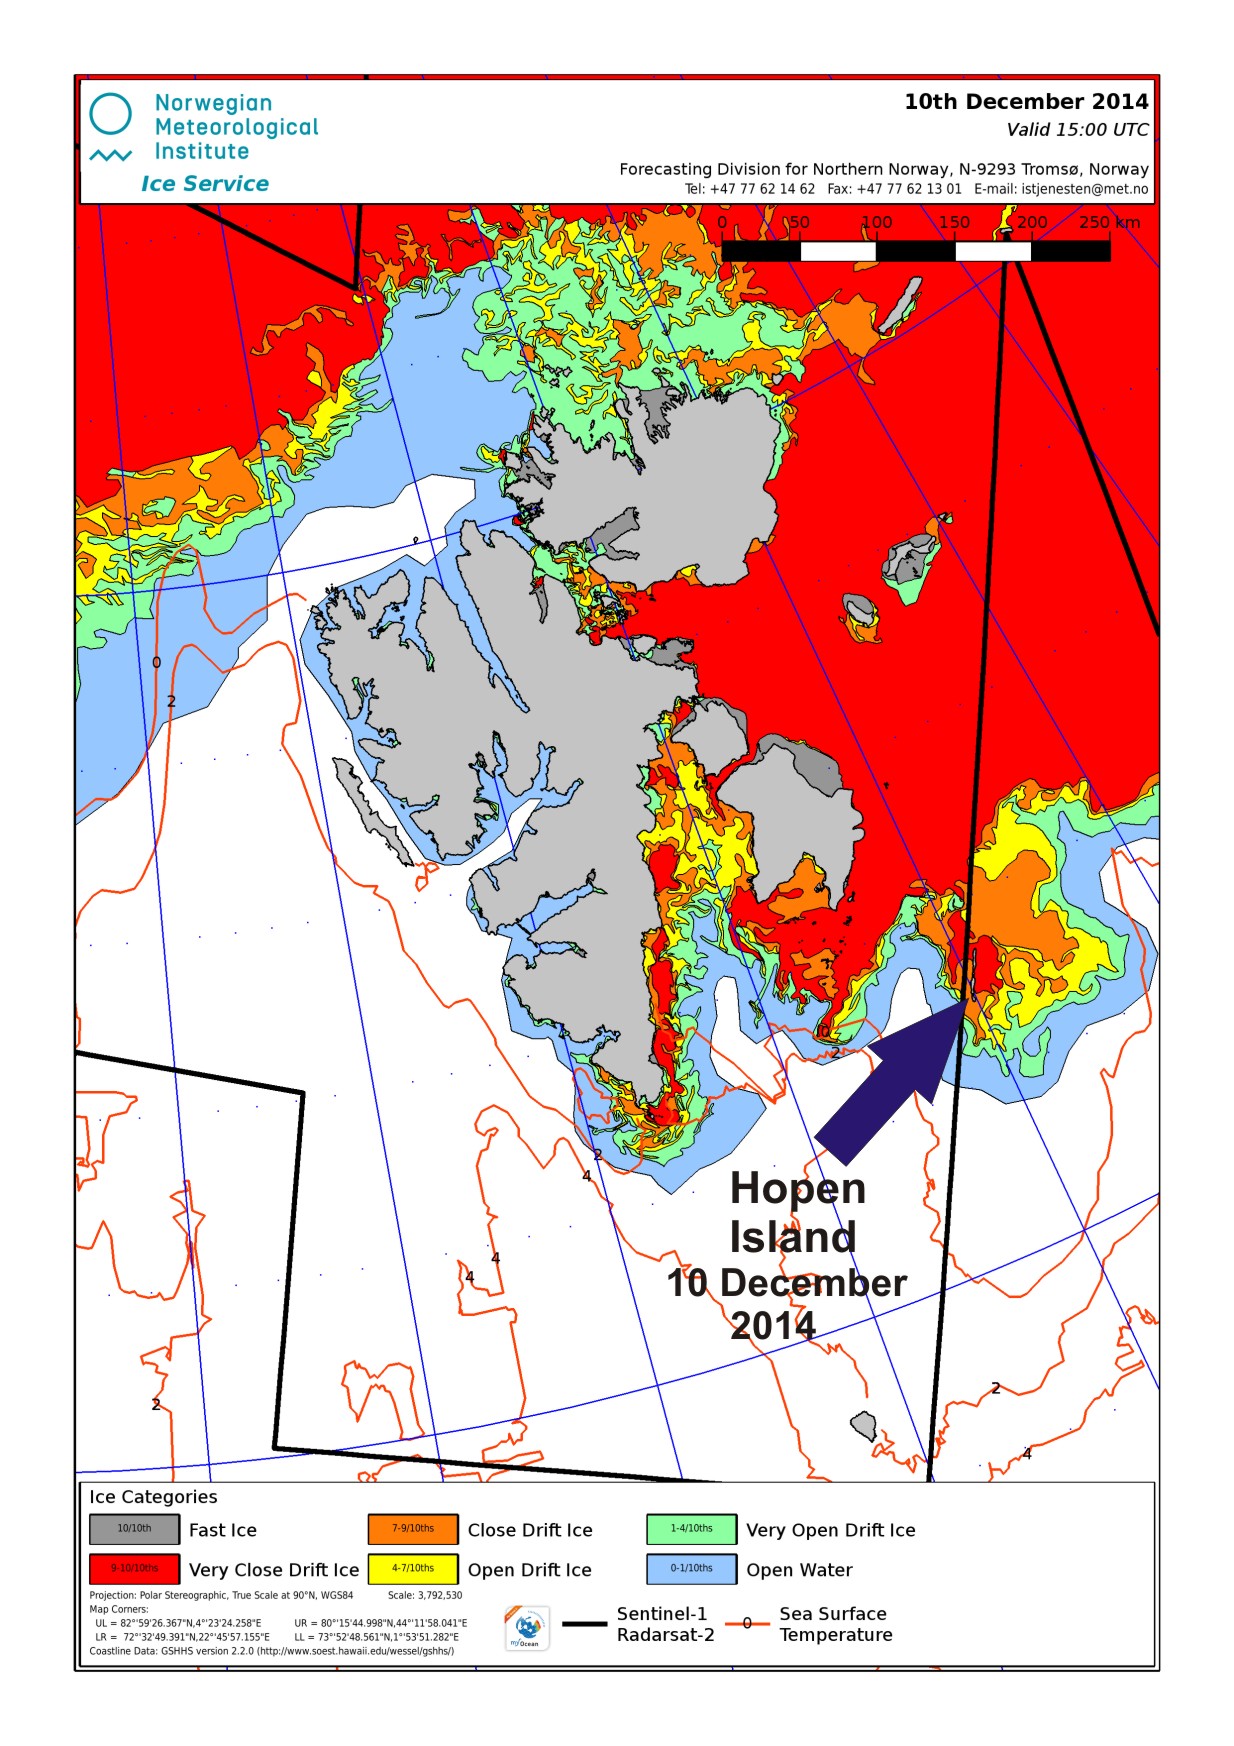
But polar bears do sometimes den in the southern portion, particularly on Hopen Island, depending on when the sea ice reaches it in the fall (Derocher et al., 2011). As you can see by the map below (with Hopen Island marked by me on the NIS chart), there was sea ice around Hopen Island by 10 December (2014) this winter – perhaps a little later than average (according to Derocher and colleagues), but not by much (see graph below the ice map).
 Graph below from Derocher et al. 2011 (click to enlarge), showing dates when sea ice reached Hopen Island in fall/winter (1978-2010):
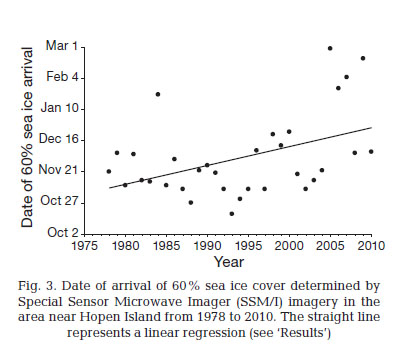
Graph from Derocher et al. (2011), showing yearly variation in date of sea ice coverage around Hopen Island, Svalbard, at the amount largely governs polar bear denning on the island.
References
Derocher 2005. Population ecology of polar bears at Svalbard, Norway. Population Ecology 47:267-275.
http://www.springerlink.com.ezproxy.library.uvic.ca/content/765147518rp35613/fulltext.pdf
Derocher, A.E., Anderson, M., Wiig, Ø., Aars, J., Hansen, E. and Biuw, M. 2011. Sea ice and polar bear den ecology at Hopen Island, Svalbard. Marine Ecology Progress Series 441: 273-279. Open Access. http://www.int-res.com/abstracts/meps/v441/p273-279/
Wyatt, M.G. and Curry, J.A. 2014. Role for Eurasian Arctic shelf sea ice in a secularly varying hemispheric climate signal during the 20th century. Climate Dynamics 42: 2763-2782. [paywalled, but see co-author blog post here, where author copy of paper is available]
Abstract: A hypothesized low-frequency climate signal propagating across the Northern Hemisphere through a network of synchronized climate indices was identified in previous analyses of instrumental and proxy data. The tempo of signal propagation is rationalized in terms of the multidecadal component of Atlantic Ocean variability – the Atlantic Multidecadal Oscillation. Through multivariate statistical analysis of an expanded database, we further investigate this hypothesized signal to elucidate propagation dynamics. The Eurasian Arctic Shelf-Sea Region, where sea ice is uniquely exposed to open ocean in the Northern Hemisphere, emerges as a strong contender for generating and sustaining propagation of the hemispheric signal. Ocean-ice-atmosphere coupling spawns a sequence of positive and negative feedbacks that convey persistence and quasi-oscillatory features to the signal. Further stabilizing the system are anomalies of co-varying Pacific-centered atmospheric circulations. Indirectly related to dynamics in the Eurasian Arctic, these anomalies appear to negatively feed back onto the Atlantic‘s freshwater balance. Earth’s rotational rate and other proxies encode traces of this signal as it makes its way across the Northern Hemisphere.


You must be logged in to post a comment.