
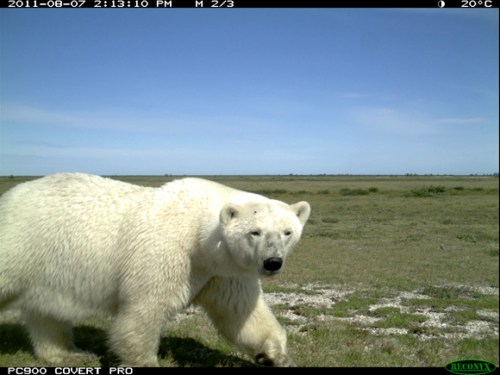
Western Hudson Bay bear, Wakusp National Park, August 2011.
In the just-published version of their Western Hudson Bay (WHB) population survey conducted in 2011, Nick Lunn and colleagues highlighted in the abstract:
“Our analysis suggested a long-term decline in the number of bears from 1,185 (993-1411) in 1987 to 806 (653-984) in 2011…”
But they didn’t mention that the 806 estimate for 2011 was based on only a portion of the WHB region (Fig. 1) and has not been accepted by their peers as a valid estimate of the population size. They also failed to mention that the decline occurred due to thick spring ice and/or unsuitable snow conditions for ringed seals between 1989 and 1992 (Fig. 2), which resulted in reduced availability of polar bear prey (as I discussed in detail in Crockford 2015).
They know the “long-term” population decline is what the media will grab onto and run with – rather than the next sentence, which says “In the last 10 years of the study, the number of bears appeared stable due to temporary stability in sea ice conditions.”
In other words, their study shows there has been no decline in the population since 2004, which had been predicted to occur (see previous post, Prediction #1), and there has been no trend in either breakup or freeze-up dates between 2001 and 2010 (or since). See previous post on the government report on which this paper is based here.
The bottom line is this: no one is buying this population estimate of 806 bears for the Western Hudson Bay population – both the IUCN Polar Bear Specialist Group and Environment Canada are using Seth Stapleton and colleagues (2014) estimate from their aerial survey done the same year and that official population size number is 1030 bears.
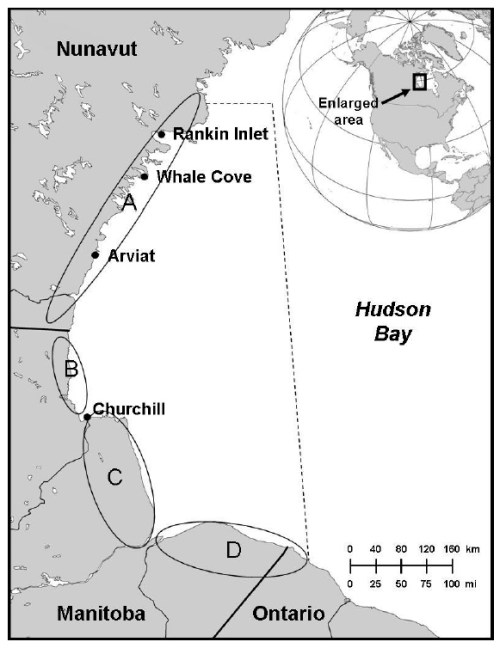
This study area map is Figure 1 from Lunn et al. 2016. The 2011 mark-recapture study (Lunn et al. 2013, 2014) did not include bears from Areas A or D, and only a few from Area B. The 2011 aerial survey (Stapleton et al. 2014) covered Areas A-D. This is why the estimate of 1030 from the aerial survey is considered the most accurate assessment.
The truth about this study appears on pg. 28-29 (I’ve removed the references for easier reading) – note the admission of habitat instability that I discussed at length in Crockford 2015):
“The Hudson Bay marine ecosystem has experienced physical and biological changes over the past 3-4 decades. As a possible response, our analysis indicated a decline in the size of the effective study population from 1,185 bears (95% BCI = 993-1,411) in 1987 to 806 bears (95% BCI = 653-984) in 2011. In the most recent decade of our study (2001-2010), the matrix-based growth rate for the total WH subpopulation was 1.01 (95% BCI = 0.98-1.05), suggesting a period of population stability associated with stability in sea-ice conditions that influence female survival rates. In the preceding decade, 1991-2000, the population appeared to be declining with a growth rate of 0.97 (95% BCI = 0.95-1.00).
…Reduced production, survival, and recruitment of ringed seals in the 1990s were thought to be due to less favorable environmental conditions. [in other words, not earlier breakup or late freeze-up dates] … Thus, the decline in size of the WH polar bear subpopulation through the 1990s may reflect poor reproductive performance of ringed seals during the same period.“ [my bold]
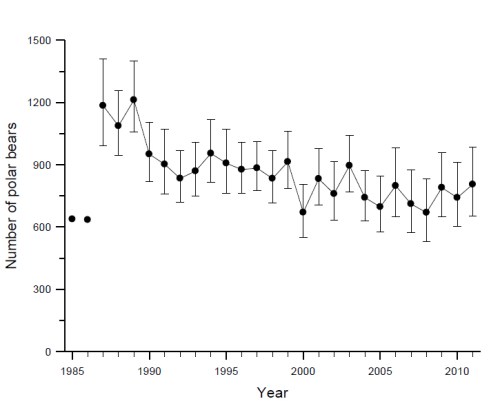
Figure 2. This is Fig. 6 from Lunn et al. 2016 and shows polar bear population estimates for Western Hudson Bay between 1984 & 2011. It shows plainly that the largest decline occurred between 1989 and 1992 (when ice conditions were poor for ringed seals, as discussed in Crockford 2015, not due to early breakup) but with no declining trend since 2004.
Polar bear biologists have become masters of propaganda and media manipulation but their desperation is now apparent to all but the most gullible. If their case was truly strong and true, misrepresenting the data wouldn’t be necessary (see a fine example below).
University of Alberta’s Andrew Derocher was not a co-author of this study but have a look at the tweet he published – The World Wildlife Fund couldn’t have done it better:
“New paper on W. Hudson Bay #polarbear abundance: almost 400 bears fewer in 2011 vs. 1987. Less ice ==> fewer bears.“
References
Crockford, S.J. 2015. “The Arctic Fallacy: sea ice stability and the polar bear.” GWPF Briefing 16. The Global Warming Policy Foundation, London. Pdf here.
Lunn, N.J., Servanty, S., Regehr, E.V., Converse, S.J., Richardson, E. and Stirling, I. 2014. Demography and population assessment of polar bears in Western Hudson Bay, Canada. Environment Canada Research Report. July 2014. PDF HERE [This appears to be the version submitted for publication]
Lunn, N.J., Servanty, S., Regehr, E.V., Converse, S.J., Richardson, E. and Stirling, I. 2016. Demography of an apex predator at the edge of its range – impacts of changing sea ice on polar bears in Hudson Bay. Ecological Applications, in press. DOI: 10.1890/15-1256
Stapleton S., Atkinson, S., Hedman, D., and Garshelis, D. 2014. Revisiting Western Hudson Bay: using aerial surveys to update polar bear abundance in a sentinel population. Biological Conservation 170:38-47. http://www.sciencedirect.com/science/article/pii/S0006320713004618#


You must be logged in to post a comment.