
Polar bear populations in most of the Canadian Arctic Archipelago (CAA) must be booming, as they are elsewhere. That’s because the ‘experts’ were even more wrong in their predictions of future sea ice conditions than most people realize: they expected the CAA would remain choked with ice during a ‘nearly ice-free’ summer driven by human-caused global warming.
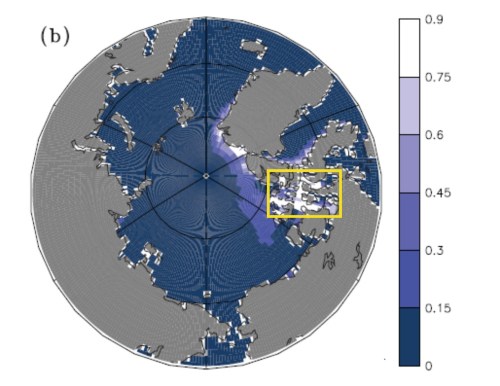
Map presented by Wang and Overland (2012: Fig 3) shows what these experts thought a ‘nearly ice-free’ summer would look like, which they expected to occur by 2030 or so.
Look at the map from Wang and Overland (2012) above, which is what they thought a ‘nearly ice-free’ summer would look like in the year 2030 or so.
Wang and Overland used the same models used by USGS biologists to predict the future survival of polar bears based on habitat loss (Amstrup et al. 2007; Atwood et al. 2016; Durner et al. 2007, 2009). Note the thick ice in the CAA — what USGS experts call the ‘Archipelago’ sea ice ecoregion (denoted by white in the map), indicating ice about 1 metre thick (2-3 feet) — expected to remain at the height of summer in 2030.
[Earlier renditions of sea ice projections (e.g. ACIA 2005) show something similar. The second update of the ACIA released just yesterday (AMAP 2017, described here by the CBC) has prudently included no such firm predictions in their Summary for Policy Makers, just dire warnings of future catastrophe. But see the 2012 update.]
The problem is that ice in this region has been largely absent most summers since 2006, even though overall ice extent has been much more extensive than expected for a ‘nearly ice-free’ summer, as I show below.
This is not another “worse than we thought” moment (Amstrup et al. 2007) — this is sea ice models so wrong as to be useless: failed models used to inform future polar bear survival models that got the bears declared ‘threatened’ with extinction in the US in 2008 (Crockford 2017).
It also means polar bears are almost certainly doing much better than recent population counts indicate, since only one subpopulation out of the six in the CAA has recently been assessed. But since polar bear specialists have consistently underestimated the adaptability of this species and the resilience of the Arctic ecosystem to respond to changing conditions, it’s hard to take any of their hyperbole about the future of polar bears seriously.
As I’ve already shown, polar bears are currently thriving in regions where sea ice dropped abruptly in 2007 (a phenomenon not predicted to occur until 2050) — all of the subpopulations in purple and green in the map below, which were predicted to be extirpated by such ice conditions (Crockford 2017; Polar Bear Scare Unmasked 2017, below).
But they are almost certainly thriving in most areas of the CAA as well (‘Archipelago’ areas in gold below). This is because the ice has changed from primarily multiyear ice in winter to first year ice in most of the Archipelago region — much sooner than expected (in the 1970s to mid-1990s, thick winter ice in the CAA limited the density of bears and ringed seals).
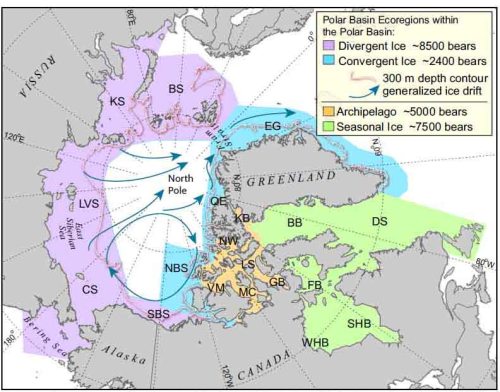
The ecoregion map above indicates about 5000 bears were thought to live in the Archipelago ecoregion in 2005 (Amstrup et al. 2007): that number had almost certainly increased markedly by 2015, although we only have data from Kane Basin so far — whose population more than doubled even though bears went from having ice all summer long (>50% ice covered) in the 1990s to a period of being virtually ice-free (<5% ice covered) for a month (SWG 2016:447, 464).
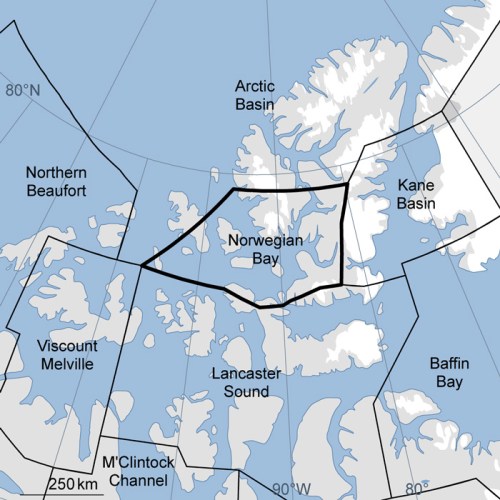
Polar bear subpopulations of the northern CAA ‘Archipelago’ ecoregion: Kane Basin, Norwegian Bay, Viscount Melville, & Lancaster Sound (Baffin Bay is considered ‘Seasonal’ while N. Beaufort & Arctic Basin are ‘Convergent’)
In Kane Basin, the recent survey (SWG 2016)1 showed the population estimate increased 118% (from about 164 in the 1990s to 357 bears in 2013), but it must be going on in other subpopulations of the CAA, where sea ice has also changed from largely multiyear ice in winter to first year ice that melts every summer:
…sea ice in the Kane Basin region has become less consolidated and now resembles that of the annual sea-ice ecoregion. (SWG 2016:49)
The reality of what sea ice is doing (observations) vs. the predictions made by ‘experts’ (model outputs based on General Circulation Models skewed by input of “human-generated” CO2) impact not just polar bears but ringed seals, which are also listed in the US as threatened with extinction due to predicted habitat loss (USFWS 2008, 2012a).
The loss of most multiyear ice in the summer since 1998 (see the ice maps below) means that winter ice in much of the CAA has been largely first year ice for more than a decade.
First year ice over shallow water is overall the best habitat for polar bears because it is the best habitat for ringed seals in the winter and spring. The multiyear ice that dominated the CAA during the 1970s and 1980s kept densities of ringed and bearded seals low, which meant that polar bear populations were also low (except in Lancaster Sound and the Gulf of Boothia, see table below):
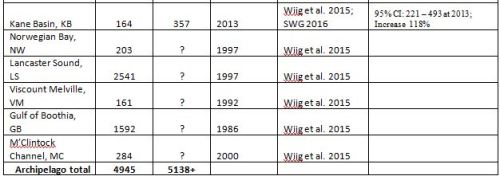
Polar bear numbers in M’Clintock Channel are likely to have changed by the largest percentage (like Kane Basin), while Gulf of Boothia and Lancaster Sound have probably changed much less (note that a survey of Gulf of Boothia is planned for this summer).
Summer ice cover in Viscount Melville has been light to non-existent some years but heavy in others, suggesting population increases in those area was likely moderate or variable. However, multiyear ice has been persistent in Norwegian Bay and polar bear populations there have likely remained stable or declined due to bears moving to neighbouring regions with better ice conditions.
Still, the overall trend for this region is almost certainly increasing since the late 1990s, since it’s clear now that all polar bears are capable of enduring a 2-5 month summer fast if they have fed sufficiently in early spring (Crockford 2017).
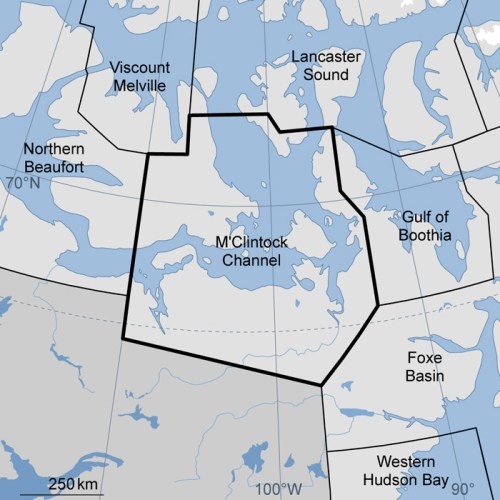
Polar Bear subpopulations of the southern CAA ‘Archipelago sea ice ecoregion: M’Clintock Channel & Gulf of Boothia (N. Beaufort is considered ‘Convergent’ & Foxe Basin is ‘Seasonal’)
CAA ice cover since 1998
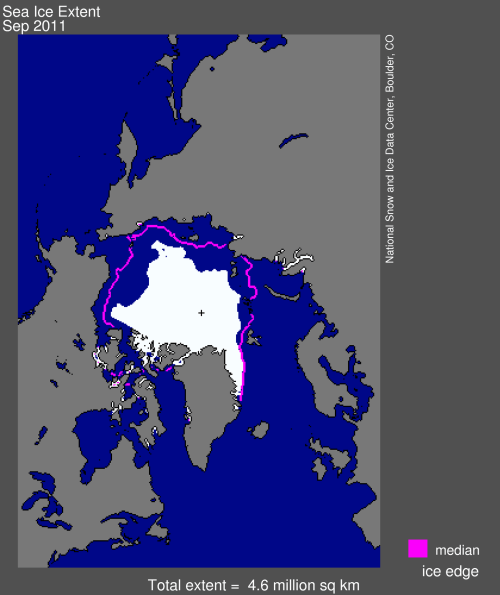
As the graph and ice charts below for representative years of 2007, 2012 and 2015 show, there has been little or no ice in the southern CAA in September (the annual minimum) since total ice extent abruptly dropped in 2007.
In a few years, there’s been no ice in the northern CAA as well (most recently 2012). Charts that continue on below, show other years — so that you can see I am not cherry-picking particular years. You’ll see that Kane Basin has been ice-free in summer most years since 2006, supporting a population that has more than doubled in size since the mid-1990s.
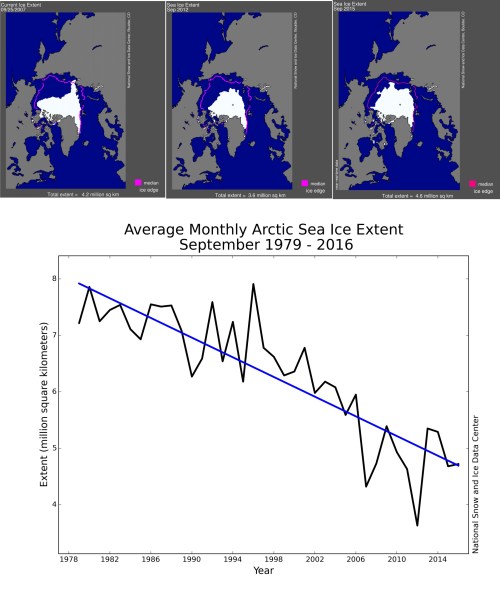
As the ice charts below show, most years since 2006 there was little to no ice in the southern CAA and in some years even the northern CAA was ice-free.
2016, a moderately high ice year in the northwestern CAA but an ice-free summer for Kane Basin

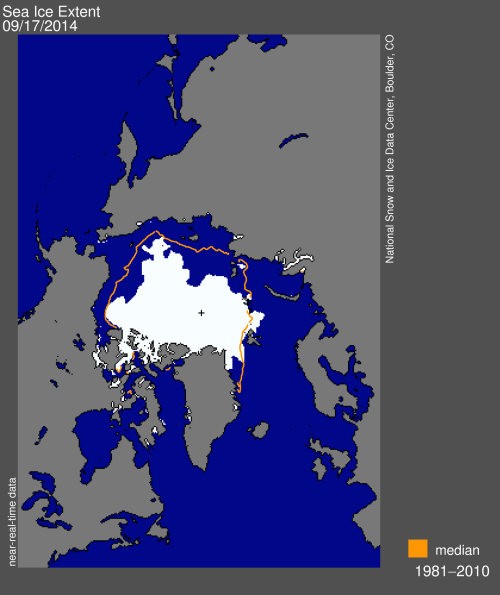
2014, a high ice year in the western CAA but largely ice-free in the east:
2013, a high ice year in the northwestern CAA

2011, only ice in the northern CAA (Norwegian Bay, and northern reaches of Viscount Melville and Lancaster Sound):
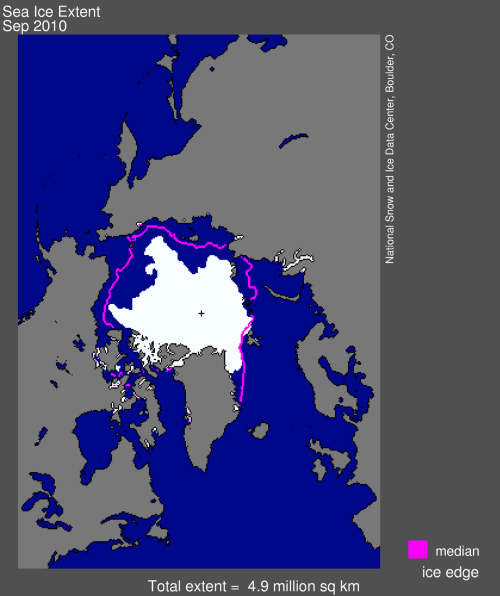
2010, only ice in the northern CAA (Norwegian Bay, and northern reaches of Viscount Melville and Lancaster Sound):
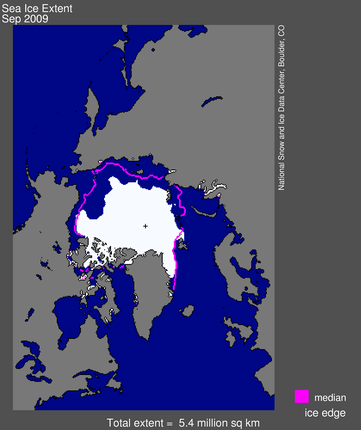
2009, a high ice year in the northwestern CAA (only low resolution image available)
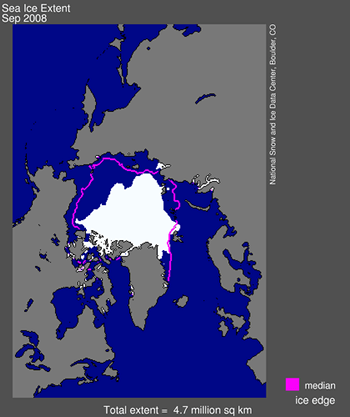
2008, a moderately low ice year in the northwestern CAA (ice in Norwegian Bay and Viscount Melville and northern reaches of Lancaster Sound), only low resolution image available:
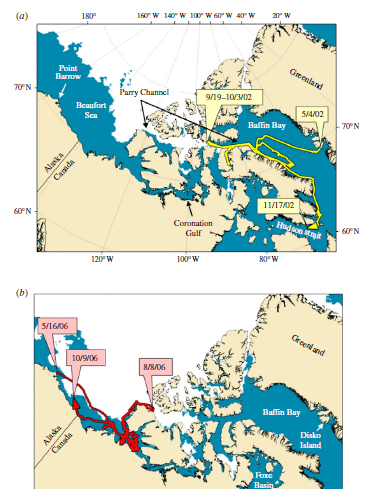
And as this map of bowhead whales fitted with tracking devices shows (from Heide-Jorgensen et al. 2012), even in 2002 (upper panel) and 2006 (lower panel) there was little or no ice in the southern and eastern CAA, including Kane Basin, M’Clintock Channel, and most of Gulf of Boothia and Lancaster Sound.
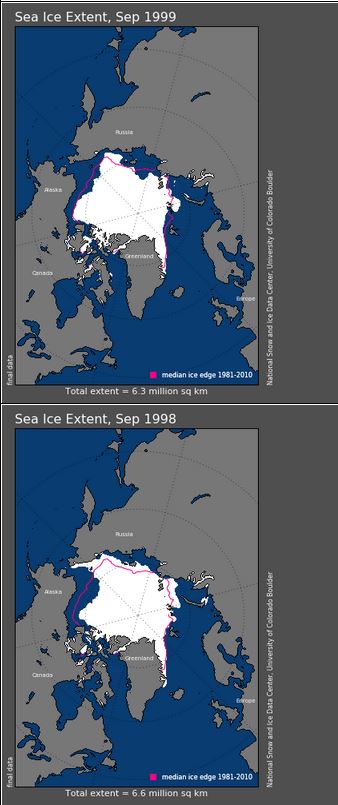
Surprisingly, as early as 1998 and 1999 (after most polar bear population estimates had been done in the CAA), there was ice only in the western half of the northern CAA in September (only low resolution images available), even though the total extent was above 6 mkm2.
New Projections
Too late to be of any use to USGS biologists in their support of a ‘threatened’ finding for polar bears (Amstrup et al. 2007), one group of researchers has at least admitted that sea ice in the CAA has not behaved as predicted by general Arctic sea ice models. Hamilton and colleagues (2014, see their Fig. 1 below) predict that the entire CAA will be largely ice-free by 2100, using the ‘worst-case’ scenario for global warming forcing of their sea ice models (i.e., RCP8.5, which predicts a rise in mean global temperature of about 3.50C by 2071-2100).
This would mean that polar bears in this region would face 2-5 months of ice-free conditions in summer, similar to what bears in other Arctic regions do today — a result they of course predict will be catastrophic, despite the fact that polar bears in virtually all other regions of the Arctic currently survive such conditions year after year.

The authors conclude, with typical hyperbole:
“Without exception, our simulation projects the sea ice habitat in all polar bear populations of the CAA may change from a multiyear to an annual ice system before the end of the century, and the remaining annual ice might not persist sufficiently long each year to allow hunting opportunities for polar bears as we currently understand them.
…
Under business-as-usual climate projections, polar bears may face starvation and reproductive failure across the entire Archipelago by the year 2100.”
This bizarrely pessimistic analysis of the future of CAA sea ice was included in the Stern and Laidre (2016) sea ice projections used by the IUCN Polar Bear Specialist Group (PBSG) to construct their 2015 polar bear survival model (which concluded there is a 70% chance that polar bear numbers will decline by >30% or more by 2050, just about the bare minimum threshold permitted to maintain a status of ‘vulnerable’).
But as we’ve seen, polar bear specialists have consistently underestimated the adaptability of this species and the resilience of the Arctic ecosystem to respond to changing conditions.
They predicted ringed seals would suffer greatly with a longer-than-usual ice-free period and instead, they prospered.
They predicted Chukchi Sea bears would suffer greatly if their 1-month ice-free season became a 2-month season, but the bears thrived.
They predicted bear numbers in Southern and Western Hudson Bay regions would decline rapidly with declining Arctic ice: but the ice in Hudson Bay did not decline in step with Arctic Basin ice and bear numbers remained stable.
Quite simply, it’s impossible (for me) to take any of their predictions seriously because they’ve been consistently wrong since they began the game. You decide for yourself.
Footnotes
- Mitch Taylor (personal communication) has issues with several critical methods used in the SWG 2016 study that impact the veracity of the conclusions and population size estimates. But for the moment, I’m accepting the population size estimates as presented.
References
ACIA 2005. Arctic Climate Impact Assessment: Scientific Report. Cambridge University Press. See their graphics package of sea ice projections here.
AMAP 2017. [ACIA 2005 update]. Snow, Water, Ice, and Permafrost in the Arctic Summary for Policy Makers (Second Impact Assessment). Arctic Monitoring and Assessment Programme, Oslo. pdf here.
Amstrup, S.C., Marcot, B.G. & Douglas, D.C. 2007. Forecasting the rangewide status of polar bears at selected times in the 21st century. US Geological Survey. Reston, Virginia. pdf here.
Atwood, T.C., Marcot, B.G., Douglas, D.C., Amstrup, S.C., Rode, K.D., Durner, G.M. et al. 2016. Forecasting the relative influence of environmental and anthropogenic stressors on polar bears. Ecosphere 7(6): e01370.
Crockford, S.J. 2017 V3. Testing the hypothesis that routine sea ice coverage of 3-5 mkm2 results in a greater than 30% decline in population size of polar bears (Ursus maritimus). PeerJ Preprints 2 March 2017. Doi: 10.7287/peerj.preprints.2737v3 Open access. https://doi.org/10.7287/peerj.preprints.2737v3 pdf here.
Durner, G.M., Douglas, D.C., Nielson, R.M., Amstrup, S.C. & McDonald, T.L. 2007. Predicting 21st-century polar bear habitat distribution from global climate models. US Geological Survey. Reston, Virginia.
Durner, G.M., Douglas, D.C., Nielson, R.M., Amstrup, S.C., McDonald, T.L., et al. 2009. Predicting 21st-century polar bear habitat distribution from global climate models. Ecology Monographs 79: 25–58.
Hamilton, S.G., Castro de la Guardia, L., Derocher, A.E., Sahanatien, V.,
Tremblay, B. and Huard, D. 2014. Projected polar bear sea ice habitat in the Canadian Arctic Archipelago. PLoS One 9(11):e113746.
Heide-Jorgensen, M.P., Laidre, K.L., Quakenbush, L.T. and Citta, J.J. 2012. The Northwest Passage opens for bowhead whales. Biology Letters 8(2):270-273. doi:10.1098/rsbl.2011.0731
Stern, H.L. and Laidre, K.L. 2016. Sea-ice indicators of polar bear habitat. Cryosphere 10: 2027-2041.
SWG [Scientific Working Group to the Canada-Greenland Joint Commission on Polar Bear]. 2016. Re-Assessment of the Baffin Bay and Kane Basin Polar Bear Subpopulations: Final Report to the Canada-Greenland Joint Commission on Polar Bear. Available from http://www.gov.nu.ca/documents-publications/349 [accessed 15 February 2017]
US Fish and Wildlife Service (USFWS). 2008. Determination of threatened status for the polar bear (Ursus maritimus) throughout its range. Federal Register 73: 28212-28303.
US Fish and Wildlife Service (USFWS). 2012a. Threatened status for the Arctic, Okhotsk and Baltic subspecies of the ringed seal. Federal Register 77: 76706–76738.
Wang, M. and Overland, J. E. 2012. A sea ice free summer Arctic within 30 years: An update from CMIP5 models. Geophysical Research Letters 39: L18501. doi:10.1029/2012GL052868


You must be logged in to post a comment.