
The average sea ice cover at the end of March is the metric used to compare ‘winter’ ice to previous years or decades, not the single-day date of ‘most’ ice. This year, March ended with 14.6 mkm2 of sea ice, most of which (but not all) is critical polar bear habitat. Ice charts showing this are below.
But note that ice over Hudson Bay, which is an almost-enclosed sea used by thousands of polar bears at this time of year, tends to continue to thicken from March into May: these two charts for 2020 show medium green becoming dark green, indicating ice >1.2 m thick, even as some areas of open water appear.


Sea ice coverage at March 31 2022
Ice extent, via NSIDC

2022 compared to previous years, below:

To keep the above graph in perspective (which because of the scale looks like a huge decline), see the graph below showing extent for March vs. September to 2021

Ice concentration (>50%), via University Bremen

Canadian sea ice extent and thickness, via CIS
Overall
Western Canada, glossary for ice colour codes here

Hudson Bay

Eastern Canada

East Coast

Chukchi/Bering Sea, via Alaska Sea Ice Program


Barents/Greenland/Kara Seas, via Norwegian Ice Service
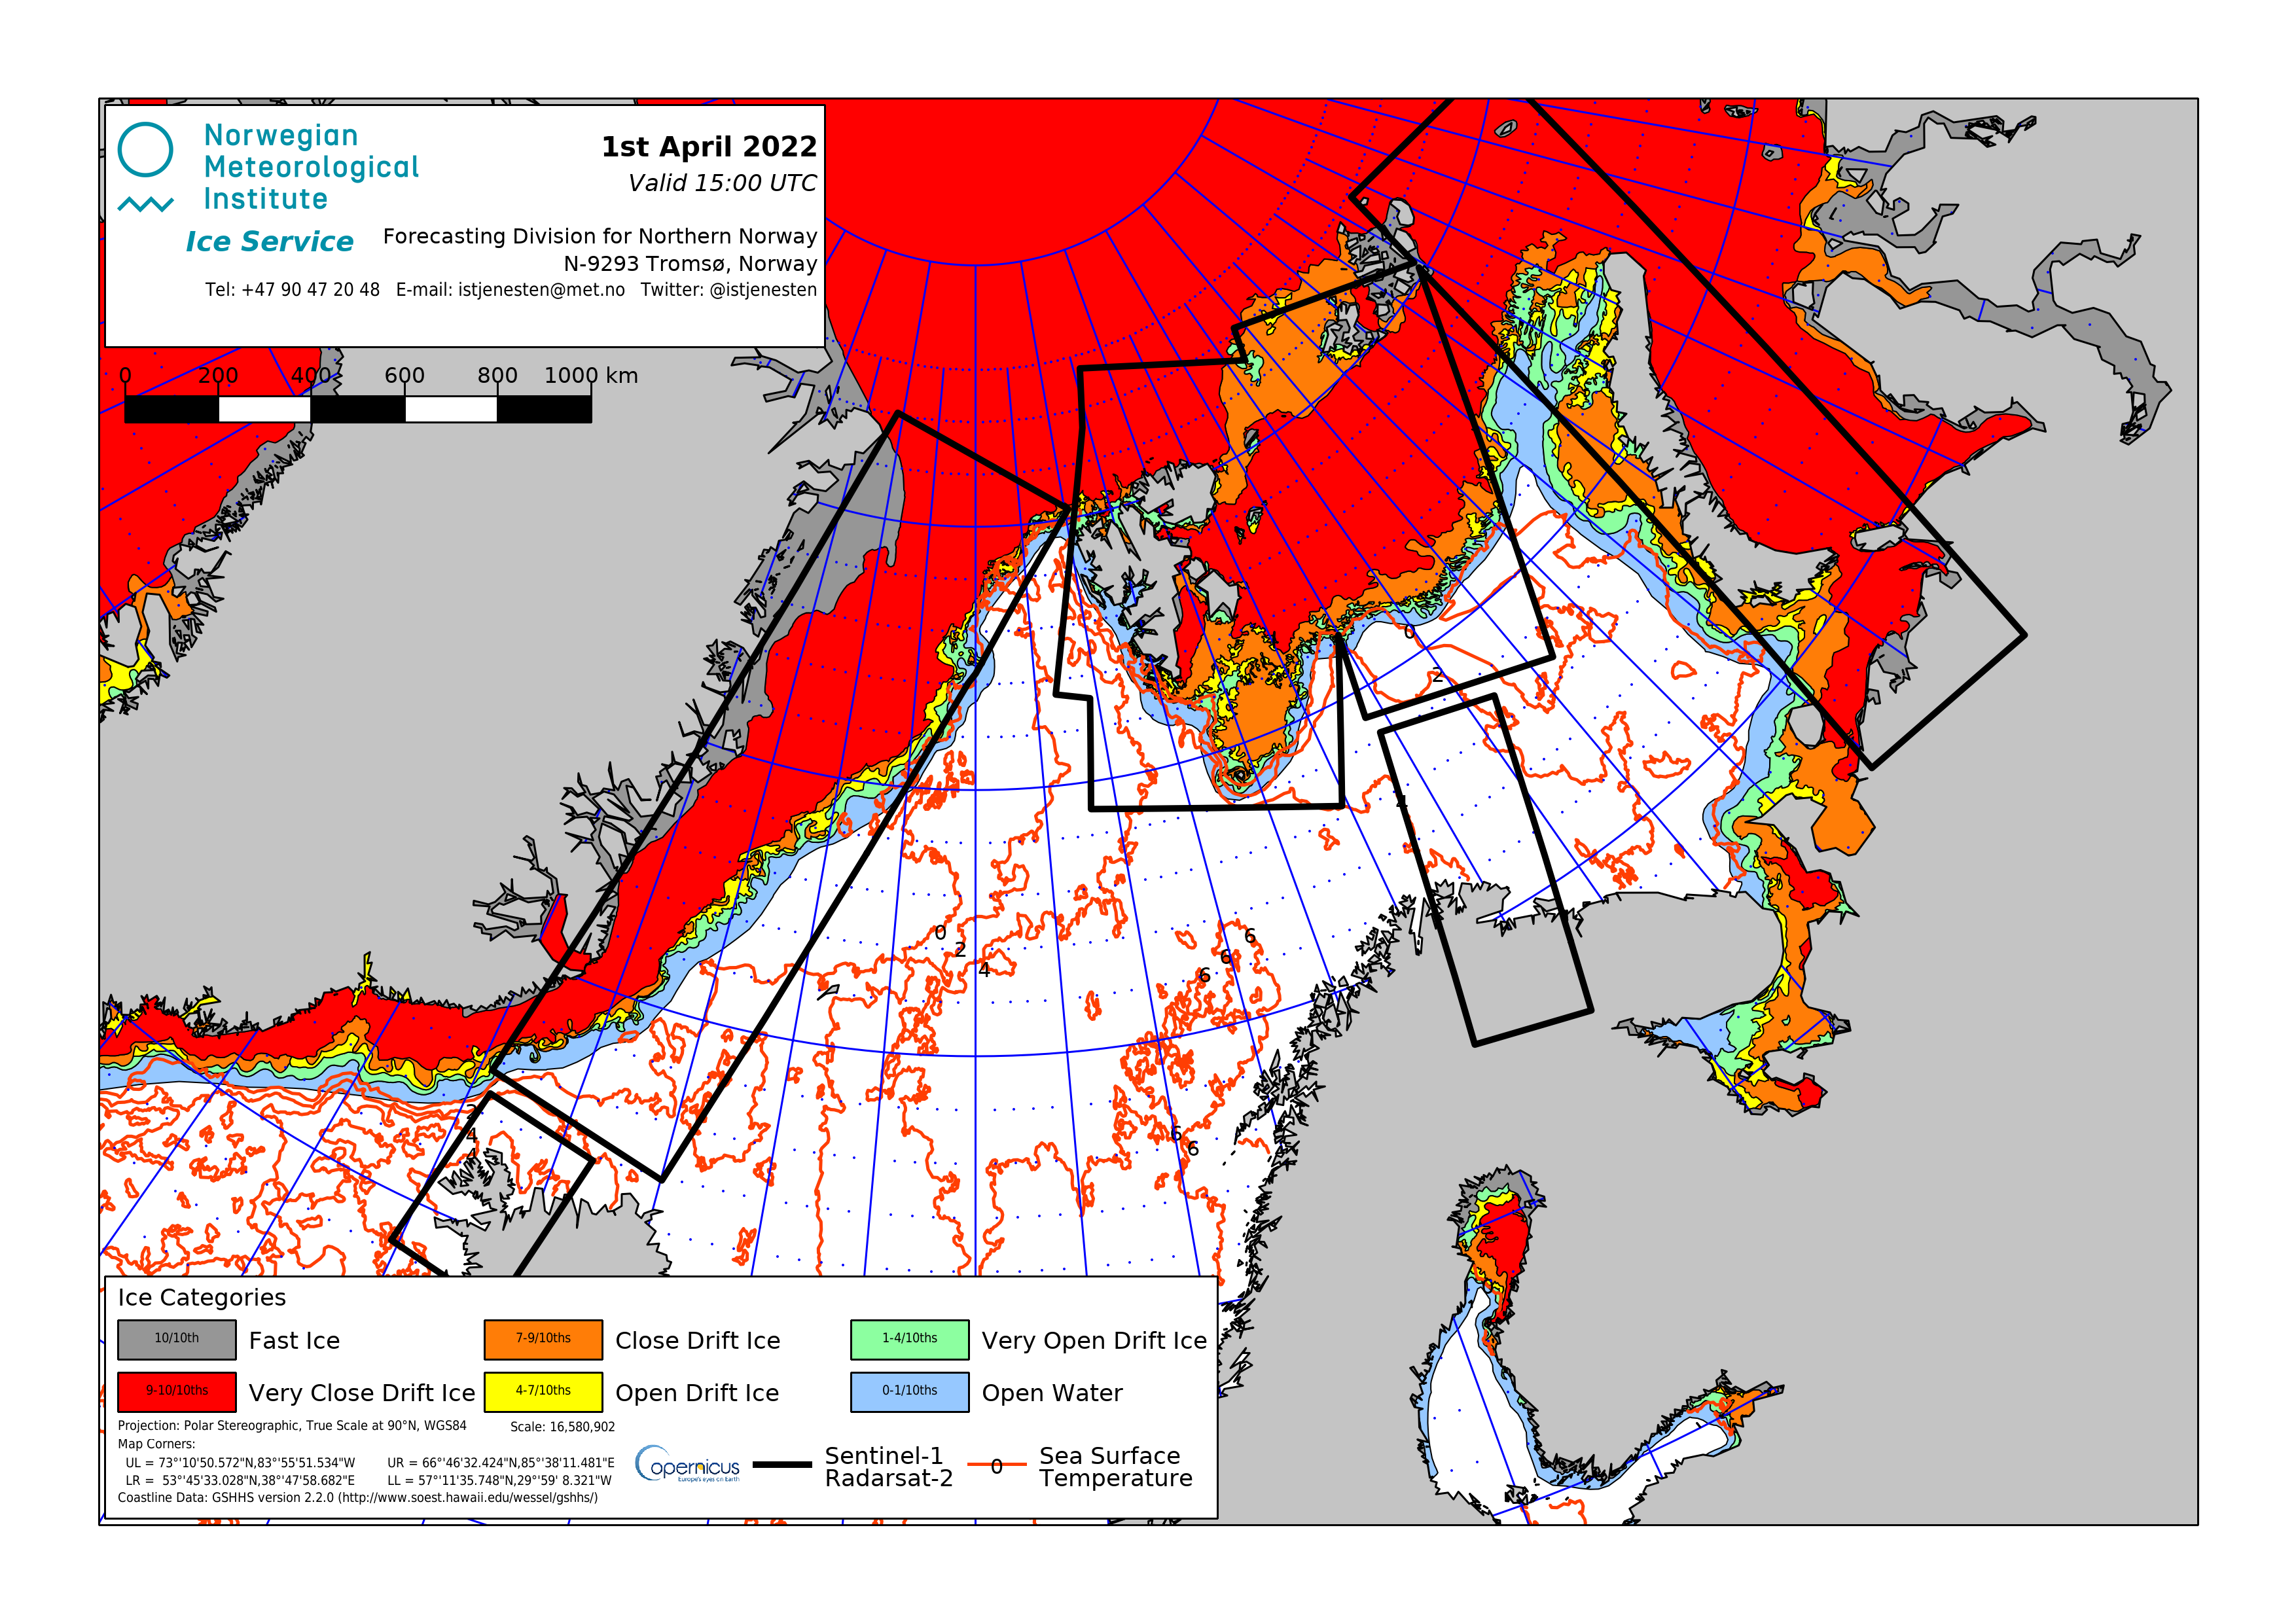
Svalbard closeup

Southern Greenland/Davis Strait closeup, via NSIDC

Overall, nothing spectacular in terms of change compared to last few years: still lots of ice for polar bears to hunt upon for newborn seals, which they will be doing now in almost all regions.


You must be logged in to post a comment.