
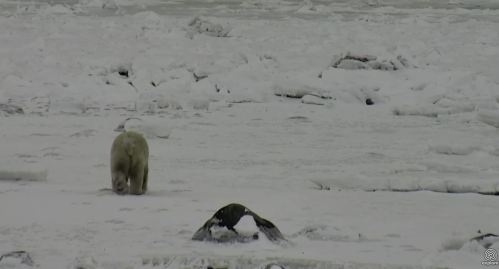
This is the second year in a row that freeze-up of Western Hudson Bay ice has come earlier than average. Movement of tagged bears and reports by folks on the ground in WH show some polar bears are starting to hunt seals on the sea ice that’s developing along the shore. It’s unlikely that a strong wind will again blow the newly-formed ice offshore (as happened earlier this year) because the ice is more extensive. It seems polar bear viewing season in Churchill will be ending early this year, just like it did last year.
The 9 November map Andrew Derocher (University of Albera) published on twitter showing tagged and collared polar bear movements on Hudson Bay makes it look like almost no ice is present:
However, the Canadian Ice Service chart for 10 November shows the ice very clearly:
UPDATE 13 November 2018: See more recent ice charts and the latest (November 4-11, week 19) report from the Polar Bear Alert Program in Churchill that confirms the bears are moving offshore.


You must be logged in to post a comment.